G. Using the Visual C# 2010 Debugger
Objectives
In this chapter you’ll learn:
• To use breakpoints to pause program execution and allow you to examine the values of variables.
• To set, disable and remove breakpoints.
• To use the Continue command to continue execution from a breakpoint.
• To use the Locals window to view and modify variable values.
• To use the Watch window to evaluate expressions.
• To use the Step Into, Step Out and Step Over commands to execute a program line by line.
• To use Just My Code™ debugging.
We are built to make mistakes, coded for error.
—Lewis Thomas
What we anticipate seldom occurs; what we least expect generally happens.
—Benjamin Disraeli
It is one thing to show a man that he is in error, and another to put him in possession of truth.
—John Locke
He can run but he can’t hide.
—Joe Louis
And so shall I catch the fly.
—William Shakespeare
Outline
G.1 Introduction
G.2 Breakpoints and the Continue Command
G.3 DataTips and Visualizers
G.4 The Locals and Watch Windows
G.5 Controlling Execution Using the Step Into, Step Over, Step Out and Continue Commands
G.6 Other Debugging Features
G.6.1 Exception Assistant
G.6.2 Just My Code™ Debugging
G.6.3 Other Debugger Features
G.1 Introduction
In this appendix, you’ll learn about tools and techniques that can be used to address compilation errors and logic errors. Syntax errors are a type of compilation error—an error that prevents code from compiling. Logic errors, also called bugs, do not prevent a program from compiling successfully, but can cause a running program to produce erroneous results or terminate prematurely. Most compiler vendors, like Microsoft, package their IDEs with a tool called a debugger. Debuggers allow you to monitor the execution of your programs to locate and remove logic errors. A program must successfully compile before it can be used in the debugger. The debugger allows you to suspend program execution, examine and set variable values and much more. In this appendix, we introduce the Visual C# 2010 IDE and debugger features for fixing errors in your programs.
G.2 Breakpoints and the Continue Command
While compilation errors can be found automatically by the compiler, it can be much more difficult to determine the cause of logic errors. To help with this, we investigate the concept of breakpoints. Breakpoints are special markers that can be set at any executable line of code. They cannot be placed on comments or whitespace. When a running program reaches a breakpoint, execution pauses, allowing you to examine the values of variables to help determine whether logic errors exist. For example, you can examine the value of a variable that stores a calculation’s result to determine whether the calculation was performed correctly. You can also examine the value of an expression.
To illustrate the debugger features, we use the program in Figs. G.1–G.2 that creates and manipulates an Account (Fig. G.1) object. This example is based on concepts from Chapter 4, so it does not use features that are presented after Chapter 4. Execution begins in Main (lines 8–41 of Fig. G.2). Line 10 creates an Account object with an initial balance of $50.00. Account’s constructor (lines 10–13 of Fig. G.1) accepts one argument, which specifies the Account’s initial balance. Lines 13–14 of Fig. G.2 output the initial account balance using Account property Balance. Lines 18–20 prompt the user for and input the withdrawalAmount. Lines 22–24 subtract the withdrawal amount from the Account’s balance using its Debit method. Line 27 displays the new balance. Next, lines 30–40 perform similar steps to credit the account.
Fig. G.1. Account class with a Debit method that withdraws money from account.


Fig. G.2. Creating and manipulating an Account object.


In the following steps, you’ll use breakpoints and debugger commands to examine variable withdrawalAmount’s value (declared in Fig. G.2) while the program executes.
- Inserting breakpoints in Visual C#.First, ensure that
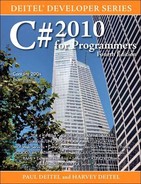
AccountTest.csis open in the IDE’s code editor. To insert a breakpoint, left click inside the margin indicator bar (the gray margin at the left of the code window in Fig. G.3) next to the line of code at which you wish to break, or right click that line of code and select Breakpoint > Insert Breakpoint. Additionally, you can also press F9 when your cursor is on the line to toggle the breakpoint. You may set as many breakpoints as you like. Set breakpoints at lines 18, 24 and 41 of your code. [Note: If you have not already done so, have the code editor display line numbers by opening Tools > Options..., navigating to Text Editor > C# and selecting the Line numbers checkbox.] A solid circle appears in the margin indicator bar where you clicked, and the entire code statement is highlighted, indicating that breakpoints have been set (Fig. G.3). When the program runs, the debugger suspends execution at any line that contains a breakpoint. The program then enters break mode. Breakpoints can be set before running a program, both in break mode and during execution. To show a list of all breakpoints in a project, select Debug > Windows > Breakpoints. This feature is available only in the full version of Visual Studio 2010.Fig. G.3. Setting breakpoints.
- Beginning the debugging process.After setting breakpoints in the code editor, select Build > Build Solution to compile the program, then select Debug > Start Debugging (or press the F5 key) to begin the debugging process. While debugging a console application, the Command Prompt window appears (Fig. G.4), allowing program interaction (input and output).
Fig. G.4. Account program running.

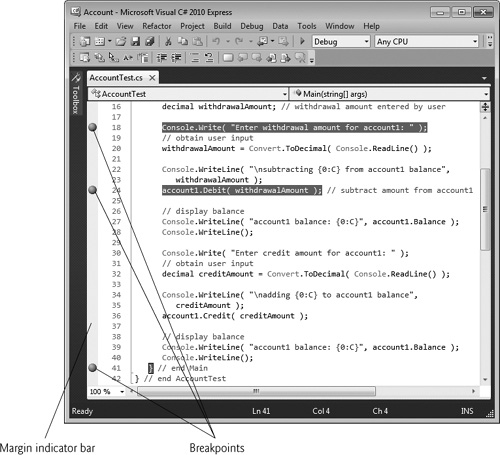
- Examining program execution.Program execution pauses at the first breakpoint (line 18), and the IDE becomes the active window (Fig. G.5). The yellow arrow to the left of line 18, also called the Instruction Pointer, indicates that this line contains the next statement to execute. The IDE also highlights the line as well.
Fig. G.5. Program execution suspended at the first breakpoint.
- Using the Continue command to resume execution.To resume execution, select Debug > Continue (or press the F5 key). The Continue command executes the statements from the current point in the program to the next breakpoint or the end of
Main, whichever comes first. It is also possible to drag the Instruction Pointer to another line in the same method to resume execution starting at that position. Here, we use the Continue command, and the program continues executing and pauses for input at line 20. Enter25in the Command Prompt window as the withdrawal amount. When you press Enter, the program executes until it stops at the next breakpoint (line 24). Notice that when you place the mouse pointer over the variable namewithdrawalAmount, its value is displayed in a Quick Info box (Fig. G.6). As you’ll see, this can help you spot logic errors in your programs.Fig. G.6. Quick Info box displays value of variable
withdrawalAmount.
- Continuing program execution.Use the Debug > Continue command to execute line 24. The program then asks you to input a credit (deposit) amount. Enter
33, then press Enter. The program displays the result of its calculation (Fig. G.7).Fig. G.7. Sample execution of
Account.exein debug mode.
- Disabling a breakpoint.To disable a breakpoint, right click a line of code in which the breakpoint has been set and select Breakpoint > Disable Breakpoint. The disabled breakpoint is indicated by a hollow circle (Fig. G.8)—the breakpoint can be reenabled by right clicking the line marked by the hollow circle and selecting Breakpoint > Enable Breakpoint.
Fig. G.8. Disabled breakpoint.

- Removing a breakpoint.To remove a breakpoint that you no longer need, right click the line of code on which the breakpoint has been set and select Breakpoint > Delete Breakpoint. You also can remove a breakpoint by clicking the circle in the margin indicator bar or pressing F9 when the cursor is on the line.
- Finishing program execution.Select Debug > Continue to execute the program to completion. Then delete all the breakpoints.
G.3 DataTips and Visualizers
You already know how to use the Quick Info window to view a variable’s value. However, often you may want to check the status of an object. For example, you may want to check the Text value of a TextBox control. When you hover the mouse over a reference-type variable while debugging, the DataTip window appears (Fig. G.9). When you hover over the + sign in the DataTip, the DataTip window gives information about the object’s data. There are some limitations—references must be instance variables or local variables, and expressions involving method calls cannot be evaluated.
Fig. G.9. A Data Tip displayed for the account1 variable.

For the Account object, this means that you can see the balance inside it (as well as the Balance property used to access it). Just like the Quick Info window, you can also change the value of a property or variable inside it by clicking on one of the values listed, then typing the new value.
DataTips do not intuitively display information for all variables. For example, a variable representing an XML document cannot be viewed in its natural form using most debugging tools. For such types, visualizers can be useful. Visualizers are specialized windows to view certain types of data. They are shown through DataTip windows by clicking the small magnifying glass next to a variable name. There are three predefined visualizers—advanced programmers may create additional ones. The Text Visualizer lets you see string values with all their formatting included. The XML Visualizer formats XML objects into a color-coded format. Finally, the HTML Visualizer parses HTML code (in string or XML form) into a web page, which is displayed in the small window.
G.4 The Locals and Watch Windows
In the preceding section, you learned how to use the Quick Info and DataTip features to examine the variable’s value. In this section, you’ll learn how to use the Locals window to view all variables that are in use while your program is running. You’ll also use the Watch window to examine the values of expressions.
- Inserting breakpoints.Set a breakpoint at line 24 (Fig. G.10) in the source code by left clicking in the margin indicator bar to the left of line 24. Use the same technique to set breakpoints at lines 27 and 28 as well.
Fig. G.10. Setting breakpoints at lines 24, 27 and 28.

- Starting debugging.Select Debug > Start Debugging. Type
25at the Enter withdrawal amount for account1: prompt (Fig. G.11) and press Enter. The program executes until the breakpoint at line 24.Fig. G.11. Entering the withdrawal amount before the breakpoint is reached.

- Suspending program execution.When the program reaches line 24, the IDE suspends program execution and switches the program into break mode (Fig. G.12). At this point, the statement in line 20 (Fig. G.2) has input the
withdrawal-Amountthat you entered (25), the statement in lines 22–23 has output that the program is subtracting that amount from theaccount1balance and the statement in line 24 is the next statement that executes.Fig. G.12. Program execution pauses when debugger reaches the breakpoint at line 24.

- Examining data.Once the program enters break mode, you can explore the local variable values using the Locals window. If this window is not displayed, select Debug > Windows > Locals. Click the plus to the left of
account1in the Locals window’s Name column (Fig. G.13). This allows you to view each ofaccount1’s instance variable values individually, including the value forbalance(50). The Locals window displays a class’ properties as data, which is why you see both theBalanceproperty and thebalanceinstance variable in the window. In addition, the current value of local variablewithdrawalAmount(25) is displayed.Fig. G.13. Examining local variables.

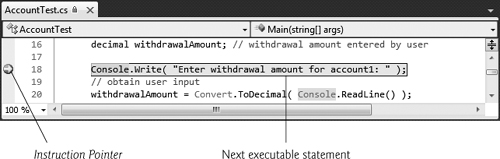
- Evaluating arithmetic and boolean expressions.You can evaluate arithmetic and
boolexpressions using the Watch window. Select Debug > Windows > Watch to display the window (Fig. G.14). In the Name column’s first row (which should be blank initially), type(withdrawalAmount + 10) * 5, then press Enter. The value175is displayed (Fig. G.14). In the Name column’s next row in the Watch window, typewithdrawalAmount == 200, then press Enter. This expression determines whether the value contained inwithdrawalAmountis200. Expressions containing the == symbol are boolean expressions. The value returned isfalse(Fig. G.14), becausewithdrawalAmountdoes not currently contain the value200.Fig. G.14. Examining the values of expressions.
- Resuming execution.Select Debug > Continue to resume execution. Line 24 executes, subtracting the account with the withdrawal amount, and the program enters break mode again at line 27. Select Debug > Windows > Locals. The updated
balanceinstance variable andBalanceproperty value are now displayed (Fig. G.15). The values in red in the window are those that have just been modified.Fig. G.15. Displaying the value of local variables.

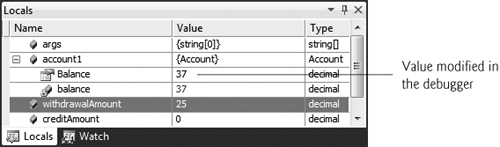
- Modifying values.Based on the value input by the user (
25), the account balance output by the program should be25. However, you can use the Locals window to change variable values during program execution. This can be valuable for experimenting with different values and for locating logic errors in programs. In the Locals window, click the Value field in thebalancerow to select the value25. Type37, then press Enter. The debugger changes the value ofbalance(and theBalanceproperty as well), then displays its new value in red (Fig. G.16). Now select Debug > Continue to execute lines 27–28. Notice that the new value ofbalanceis displayed in the Command Prompt window.Fig. G.16. Modifying the value of a variable.
- Stopping the debugging session.Select Debug > Stop Debugging. Delete all breakpoints, which can be done by pressing Shift + F5.
G.5 Controlling Execution Using the Step Into, Step Over, Step Out and Continue Commands
Sometimes you need to execute a program line by line to find and fix logic errors. Stepping through a portion of your program this way can help you verify that a method’s code executes correctly. The commands you learn in this section allow you to execute a method line by line, execute all of a method’s statements or execute only its remaining statements (if you have already executed some statements in the method).
- Setting a breakpoint.Set a breakpoint at line 24 by left clicking in the margin indicator bar.
- Starting the debugger.Select Debug > Start Debugging. Enter the value
25at the Enter withdrawal amount for account1: prompt. Program execution halts when the program reaches the breakpoint at line 24. - Using the Step Into command.The Step Into command executes the next statement in the program and immediately halts. If the statement to execute is a method call, control transfers to the called method. The Step Into command allows you to follow execution into a method and confirm its execution by individually executing each statement inside the method. Select Debug > Step Into (or press F11) to enter class
Account'sDebitmethod (Fig. G.17).Fig. G.17. Stepping into the
Debitmethod.
- Using the Step Over command.Select Debug > Step Over (or press F10) to enter the
Debitmethod’s body and transfer control to line 25. The Step Over command behaves like the Step Into command when the next statement to execute does not contain a method call or access a property. You’ll see how the Step Over command differs from the Step Into command in Step 10. - Using the Step Out command.Select Debug > Step Out or press Shift-F11 to execute the remaining statements in the method and return control to the calling method. Often, in lengthy methods, you may want to look at a few key lines of code, then continue debugging the caller’s code. The Step Out command executes the remainder of a method and returns to the caller.
- Setting a breakpoint.Set a breakpoint at line 28 of Fig. G.2. This breakpoint is used in the next step.
- Using the Continue command.Select Debug > Continue to execute until the next breakpoint is reached at line 20. This feature saves time when you do not want to step line by line through many lines of code to reach the next breakpoint.
- Stopping the debugger.Select Debug > Stop Debugging to stop debugging.
- Starting the debugger.Before we can demonstrate the next debugger feature, you must restart the debugger. Start it, as you did in Step 2, and enter the same value (
25). The debugger pauses execution at line 24. - Using the Step Over command.Select Debug > Step Over (Fig. G.18). Recall that this command behaves like the Step Into command when the next statement to execute does not contain a method call. If the next statement to execute contains a method call, the called method executes in its entirety (without pausing execution at any statement inside the method—unless there is a breakpoint in the method), and the arrow advances to the next executable line (after the method call) in the current method. In this case, the debugger executes line 24 in
Main(Fig. G.2), which calls theDebitmethod. Then the debugger pauses execution at line 27, the next executable statement.Fig. G.18. Using the debugger’s Step Over command.

- Stopping the debugger.Select Debug > Stop Debugging. Remove all remaining breakpoints.
G.6 Other Debugging Features
Visual C# 2010 provides many other debugging features that simplify the testing and debugging process. We discuss some of these features in this section.
G.6.1 Exception Assistant
You can run a program by selecting either Debug > Start Debugging or Debug > Start Without Debugging. If you select the option Debug > Start Debugging and the runtime environment detects uncaught exceptions, the application pauses, and a window called the Exception Assistant appears, indicating where the exception occurred, the exception type and links to helpful information on handling the exception. We discuss the Exception Assistant in detail in Section 13.3.3.
G.6.2 Just My Code™ Debugging
Throughout this book, we produce increasingly substantial programs that often include a combination of code written by the programmer and code generated by Visual Studio. The IDE-generated code can be difficult to understand—fortunately, you rarely need to look at this code. Visual Studio 2010 provides a debugging feature called Just My Code™ that allows programmers to test and debug only the portion of the code they have written. When this option is enabled, the debugger always steps over method calls to methods of classes that you did not write.
To enable this option, in the Options dialog, select the Debugging category to view the available debugging tools and options. Then click the checkbox that appears next to the Enable Just My Code (Managed only) option (Fig. G.19) to enable or disable this feature.
Fig. G.19. Enabling the Just My Code debugging feature in Visual C#.

G.6.3 Other Debugger Features
You can learn more about the Visual Studio 2010 debugger at
msdn.microsoft.com/en-us/library/sc65sadd.aspx