
Running and Debugging Android Applications
Once we've written the first iteration of our application code, we want to run and test it to identify potential problems or just be amazed at its glory. We have two ways we can achieve this:
- We can run our application on a real device connected to the development PC via USB.
- We can fire up the emulator included in the SDK and test our application there.
In both cases, we have to do a little bit of setup work before we can finally see our application in action.
Connecting a Device
Before we can connect our device for testing purposes, we have to make sure that it is recognized by the operating system. On Windows, this involves installing the appropriate driver, which is part of the SDK installation we installed earlier. Just connect your device and follow the standard driver installation project for Windows, pointing the process to the driver/ folder in your SDK installation's root directory. For some devices, you might have to get the driver from the manufacturer's website. Many devices can use the Android ADB drivers that come with the SDK; however, a process is often required to add the specific device hardware ID to the INF file. A quick Google search for the device name and “Windows ADB” will often get you the information you need to get connected with that specific device.
On Linux and Mac OS X, you usually don't need to install any drivers, as they come with the operating system. Depending on your Linux flavor, you might have to fiddle with your USB device discovery a little bit, usually in the form of creating a new rules file for udev. This varies from device to device. A quick Web search should bring up a solution for your device.
Creating an Android Virtual Device
The SDK comes with an emulator that will run so-called Android virtual devices (AVDs). A virtual device consists of a system image of a specific Android version, a skin, and a set of attributes, which include the screen resolution, SD-card size, and so on.
To create an AVD, you have to fire up the SDK and AVD manager. You can do this either as described previously in the SDK installation step or directly from within Eclipse by clicking the SDK manager button in the toolbar.
- Select Virtual Devices in the list on the left. You will be presented with a list of currently available AVDs. Unless you've already played around with the SDK manager, this list should be empty; let's change that.
- To create a new AVD, click the New… button on the right, which will bring up the dialog shown in Figure 2–7.

Figure 2–7. The AVD creation dialog for the SDK manager
- Each AVD has a name by which you can refer to it later on. The target specifies the Android version that the AVD should use. Additionally, you can specify the size of the SD card of the AVD, as well as the screen size. For our simple “hello world” project, you can select an Android 1.5 target and leave everything else as it is. For real-life testing, you'd usually want to create multiple AVDs that cover all the Android versions and screen sizes you want your application to handle.
NOTE: Unless you have dozens of different devices with different Android versions and screen sizes, you should use the emulator for additional testing of Android version/screen size combinations.
Running an Application
Now that you've set up your devices and AVDs, you can finally run the Hello World application. You can easily do this in Eclipse by right-clicking the “hello world” project in the Package Explorer view and then selecting Run As ![]() Android Application (or you can click the Run button on the toolbar). Eclipse will then perform the following steps in the background:
Android Application (or you can click the Run button on the toolbar). Eclipse will then perform the following steps in the background:
- Compile the project to an APK file if any files have changed since the last compilation.
- Create a new Run configuration for the Android project if one does not already exist. (We'll look at Run configurations in a minute.)
- Install and run the application by starting or reusing an already running emulator instance with a fitting Android version or by deploying and running the application on a connected device (which must also run at least the minimum Android version you specified as the Min SDK Level parameter when you created the project).
If you created only an Android 1.5 AVD, as suggested in the previous section, then the ADT Eclipse plug-in will fire up a new emulator instance running that AVD, deploy the Hello World APK file, and start the application. The output should look like Figure 2–8.

Figure 2–8. The Hello World application in action
The emulator works almost exactly like a real device, and you can interact with it via your mouse just as you would with your finger on a device. Here are a few differences between a real device and the emulator:
- The emulator supports only single-touch input. Simply use your mouse cursor and pretend it is your finger.
- The emulator is missing some applications, such as the Android Market.
- To change the orientation of the device on the screen, don't tilt your monitor. Instead, use the 7 key on your numeric keypad to change the orientation. You have to press the Num Lock key above the numeric keypad first to disable its number functionality.
- The emulator is very slow. Do not assess the performance of your application by running it on the emulator.
- The emulator currently supports only OpenGL ES 1.0 with a few extensions. We'll talk about OpenGL ES in Chapter 7. This is fine for our purposes, except that the OpenGL ES implementation on the emulator is buggy, and it often gives you different results from those you would get on a real device. For now, just keep in mind that you should not test any OpenGL ES applications on the emulator.
Play around with it a little and get comfortable.
NOTE: Starting a fresh emulator instance takes considerable time (up to 10 minutes depending on your hardware). You can leave the emulator running for your whole development session so you don't have to restart it repeatedly, or you can check the "Snapshot" option when creating or editing the AVD, which will allow you to save and restore a snapshot of the VM, allowing for quick launch.
Sometimes when we run an Android application, the automatic emulator/device selection performed by the ADT plug-in is a hindrance. For example, we might have multiple devices/emulators connected, and we want to test our application on a specific device/emulator. To deal with this, we can turn off the automatic device/emulator selection in the Run configuration of the Android project. So, what is a Run configuration?
A Run configuration provides a way to tell Eclipse how it should start your application when you tell Eclipse to run the application. A Run configuration usually allows you to specify things such as command-line arguments passed to the application, VM arguments (in the case of Java SE desktop applications), and so on. Eclipse and third-party plug-ins offer different Run configurations for specific types of project s. The ADT plug-in adds an Android Application Run configuration to the set of available Run configurations. When we first ran our application earlier in the chapter, Eclipse and ADT created a new Android Application Run configuration for us in the background with default parameters.
To get to the Run configuration of your Android project, do the following:
- Right-click the project in the Package Explorer view and select Run As
 Run Configurations.
 - From the list on the left side, select the “hello world” project.
- On the right side of the dialog, you can now modify the name of the Run configuration, and change other settings on the Android, Target, and Commons tabs.
- To change automatic deployment to manual deployment, click the Target tab and select Manual.
When you run your application again, you'll be prompted to select a compatible emulator or device on which to run the application. Figure 2–9 shows the dialog. In this figure, we added several AVDs with different targets and connected two devices.
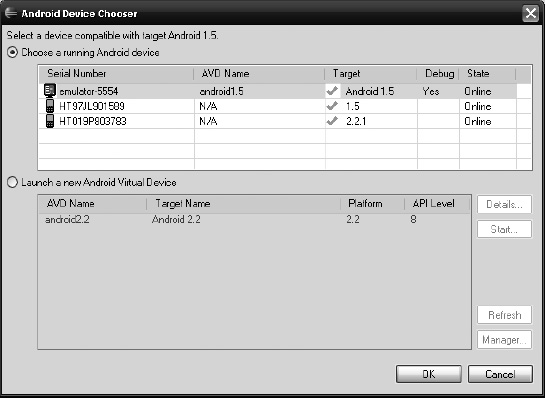
Figure 2–9. Choosing an emulator/device on which to run the application
The dialog shows all the running emulators and currently connected devices as well as all other AVDs not currently running. You can choose any emulator or device on which to run your application.
Debugging an Application
Sometimes your application will behave in unexpected ways or crash. To figure out what exactly is going wrong, you want to be able to debug your application.
Eclipse and ADT provide us with incredibly powerful debugging facilities for Android applications. We can set breakpoints in our source code, inspect variables and the current stack trace, and so forth.
Before we can debug our application, we have to modify its AndroidManifest.xml file to enable debugging. This presents a bit of a chicken-and-egg problem, as we haven't looked at manifest files in detail yet. For now, you should know simply that the manifest file specifies some attributes of your application. One of those attributes is whether the application is debuggable. This attribute is specified in the form of an xml attribute of the <application> tag in the manifest file. To enable debugging, we add the following attribute to the <application> in the manifest file:
android:debuggable="true"
While developing your application, you can safely leave that attribute in the manifest file. But don't forget to remove the attribute before you deploy your application in the market.
Now that you've set up your application to be debuggable, you can debug it on an emulator or device. Usually, you will set breakpoints before debugging to inspect the program state at certain points in the program.
To set a breakpoint, simply open the source file in Eclipse and double-click the gray area in front of the line at which you want to set the breakpoint. For demonstration purposes, do that for line 23 in the HelloWorldActivity class. This will make the debugger stop each time you click the button. The Source Code view should show you a small circle in front of that line after you double-click it, as shown in Figure 2–10. You can remove breakpoints by double-clicking them again in the Source Code view.

Figure 2–10. Setting a breakpoint
Starting the debugging is much like running the application, as described in the previous section. Right-click the project in the Package Explorer view and select Debug As ![]() Android Application. This will create a new Debug configuration for your project, just as in the case of simply running the application. You can change the default settings of that Debug configuration by choosing Debug As
Android Application. This will create a new Debug configuration for your project, just as in the case of simply running the application. You can change the default settings of that Debug configuration by choosing Debug As ![]() Debug Configurations from the Context menu.
Debug Configurations from the Context menu.
NOTE: Instead of going through the Context menu of the project in the Package Explorer view, you can use the Run menu to run and debug applications as well as get access to the configurations.
If you start your first debugging session, Eclipse will ask whether you want to switch to the Debug perspective, which you can confirm. Let's have a look at that perspective first. Figure 2–11 shows how it would look after we start debugging our Hello World application.

Figure 2–11. The Debug perspective
If you remember our quick tour of Eclipse, then you'll know there are several different perspectives, which consist of a set of views for a specific task. The Debug perspective looks quite different from the Java perspective.
- The first new view to notice is the Debug view at the top left. It shows all currently running applications and the stack traces of all their threads if the applications are run in debug mode.
- Below the Debug view is the source-editing view we also used in the Java perspective.
- The Console view prints out messages from the ADT plug-in, telling us what it is doing.
- The LogCat view will be one of your best friends on your journey. This view shows you logging output from the emulator/device on which your application is running. The logging output comes from system components, other applications, and your own application. The LogCat view will show you a stack trace when your application crashes and will also allow you to output your own logging messages at runtime. We'll take a closer look at LogCat in the next section.
- The Outline view is not very useful in the Debug perspective. You will usually be concerned with breakpoints and variables, and the current line on which the program is suspended while debugging. We often remove the Outline view from the Debug perspective to leave more space for the other views.
- The Variables view is especially useful for debugging purposes. When the debugger hits a breakpoint, you will be able to inspect and modify the variables in the current scope of the program.
- Finally, the Breakpoints view shows a list of breakpoints you've set so far.
If you are curious, you've probably already clicked the button in the running application to see how the debugger reacts. It will stop at line 23, as we instructed it by setting a breakpoint there. You will also have noticed that the Variables view now shows the variables in the current scope, which consist of the activity itself (this) and the parameter of the method (v). You can drill down further into the variables by expanding them.
The Debug view shows you the stack trace of the current stack down to the method you are in currently. Note that you might have multiple threads running and can pause them at any time in the Debug view.
Finally, notice that the line where we set the breakpoint is highlighted, indicating the position in the code where the program is currently paused.
You can instruct the debugger to execute the current statement (by pressing F6), step into any methods that get called in the current method (by pressing F5), or continue the program execution normally (by pressing F8). Alternatively, you can use the items on the Run menu to achieve the same. In addition, notice that there are more stepping options than the ones we've just mentioned. As with everything, we suggest you experiment to see what works for you and what doesn't.
NOTE: Curiosity is a building block for successfully developing Android games. You have to get intimate with your development environment to get the most out of it. A book of this scope can't possible explain all the nitty-gritty details of Eclipse, so we urge you to experiment.
LogCat and DDMS
The ADT Eclipse plug-in installs many new views and perspectives to be used in Eclipse. One of the most useful views is the LogCat view, which we touched on briefly in the last section.
LogCat is the Android event-logging system that allows system components and applications to output logging information about various logging levels. Each log entry is composed of a time stamp, a logging level, the process ID from which the log came, a tag defined by the logging application itself, and the actual logging message.
The LogCat view gathers and displays this information from a connected emulator or device. Figure 2–12 shows some sample output from the LogCat view.
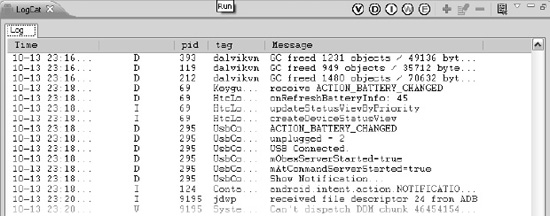
Figure 2–12. The LogCat view
Notice that there are a number of buttons at the top right of the LogCat view.
- The first five allow you to select the logging levels you want to see displayed.
- The green plus button lets you define a filter based on the tag, the process ID, and the log level, which comes in handy if you want to show only the log output of your own application (which will probably use a specific tag for logging).
- The other buttons allow you to edit a filter, delete a filter, or clear the current output.
If several devices and emulators are currently connected, then the LogCat view will output the logging data of only one. To get finer-grained control and even more inspection options, you can switch to the DDMS perspective.
DDMS (Dalvik Debugging Monitor Server) provides a lot of in-depth information about the processes and Dalvik VMs running on all connected devices. You can switch to the DDMS perspective at any time via Window ![]() Open Perspective
Open Perspective ![]() Other
Other ![]() DDMS. Figure 2–13 shows what the DDMS perspective usually looks like.
DDMS. Figure 2–13 shows what the DDMS perspective usually looks like.
As always, several specific views are suitable for our task at hand. In this case, we want to gather information about all the processes, their VMs and threads, the current state of the heap, LogCat information about a specific connected device, and so on.
- The Devices view displays all currently connected emulators and devices, as well as all the processes running on them. Via the toolbar buttons of this view, you can perform various actions, including debugging a selected process, recording heap and thread information, and taking a screenshot.
- The LogCat view is the same as in the previous perspective, with the difference being that it will display the output of the device currently selected in the Devices view.
- The Emulator Control view lets you alter the behavior of a running emulator instance. You can force the emulator to spoof GPS coordinates for testing, for example.
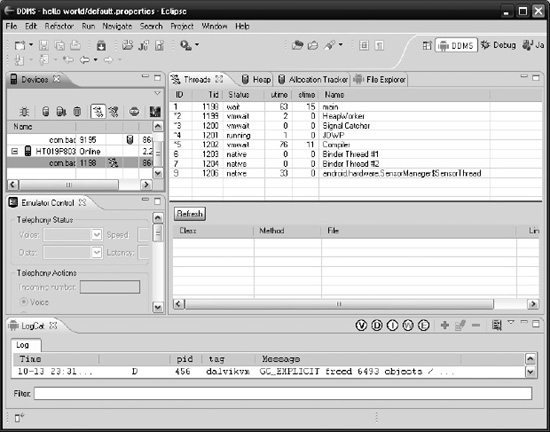
Figure 2–13. DDMS in action
- The Threads view displays information about the threads running on the process currently selected in the Devices view. The Threads view shows this information only if you also enable thread tracking, which can be achieved by clicking the fifth button from the left in the Devices view.
- The Heap view, which is not shown in Figure 2–13, gives information about the status of the heap on a device. As with the thread information, you have to enable heap tracking in the Devices view explicitly by clicking the second button from the left.
- The Allocation Tracker view shows which classes have been allocated the most within the last few moments. This view provides a great way to hunt down memory leaks.
- Finally, there's the File Explorer view, which allows you to modify files on the connected Android device or emulator instance. You can drag and drop files into this view as you would with your standard operating system file explorer.
DDMS is actually a standalone tool integrated with Eclipse via the ADT plug-in. You can also start DDMS as a standalone application from the $ANDROID_HOME/tools directory(%ANDROID_HOME%/tools on Windows). DDMS does not directly connect to devices, but uses the Android Debug Bridge (ADB), another tool included in the SDK. Let's have a look at ADB to round off your knowledge about the Android development environment.
Using ADB
ADB lets you manage connected devices and emulator instances. It is actually a composite of three components:
- A client that runs on the development machine, which you can start from the command line by issuing the command
adb(which should work if you set up your environment variables as described earlier). When we talk about ADB, we refer to this command-line program. - A server that also runs on your development machine. The server is installed as a background service, and it is responsible for communication between an ADB program instance and any connected device or emulator instance.
- The ADB daemon, which also runs as a background process on every emulator and device. The ADB server connects to this daemon for communication.
Usually, we use ADB via DDMS transparently and ignore its existence as a command-line tool. Sometimes ADB can come in handy for small tasks, so let's quickly go over some of its functionality.
NOTE: Check out the ADB documentation on the Android Developers site at http://developer.android.com for a full reference list of the available commands.
A very useful task to perform with ADB is to query for all devices and emulators connected to the ADB server (and hence your development machine). To do this, execute the following command on the command line (note that > is not part of the command).
< adb devices
This will print a list of all connected devices and emulators with their respective serial numbers, and it will resemble the following output:
List of devices attached

HT97JL901589    device

HT019P803783    device
The serial number of a device or emulator is used to target specific subsequent commands at it. The following command will install an APK file called myapp.apk located on the development machine on the device with the serial number HT019P803783.
> adb –s HT019P803783 install myapp.apk
The –s argument can be used with any ADB command that performs an action that is targeted at a specific device.
Commands that will copy files to and from the device or emulator also exist. The following command copies a local file called myfile.txt to the SD card of a device with the serial number HT019P803783.
> adb –s HT019P803783 push myfile.txt /sdcard/myfile.txt
To pull a file called myfile.txt from the SD card, you could issue the following command:
> abd pull /sdcard/myfile.txt myfile.txt
If there's only a single device or emulator currently connected to the ADB server, you can omit the serial number. The adb tool will automatically target the connected device or emulator for you.
Of course, the ADB tool offers many more possibilities. Most are exposed through DDMS, and we'll usually use that instead of going to the command line. For quick tasks, though, the command-line tool is ideal.