Logging and tracing are the tools for identifying what is going on in the system and with particular business processes. Another important aspect of keeping a system in good condition is gathering the information via metrics and statistics. This way, we can identify the troubles a system might have on an operational level. We are also able to explore a system's overall health condition.
To show you how gathering information works, we will use the BPEL process we prepared for the Creating a custom logger in a BPEL process recipe.
The following steps in this recipe will describe how to efficiently review the previously collected metrics and statistics:
- Start the recipe by logging in to the Oracle Enterprise Manager Console with the admin user.
- From the left tree, select the SOA server, right-click on it, and select Monitoring | Performance Summary as shown in the following screenshot:

- We get a window with some basic metric definitions. Click on the Show Metric Palette button in the palette search for our BPEL process (it should be under the Members | default | Members section).
- From the SOA Composite – Rate Metrics section, we select the following two metrics:
- Synchronous messages throughput in the last 5 minutes
- Total synchronous messages average time
- The Performance Summary chart now looks as shown in the following screenshot:

- Click on the Table View link below the charts to see the tabular presentation of the data as shown in the following screenshot:

Oracle SOA Suite comes with a predefined set of metrics out of the box. The metrics provide valuable feedback from the system. The metrics are divided into two major groups: the first group contains generic metrics and the second one contains process-oriented metrics. We can also set a different time range for data collection, from a few minutes to weeks or months.
There is one additional concept worth mentioning. When you log in to the Oracle Enterprise Manager Console, you'll see the dashboard. The dashboard will show you the health of the system from a single point of view. It is divided into the following sections:
Recent Composite Instances: In this section, you will see the latest business process instances that were started
Deployed Composites: In this section, you will see all the deployments and their corresponding status
Recent Faults and Rejected Messages: This section will show you whether some extraordinary event is requesting immediate attention
Service Engines: This section will show you the number of deployments and the of the number of faults on the deployed modules
Composite Instances: This section will show you the faults in graphical presentation number of instances created since server startup as well as the number of faults originated from the instance run
Since SOA (and BPEL as a part of it) acts as an orchestrating technology, we would also like to know in what condition the system is in at the time of processing requests from outer systems. For that purpose, we can utilize the request processing statistics:
- Start the recipe by logging in to the Oracle Enterprise Manager Console with the admin user.
- From the left tree, select the SOA server, right-click on it, and select Monitoring | Request Processing.
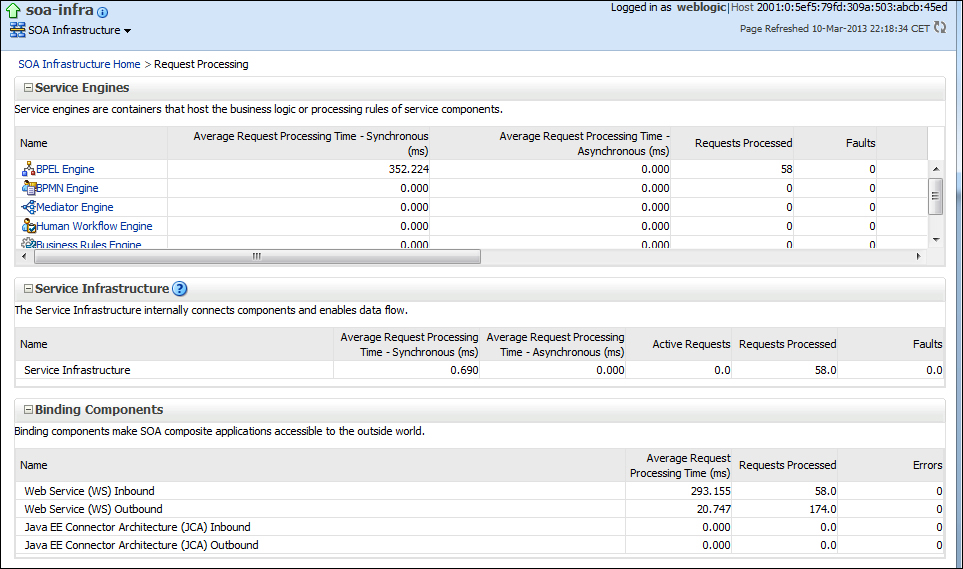
- You'll get a window that contains the following predefined set of statistics:
- Average sync and async request processing times on each of the servers
- Average sync and async request processing times at the level of service infrastructure
- Average processing times for binding components (web services and Java EE Connector Architecture).
- In the Oracle SOA Suite Mangement Console, you'll get the following window containing information about statistics: