
CHAPTER THIRTEEN
Driver-Based Budgeting and Rolling Financial Forecasts
THERE IS NOW A better approach to forecasting the location and level of resources and budgeted expenditures. Sometimes called activity-based budgeting (ABB), this approach recognizes that the need for resources originates with a demand-pull triggered by customers, citizens, or any end users of the organization's services and capabilities. In contrast, traditional budgeting tends to extrapolate the level of resource spending for each spending line item for all of the cost centers (e.g., departments) from the spending levels of past periods, and then adds a small percentage increase to allow for monetary inflation. In the traditional approach to budgeting, the budget process starts with the current level of expenses. A problem with budgeting this way is that the past is not a reliable indicator of the future. It is insensitive to changes in demand volume to the organization and any or all of its cost centers.
Increasingly, today's more knowledgeable managers correctly believe that the budget should flow backward in the reverse direction from the outputs to the resources. Activity-based budgeting (ABB) flows backward. ABB assists in logically determining what levels of resources – the types and numbers of employees and spending for supplier or contractors – are required to meet the future demands placed on the organization.
In the 1980s, financial planners – particularly in the US federal government – actually experimented with a precursor to ABB. It was called zero-based budgeting (ZBB). Managers' instincts then were similar to what they are today. Managers suspected it might be better to imagine a budgeting process where each department begins its budget thinking with a clean slate, as if it were just starting up new and staffing the department from scratch. In other words, what resources would a department need next year if it had no idea what it had last year?
However, timing is everything when it comes to major changes in management techniques – and the timing was not right in the 1980s for ZBB to be successful. Cost pressures were not as significant then as they are today. In addition, software modeling tools for ZBB were hard to come by. Those conditions have now changed for the better. Some organizations have implemented ABC/M system that have routinely recalculated with revisions for several years. The more advanced and mature ABC/M users have already constructed models that depict their cost structure and expense behavior reasonably well. The timing and conditions are now suitable for change.
In the first decade of the 2000s, the more mature and advanced ABC users increasingly began using their calculated activity costs, as well as unit-level cost consumption rates for intermediate work outputs and for products and services, as a basis for projecting the resource expense levels and their resulting costs. Popular uses of the ABC information for cost estimating have been for calculating work order quotations and for make-or-buy analysis. The ABC information was also being recognized as a predictive planning tool for ABB. It is now becoming apparent that ABC information has tremendous utility both for examining the “as-is” current condition of the organization and for achieving a desired “to-be” state.
BUDGETING: USER DISCONTENT AND REBELLION
Why is interest in activity-based budgeting (ABB) increasing? Simply put, many managers have problems with the annual budget process, and not just because they are not getting approval for the funding they want. They are disturbed by the budgeting process altogether. There is great cynicism about budgeting as well as an intuitive sense that a better way to budget exists.
Often, a substantial change in management technique is born of a combination of dissatisfaction with current methods and a vision of what a replacement method could look like. For the adoption of ABB, both conditions are present today.
Why are managers and employees cynical about the annual budgeting process? They find that the process takes too long to prepare, is too detailed, and is excessively burdensome. In addition, they view budgeting as a political game that usually results in some departments being overfunded while others labor on as have-nots. Many workers in this latter group toil without relief. Through organizational downsizing, senior management has often removed employees but not taken out the work! Across-the-board cuts in manpower, some of the slash-and-burn variety, are likely to cut into the muscle in some places while still leaving fat as excess capacity in others. Figure 13.1 provides some sarcasm about traditional budgeting in the form of a check-the-box survey.
Thankfully, there is a vision of what a better way of budgeting looks like: ABB. But ABB is better for what purpose and for whom? Fundamentally, we need to understand the purpose of a budget.
Most people think that a budget is a set of predetermined spending limits put in place so that if all departments roughly spend what was allotted to them, then the estimated total approved spending limit for the organization will be reasonably achieved. In this way of thinking, the purpose of a budget is as a control tool rather than as an analytical and resource allocation tool. As an example, don't exceed your spending limit, or you'll get your hand slapped by the accounting police: “You took two more airline flights than planned. Explain why.”

FIGURE 13.1 Quiz: “Our budgeting exercise.”
Source: Copyright 2019 www.garycokins.com.
The broader purpose of budgeting should be to predetermine the level of resource expenses that will be required, such as the types and number of employees, material, supplies, and equipment, to achieve an expected or desired amount of demand for the employees' services – meaning the demands for their work. ABB advocates are interested in the notion of resource requirements as being the result of budgeting, not the starting point. ABB advocates want to be able to first estimate oncoming customer, citizen, and management demands; and second determine the supply of resources, in terms of expenses, that will be needed to match the supply with the work demands. In short, ABB advocates want to reverse the traditional budget equation and start with the expected outcomes, not with the existing situation.
With hindsight, we now realize that the fund accounting and general ledger systems, as well as their budgets derived from them, are a mirror of the organization chart, not of the end-to-end business processes that traverse the department “boxes” in the organization chart. But the processes are what actually deliver value to customers, citizens, and service recipients. And worse, the budget has no visibility into the “content of work” – the time and effort of work activities. Moreover, it has no provisions for logically determining how external or internal cost drivers govern the levels of spending caused by demands on work from those cost drivers. Traditional budgeting is done more by push than pull.
Here are further observations about traditional budgeting, some of which appeared in the survey quiz in Figure 13.1:
- Today's budget preparation process takes an extraordinarily long time, sometimes months, during which the organization often reshuffles and resizes. In addition, customers and citizens often change their behavior, for which a prudent reaction often cannot be accommodated in the budget.
- The annual budget is steeped in tradition in some organizations, yet the effort of producing it heavily outweighs the benefits it supposedly yields.
- Budgets are useful for organizations that are stable and in which senior managers do not trust their organization to spend money intelligently or with discipline. Both of those conditions are invalid today.
- Many companies confuse budgeting (i.e., spending control) with financial planning (i.e., forecasting). Computer models today can forecast the expected outcomes of all sorts of assumption-based scenarios without the need for a formal budget exercise.
- The budget should reflect and support the executive team's strategy. Strategies should be formulated at two levels. First, the diversification strategy level answers, “What should we be doing?” Second, the operational strategy level asks, “How should we do it?” Unfortunately, most of the effort is on the latter question, and organizations get preoccupied with simply finishing the budget – which by that time the budget may be disconnected from the executive's strategy.
- “Use it or lose it” is a standard practice for managers during the last fiscal quarter because their next year's budget will be pegged to what they projected to spend this year. Budgets can be an invitation to some managers to spend needlessly.
In response to the rising awareness that current methods of budgeting are flawed and deficient, leaders should move away from siloed cost center planning to process-based thinking with demand volume planning. Many commercial companies spend months preparing their budget prior to the fiscal year being budgeted. Public sector organizations likely devote a similar amount of time to creating a budget. And the budget is typically obsolete within a few months after it is published. A better way to budget will consolidate what is today an extremely fragmented and disjointed exercise, as will be described in this chapter.
WHAT'S BROKEN ABOUT BUDGETING?
How many people in your organization love the annual budgeting process? Probably few or even none. The mere mention of the word “budget” raises eyebrows and evokes cynicism. It should.
What is broken about the annual budgeting process? Here are some of the issues related to budgeting:
- Obsolete budgeting. As listed in the quiz in Figure 13.1, the budget data is out of date within weeks after it is published, which took months to prepare it.
- Bean-counter budgeting. The budget is considered a fiscal exercise produced by the accountants that is disconnected from the strategy of the executive team – and from the mission-critical spending needed to implement the strategy.
- Political budgeting. The loudest voice, the strongest political muscle, and the prior year's budget levels should not be valid ways to award resources for next year's spending.
- Overscrutinized budgeting. Often the budget is revised midyear or, more frequently, with new forecasted spending. Then an excess amount of attention focuses on analyzing the differences between the actual and new projected expenses. These include budget-to-forecast, last-forecast-to-current-forecast, actual-to-budget, actual-to-forecast, and so on. This reporting provides lifetime job security for the budget analysts in the accounting department.
- Sandbagging budgeting. The budget numbers that roll up from lower- and mid-level managers often mislead senior executives because of sandbagging (i.e., padding) by the veteran managers who know how to play the game.
- Wasteful budgeting. Budgets do not identify waste. In fact, inefficiencies in the current business processes are often “baked into” next year's budget. Budgets do not support continuous improvement.
- Blow-it-all budgeting. Reckless “use it or lose it” is a standard practice for managers during the last fiscal quarter. This is because their next year's budget will be pegged to what they projected to spend this year. Budgets can be an invitation to some managers to spend needlessly.
As earlier mentioned, the annual budget is steeped in tradition, yet the effort of producing it heavily outweighs the benefits it supposedly yields. How can budgeting be reformed? Or should the budget process be abandoned altogether because its inflexible fixed social contract incentives to managers drives behavior counter to the organization's changing goals and its unwritten “contract” with executives? And, if the budget is abandoned, then what should replace its underlying purpose?
The accountants do not help matters. When they develop the annual budget, they equate the functional silos to the responsibility cost center view that they capture expense transactions in their general ledger and fund accounting system. When they request each cost center manager to submit the next year's budget, ultimately it is an “incremental or decremental” game. That is, each manager begins with their best estimate of their current year's expected total spending – line-item by line-item – and they incrementally increase it with a percentage. Budgeting software reinforces this bad habit by making it easy to make these calculations. At the extreme, next year's spending for each line is computed as shown in Figure 13.2. Using spreadsheet software, you multiply the first line-item expense by the increment, in this example by 5%, and simply copy and paste that formula for every line-item below it. Isn't it laughable? But the truth hurts. This is what leads to that use-it-or-lose-it unnecessary blow-it-all spending earlier described.

FIGURE 13.2 Spreadsheet budgeting: it's incremental!
Source: Copyright 2019 www.garycokins.com.
As described in Chapter 8, “By this evolution point in budgeting, there is poor end-to-end visibility about what exactly drives what inside the organization. Some organizations eventually evolve into intransigent bureaucracies. Some functions become so embedded inside the broader organization that their work level is insensitive to changes in the number and types of external requests. Fulfilling these requests was the origin of why their function was created in the first place. They become insulated from the outside world.” This is not a pleasant story, but it is pervasive.
THE FINANCIAL MANAGEMENT INTEGRATED INFORMATION DELIVERY PORTAL
Today's solution to solve the budgeting conundrum and the organization's backward-looking focus is to begin with a single integrated data platform – popularly called a business intelligence (BI) platform – and its Web-based reporting and analysis capabilities. Speed to knowledge is now a key to improving performance.
The emphasis for improving an organization and driving higher value must shift from hand-slap punishment controlling toward automated forward-looking planning. With a common platform replacing disparate data sources, enhanced with input data integrity cleansing features and data mining capabilities, an organization can create a flexible and collaborative planning environment. Part Six describes information technology as enabler to VBM.
A RADICAL IDEA: STOP BUDGETING!
Some commercial companies have become sufficiently frustrated with the annual budgeting process that they have abandoned creating an annual budget. An international research and membership collaborative called the Beyond Budgeting Round Table (BBRT)1 advocates that rather than attempt to tightly control managers' spending on a line-by-line basis, it is better to step back and question what the purposes of budgeting are. Their conclusion is that organizations would be better off moving away from long-term financial projections at a detailed level and replacing this form of monitoring by empowering managers with more freedom to make local spending decisions, including hiring employees.
BBRT believes in removing second-guess approvals from higher-level managers and granting managers more decision rights. BBRT views fiscal year-end budget figures as if they are a fixed contract that managers will strive for rather than react to changes not assumed when the budget was created. In place of budget spending variance controls, BBRT advocates a shift in reporting emphasis and also accountability with consequences on outcomes – performance reporting with KPIs and their targets – not on the inputs. BBRT believes that secondary purposes for budgeting, such as cash flow projections for the treasury function, can be attained with modeling techniques performed by business analysts.
Regardless of how an organization approaches its own reforms to budgeting, VBM provides confidence in the numbers, which improves trust among managers. What today will accelerate the adoption of reforms to the budgeting process and a VBM culture – senior management's attitude and willpower or the information technology that can realize the vision described here? This book's authors would choose both.
PREDICTIVE ACCOUNTING AND BUDGETING WITH MARGINAL EXPENSE ANALYSIS2
Managers are increasingly shifting from reacting to after-the-fact outcomes to anticipating the future with predictive analysis. They are proactively making adjustments with better decisions. Despite some advances in the application of new costing techniques, are management accountants adequately satisfying the need for better cost planning information? Or is the gap widening?
There is a widening gap between what management accountants provide and report and what managers and employee teams want and need. This does not mean that information produced by management accountants is of little value. In the last few decades, accountants have made significant strides in improving the utility and accuracy of the historical costs they calculate and report as described in prior chapters of this book. The gap is caused by a shift in managers' needs, from needing to know what things cost (such as a cost of a service or task) and what happened to a need for reliable information about what their future costs will be and why.
Despite the accountants advancing a step to catch up with the increasing needs of managers for insights and cost information to make better decisions, the managers have advanced beyond their accountants. The accountants need to catch up. The rest of this chapter will help us understand this widening gap, and more importantly how accountants can narrow and ideally close the gap.
WHAT IS THE PURPOSE OF MANAGEMENT ACCOUNTING?
Contrary to beliefs that the only purpose of managerial accounting is to collect, transform, and report data, its primary purpose is first and foremost to influence behavior at all levels – from the desk of the CEO down to each employee – and it should do so by supporting decisions. A secondary purpose is to stimulate investigation and discovery by surfacing relevant information (and consequently bringing focus) and generating questions.
The widening gap between what accountants report and what decision makers need involves the shift from analyzing descriptive past period historical information to analyzing predictive information, such as budgets and what-if scenarios. Obviously, all decisions can only impact the future because the past is already history. However, there is much that can be learned and leveraged from historical information. Although accountants are gradually improving the quality of reported history, decision makers are shifting their view toward better understanding the future.
This shift is a response to a more overarching shift in executive management styles, from a command-and-control emphasis that is reactive (such as scrutinizing cost variance analysis of actual versus planned outcomes) to an anticipatory, proactive style where organizational changes and adjustments, such as staffing levels, can be made before things happen and before minor problems become big ones.
Figure 13.3 illustrates the large domain of accounting as a taxonomy with three components: tax accounting, financial accounting, and managerial accounting. (This figure was created by this book's author, Gary Cokins, for the International Federation of Accountants [IFAC], an organization with global accounting institutes as its members.) Two types of data sources are displayed at the upper right. The upper source is from financial transactions and bookkeeping, such as purchases and payroll. The lower source is nonfinancial measures such as payroll hours worked or number of services delivered. Many are the activity drivers used with ABC. These same metrics can be forecasted.
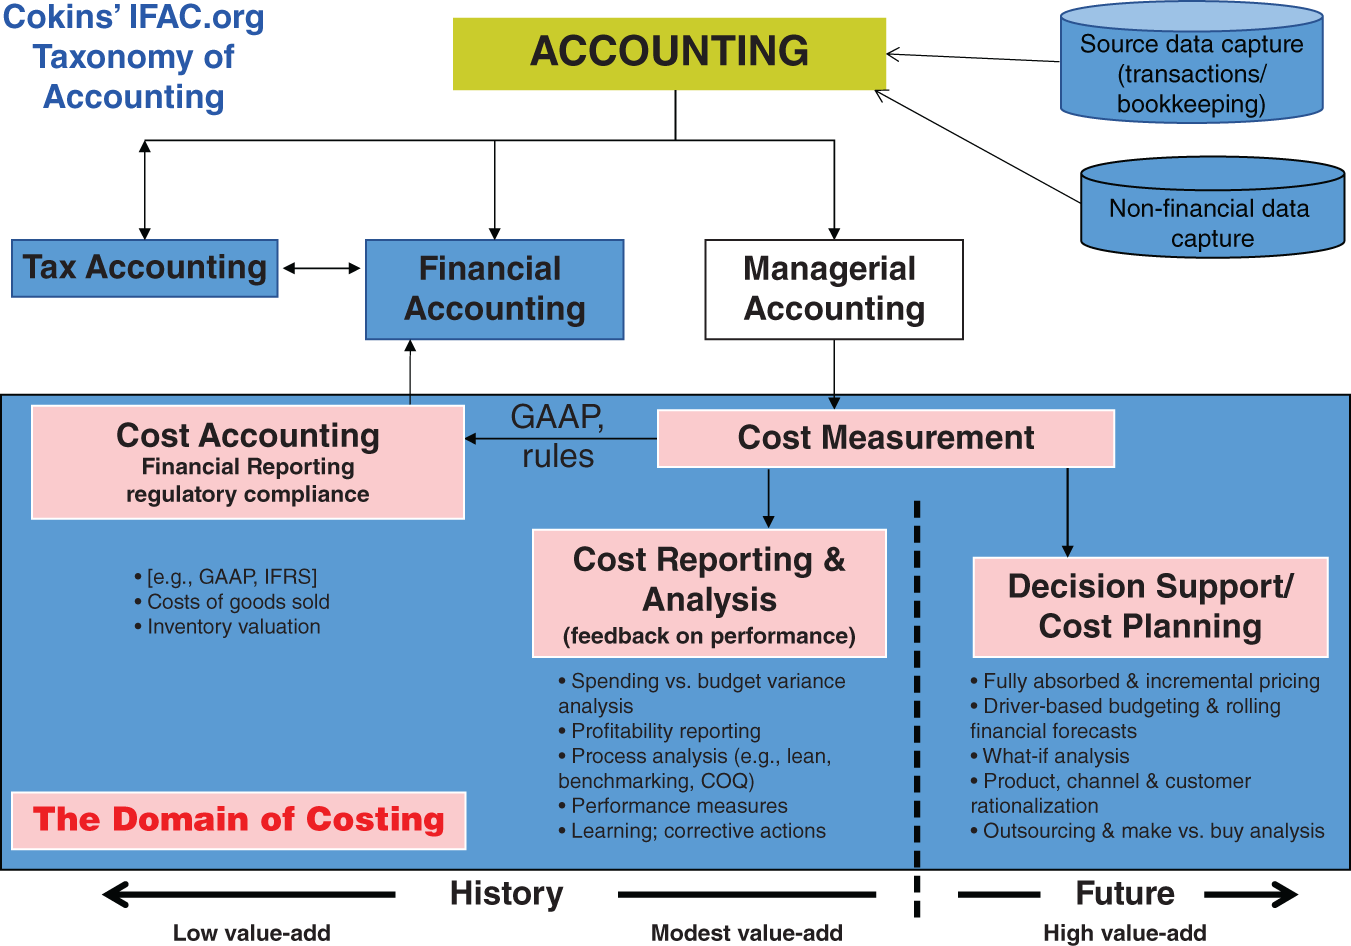
FIGURE 13.3 Cokins's IFAC.org taxonomy of accounting.
Source: Based on data from PABC IGPG “Evaluating and Improving Costing in Organizations” published by the International Federation of Accountants, 2009. Copyright 2019 www.garycokins.com.
The financial accounting component in the figure is intended for external statutory reporting, such as for regulatory agencies, banks, stockholders, and the investment community. Financial accounting follows compliance rules aimed at economic valuation, and as such is typically not adequate or sufficient for decision making. And the tax accounting component is its own world of legislated rules.
Our area of concern – the management accounting component – is segmented into three categories: cost accounting, the cost reporting and analysis, and decision support with cost planning. To oversimplify a distinction between financial and managerial accounting, financial accounting is about valuation and managerial accounting is about value creation through good decision making.
The message at the bottom of the figure is the value, utility, and usefulness of the accounting information increases, arguably at an exponential rate, from the left side to the right side of the figure.
DESCRIPTIVE VERSUS PREDICTIVE ACCOUNTING
Figure 13.4 illustrates how a firm's view of its expense structure changes as analysis shifts from the historical cost reporting view to the predictive cost planning view. The latter is the context from which decisions are considered and evaluated.
In the figure's left-hand side during the historical time period, the resource expenses were incurred. The capacity these expenses were incurred for was supplied, and then they were either (1) unused as idle or protective buffer capacity; or (2) they were used to make products, to deliver services, or to sustain the organization internally. This is the cost reporting and analysis component from Figure 13.3 that calculates output costs. The money was spent, and costing answers where it was used. This is the descriptive view of costs. Accountants refer to this as full absorption costing when all the expenses for a past time period are totally traced to outputs. It traces expenses (and hopefully does not allocate expenses on causal-insensitive broad averages by using ABC) to measure which outputs (e.g., services) uniquely consumed the resources. Full absorption costing uses direct costing methods, which are relatively easy to apply, and ideally supplements the reporting with ABC for the indirect and shared expenses, which are trickier to model, calculate, and report.
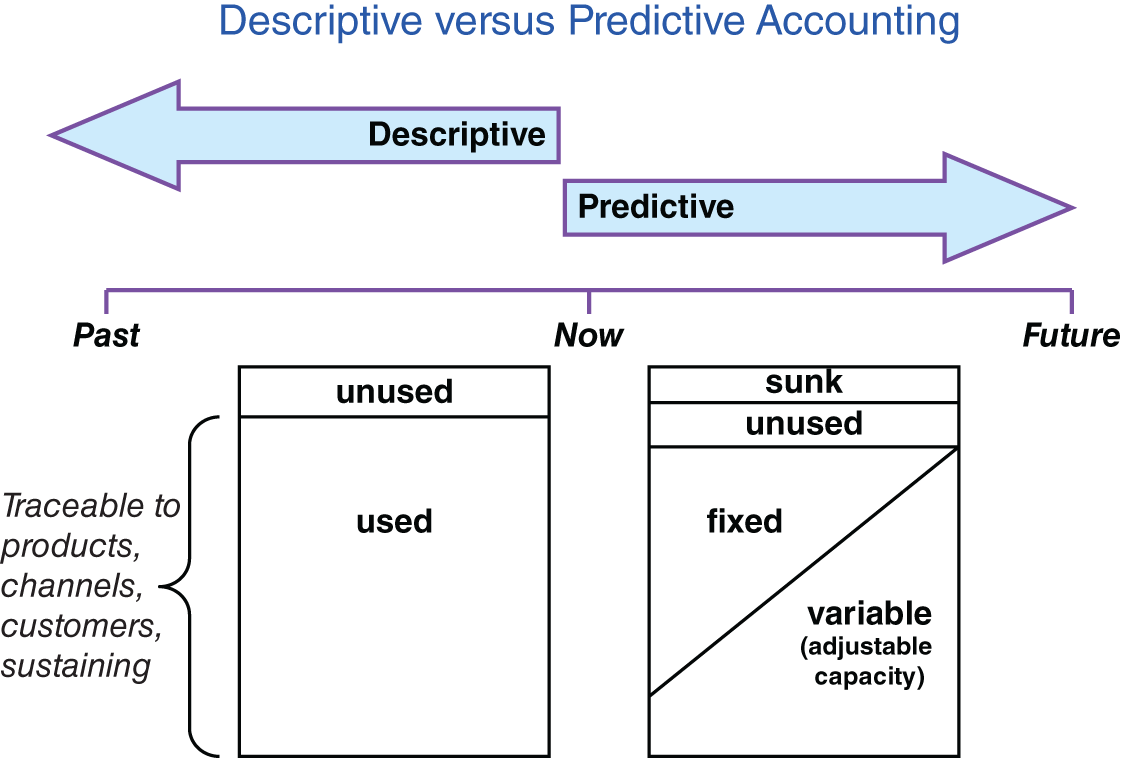
FIGURE 13.4 Descriptive versus predictive accounting.
Source: Copyright 2019 www.garycokins.com.
In contrast, the figure's right-hand side is the predictive view of costs – the decision support with cost planning component from Figure 13.3. In the future, the capacity levels and types of resources can be adjusted. Capacity only exists as a resource, not as a process or work activity. The classification of a resource's expense as sunk, fixed, semi-fixed, or variable depends on the planning time horizon. The diagonal line reveals that in the very short term, most capacity and its expenses are not easily changed; hence, they are classified as fixed. As the time horizon extends into the future, then capacity becomes adjustable. For example, assets can be leased, not purchased; and future workers can be contracted from a temporary employment agency, not hired as full-time employees. Therefore, these expenses are classified as variable.
In the predictive view of Figure 13.3 changes in demand – such as the forecasted volume and mix of services or work orders – will drive the consumption of processes (and the work activities that belong to them). In turn, this will determine what level of both fixed and variable resource expenses are needed to supply capacity for future use. For purchased assets, such as expensive equipment, these costs are classified as sunk costs. Their full capacity and associated expense were acquired when an executive authorized and signed their name to the purchase order for the vendor or contractor. Some idle capacity (such as staffing a call center) is typically planned for. This deliberately planned idle capacity is intended to meet temporary demand surges, or as an insurance buffer for the uncertainty of the demand forecast accuracy.
Since decisions only affect the future, the predictive view is the basis for analysis and evaluation. The predictive view applies techniques like what-if analysis and simulations. These projections are based on forecasts and unit-level cost consumption rates. However, cost consumption rates are ideally derived as calibrated rates from the historical, descriptive view – where the rate of operational work typically remains constant until productivity and process improvements affect them. These rates are for both direct expenses and rates that can be calibrated from an ABC system. And when improvements or process changes occur, the calibrated historical cost consumption rates can be adjusted up or down from the valid baseline measure that is already being experienced. Accountants refer to these projections as marginal or incremental expense analysis. For example, as future incremental demands change from the existing, near-term baseline operations, how is the supply for needed capacity affected? Marginal and incremental costing will be discussed later in this chapter.
WHAT TYPES OF DECISIONS ARE MADE WITH MANAGERIAL ACCOUNTING INFORMATION?
There are hundreds of pages on managerial and cost accounting in university textbooks. Let's try to distill all those pages to a few paragraphs. The broad decision-making categories for applying managerial accounting are:
- Rationalization. Which products, services, channels, routes, citizens, customers, and others are best to retain or improve? And, which are not and should potentially be abandoned or terminated (if possible)?
Historical and descriptive costing can be adequate to answer these questions. In part, this explains the growing popularity in applying ABC principles to supplement traditional direct costing. There is much diversity and variation in routes, channels, citizens, customers, and so on that cause a relative increase in an organization's indirect and shared expenses to manage the resulting complexity. IT expenses are a growing one. Having the direct and indirect costs become a relevant starting point allows you to know what the variations cost. This answers a “What?” question. It is difficult, arguably impossible, to answer the subsequent “So what?” question without having the facts. Otherwise, conclusions are based on gut feel, intuition, misleading information, or politics.
- Planning and budgeting. Based on forecasts of future demand volume and mix for types of services or products, combined with assumptions of other proposed changes, how much will it cost to match demand with supplied resources (e.g., workforce staffing levels)?
This is a “Then what?” question. When questions like these and many more like them are asked, one needs more than a crystal ball to answer them. This is where the predictive view of costing (the right side of Figure 13.3) fits in. This is arguably the sweet spot of costing. On an annual cycle, this is the budgeting process. However, executives are increasingly demanding rolling financial forecasts at shorter time intervals. This demand is partially due to the fact that, as previously mentioned, the annual budget can quickly become obsolete and future period assumptions, especially continuously revised demand volume forecasts, become more certain. At its core, this costing sweet spot is about resource capacity planning – the ability to convert and reflect physical operational events into the language of money – expenses and costs.
- Capital expense justification. Is the return on investment (ROI) of a proposed asset purchase, such as equipment or an information system, justified?
If we purchase equipment, technology, or a system, will the financial benefits justify the investment? A question like this involves what microeconomics refers to as “capital budgeting.” Capital budgeting analysis typically involves comparing a baseline, reflecting business as usual, with an alternative scenario that includes spending on (i.e., investing in) an asset where the expected benefits will continue well beyond a year's duration. An example would be investing in an automated warehouse to replace manual, pick-and-pack labor. Some refer to the associated investment justification analysis as “same as, except for” or comparing the “as-is” state with the “to-be” state. A distinction of capital budgeting is that it involves discounted cash flow (DCF) equations. DCF equations reflect the net present value (NPV) of money, incorporating the time that it would take for that same money to earn income at some rate if it were applied elsewhere (e.g., a bank certificate of deposit). The rate is often called the organization's cost of capital.
- Make-versus-buy and general outsourcing decisions. Should we continue to do work ourselves or contract with a third party?
If we choose to have a third party make our product or deliver our service instead of ourselves – basically outsourcing, or vice versa by bringing a supplier's work in-house – then afterward, how much of our expenses remain and how much will we remove (or add)? This type of decision is similar to the logic and math of capital budgeting. The same description of the capital budgeting method applies – measuring “same as, except for” incremental changes. Ideally, activity-based costing techniques should be applied because the primary variable is the work activities that the third-party contractor will now perform, which replace the current in-house work. Since cost is not the only variable that shifts, a service-level agreement with the contactor should be a standard practice.
- Process and productivity improvement. What can be changed? How to identify opportunities? How to compare and differentiate high-impact opportunities from nominal ones?
Some organizations' operations functions are focusing on reducing costs and future cost avoidance. (Strategic profitable revenue enhancement is addressed with managerial accounting for rationalization.) These operational functions are tasked with productivity improvement challenges, and they are less interested in understanding strategic analysis and more on streamlining processes, reducing waste and low-value-added work activities, and increasing asset utilization. This is the area of Six Sigma quality initiatives, lean management principles, and just-in-time (JIT) scheduling techniques. Examples of these types of costs are:
- Unit costs of outputs and benchmarking
- Target costing
- Cost of quality (COQ)
- Value-adding attributes (such as non-value added vs. value-added)
- Resource consumption accounting (RCA)
- German cost accounting (Grenzplankostenrechnung [GPK])
- Accounting for a lean management environment (also Kaizen costing)
- Theory of constraint's throughput accounting
The term “cost estimating” is a general one. It applies in all of the decision-making categories above. One might conclude that the first category, rationalization, focuses only on historical costs and thus does not require cost estimates. However, the impact on resource expenses from adding or dropping various work-consuming outputs (i.e., products, services, citizens, customers) also requires cost estimates to validate the merit of a proposed rationalization decision.
ACTIVITY-BASED COST MANAGEMENT AS A FOUNDATION FOR PREDICTIVE ACCOUNTING
ABC/M information is now also being recognized as a predictive planning tool. It is now apparent that the information has a tremendous amount of utility for both examining the “as-is” current condition of the organization and achieving a desired “to-be” state.
Cost estimating is often involved with what-if scenarios. The reality is that decisions are being made about the future, and managers want to evaluate the consequences of those decisions. In these situations, the future is basically coming at the organization, and in some way the quantity and mix of activity drivers will be placing demands on the work that the organization will need to do. The resources required to do the work are the expenses. Assumptions are made about the outputs that are expected. Assumptions should also be made about the intermediate outputs and the labyrinth of interorganizational relationships that will be called upon to generate the expected final outcomes.
MAJOR CLUE: CAPACITY ONLY EXISTS AS A RESOURCE
As most organizations plan for their next month, quarter, or year, the level of resources supplied is routinely replanned to roughly match the demand volume and expected future demand volume. In reality, the level of planned resources must always exceed demand volume to allow for some protective buffer, surge, and sprint capacity. This also helps improve service performance levels. However, management accountants will be constantly disturbed if they cannot answer the question “How much unused and spare capacity do I have?” because in their minds this excess capacity equates to non-value-added costs.
The broad topic of unused and idle capacity will likely be a thorny issue for absorption costing. As management accountants better understand operations, they will be constantly improving their ability to segment and isolate the unused capacity (and the nature of its cost) by individual resource. Managerial accountants will be increasingly able to measure unused capacity either empirically or by deductive logic based on projected standard cost rates. Furthermore, accountants will be able to segment and assign this unused capacity expense to various processes, managers, or senior management. This will eliminate overcharging (and overstating) service costs resulting from including unused capacity costs that the product did not cause.
Figure 13.5 illustrates that the effort level to adjust capacity becomes easier farther out in time. It takes a while to convert in-case resources into as-needed ones. However, committed expenses (in-case) today can be more easily converted into contractual (as-needed) arrangements in a shorter time period than was possible ten years ago. Fixed expenses can become variable expenses. The rapid growth in the temporary staffing industry is evidence. Organizations can replace full-time employees who are paid regardless of the demand level with contractors who are staffed and paid at the demand level, which may be measured in hours.
Understanding the cost of the resource workload used to make a product or deliver a service is relevant to making these resource reallocation decisions. Ignoring incremental changes in the actual resources (i.e., expense spending) when making decisions can eventually lead to a cost structure that may become inefficient and ineffective for the organization. There will always be a need to adjust the capacity based on changes in future demand volume and mix. This in turn equates to raising or lowering specific expenses on resources.

FIGURE 13.5 Capacity only exists as resources.
Source: Copyright 2019 www.garycokins.com.
PREDICTIVE ACCOUNTING INVOLVES MARGINAL EXPENSE CALCULATIONS
In forecasting, the demand volume and mix of the outputs are estimated, and one then solves for the unknown level of resource expenditures that will be required to produce and deliver the volume and mix. One is basically determining the capacity requirements of the resources. Estimating future levels of resource expense cash outflows becomes complex because resources come in discrete discontinuous amounts. For example, you cannot hire one-third of an employee. That is, resource expenses do not immediately vary with each incremental increase or decrease in end-unit volume. Traditional accountants address this with what they refer to as a “step-fixed” category of expenses.
As previously mentioned, the predictive accounting method involves extrapolations that use baseline physical and unit-level cost consumption rates that are calibrated from prior-period ABC/M calculations.
Figure 13.6 illustrates how capacity planning is the key to the solution. It is a closed loop flow. Planners and budgeters initially focus on the direct and recurring resource expenses, not the indirect and overhead support expenses. They almost always begin with estimates of future demand in terms of volumes and mix. Then, by relying on standards and averages (such as the product routings and bills-of-material used in manufacturing systems), planners and budgeters calculate the future required levels of manpower headcount and spending with suppliers and contractors. The predictive accounting method suggests that this same approach can be applied to the indirect and overhead areas as well or to processes where the organization often has a wrong impression that they have no tangible outputs.
Demand volume drives activity and resource requirements. Predictive accounting is forward-focused, but it uses actual historical performance data to develop baseline unit-level cost consumption rates. Activity-based planning and budgeting assesses the quantities of workload demands that are ultimately placed on resources. In step 1 in the figure, predictive accounting first asks, “How much activity workload is required for each output of cost object?” These are the work activity requirements. Then predictive accounting asks, “How much resources are needed to meet that activity workload?” In other words, a workload can be measured as the number of units of an activity required to produce a quantity of cost objects.

FIGURE 13.6 Predictive accounting closed-loop information flow.
Source: Copyright 2019 www.garycokins.com.
The determination of expense does not occur until after the activity volume has been translated into resource capacity using the physical resource driver rates from the direct costing and ABC/M model. These rates are regularly expressed in hours, full-time-equivalents (FTEs), square feet, pounds, gallons, and so forth.
As a result of step 1 there will be a difference between the existing resources available and the resources that will be required to satisfy the plan – the resource requirements. That is, at this stage organizations usually discover they may have too much of what they do not need and not enough of what they do need to meet the customers' expected service levels (e.g., to deliver on time). The consequence of having too much implies a cost of unused capacity. The consequence of having too little is a limiting constraint that if not addressed implies there will be a decline in customer service levels.
In step 2 a reasonable balance must be achieved between the operational and financial measures. Now capacity must be analyzed. One option is for the budgeters, planners, or management accountants to evaluate how much to adjust the shortage and excess of actual resources to respond to the future demand load. Senior management may or may not allow the changes. There is a maximum expense impact that near-term financial targets (and executive compensation plan bonuses) will tolerate. These capacity adjustments represent real resources with real changes in cash outlay expenses if they were to be enacted.
Assume that management agrees to the new level of resources without further analysis or debate. In step 3 of the flow in the figure, the new level of resource expensed can be determined and then translated into the expenses of the work centers and eventually into the costs of the products, service lines, channels, citizens, and customers. Step 3 is classic cost accounting – but for a future period. Some call this a pro forma calculation. The quantities of the projected resource and activity drivers are applied; and new budgeted or planned costs can be calculated for products, service lines, outputs, citizens, customers, and service recipients.
At this point, however, the financial impact may not be acceptable to the executive team. When the financial result is unacceptable, management has options other than to continue to keep readjusting resource capacity levels. For example, they can limit demand volume.
PREDICTIVE COSTING IS MODELING
By leveraging ABC/M with predictive accounting, an organization can produce a fully integrated plan including budgets and rolling financial forecasts. It can be assured that its plan is more feasible, determine the level of resources and their expenses to execute that plan, then view and compare the projected results of that plan against its current performance to manage its various profit margins.
All this may seem like revisiting an Economics 101 textbook. In some ways it is, but here is the difference: in the textbooks, marginal expense analysis was something easily described but extremely difficult to compute due to all of the complexities and interdependencies of resources and their costs. In the past, computing technology was the impediment. Now things have reversed. Technology is no longer the impediment – the thinking is. How one configures the predictive accounting model and what assumptions one makes become critical to calculating the appropriate required expenses and their pro forma calculated costs.
PUT YOUR MONEY WHERE YOUR STRATEGY IS
An easy way for executive teams to attempt to reduce their organization's expenses is to lay off employees. But this is merely a short-term fix. An organization cannot continue to endlessly reduce its expenses to achieve long-term sustained prosperity.
Belt-tightening an organization's spending can be haphazard. Rather than evaluating where the company can cut costs, it is more prudent to switch views and ask where and how the organization should spend money to increase long-term sustained value. This involves budgeting for future expenses, but as described here the budgeting process has deficiencies.
A SEA CHANGE IN ACCOUNTING AND FINANCE
How can budgeting be reformed? Let's step back and ask broader questions. What are the impacts of the changing role of the chief financial officer (CFO)? How many times have you seen the obligatory diagram with the organization shown in a central circle and a dozen inward-pointing arrows representing the menacing forces and pressures the organization faces – such as outsourcing, globalization, governance, and so on? Well, it's all true and real. But if the CFO's function is evolving from a bean counter and reporter of history into a strategic business adviser and an enterprise risk and regulatory compliance manager, what should CFOs be doing about the archaic budget process?
Progressive CFOs now view budgeting as consisting of three river streams of spending that converge to yield the total enterprise spending for the next fiscal year:
- Recurring expenses. Budgeting becomes an ongoing resource capacity planning exercise similar to a 1970s factory manager who must project the operation's manpower planning and material purchasing requirements. These are repeatable processes that are driven by demand volume.
- Nonrecurring expenses. The budget includes the one-time investments or project cash outlays to implement projects and initiatives. These are project driven.
- Discretionary expenses. The budget includes optional spending that is nonstrategic.
Of the broad portfolio of interdependent methodologies that make up today's VBM framework, two methods deliver the capability to accurately project the recurring and nonrecurring spending streams:
- Demand-driven operational expense projections. As previously described in this book, activity-based costing (ABC) solves the structural deficiencies of myopic general-ledger cost-center reporting for calculating accurate costs of outputs (such as products, channels, and customers). The general ledger does not recognize cross-functional business processes that deliver the results, and its broad-brush cost allocations of the now-substantial indirect expenses introduce grotesque cost distortions. ABC corrects those deficiencies. Advances with applying ABC/M enables that “backward calculation mentioned. It is based on forecasts of demand item volume multiplied times calibrated unit-level cost consumption rates to determine the needed capacity and thus the needed recurring expenses. Without that spending, service levels will deteriorate.
- Project-driven expenses. Later in this chapter, three types of projects will be described: strategy goals execution, risk mitigation, and capital investments.
A PROBLEM WITH BUDGETING
Companies cannot succeed by standing still. If you are not improving, then you are falling behind. This is one reason why Professor Michael E. Porter, author of the seminal 1970 book on competitive edge strategies, Competitive Strategy: Techniques for Analyzing Industries and Competitors, asserted that an important strategic approach is continuous differentiation and improvement of products and services. However, some organizations believed so firmly in their past successes that they were shut down or outsourced (e.g., government agencies) or went bankrupt (e.g., companies) because they had become risk-adverse to changing what they perceived to be effective strategies.
As described in Chapters 3 and 4 of this book, strategy execution is considered one of the major failures of executive teams. One of the obstacles preventing successful strategy achievement is the annual budgeting process. In the worst situations, the budgeting process is limited to a fiscal exercise administered by the accountants, which is typically disconnected from the executive team's strategic intentions. A less poor situation, but still not a solution, is one in which the accountants do consider the executive team's strategic objectives, but the initiatives required to achieve the strategy are not adequately funded in the budget. Remember, you have to spend money to make money. This introduces the question “Can your organization afford its strategy?”
In addition, the budgeting process tends to be insensitive to changes in future volumes and mix of forecast products and services. As described in the prior chapter, the next year's budgeted spending is typically incremented or decremented for each cost center from the prior year's spending by a few percentage points.
Components of the VBM framework can be drawn on to resolve these limitations. The big arrow at right side of Figure 13.7 illustrates that the correct and valid amount of spending for capacity and consumed expenses should be derived from two broad streams of workload that cause the need for spending: demand driven and project driven. Demand-driven expenses are operational and recurring from day to day. In contrast, project-driven spending is nonrecurring and can be from days to years in time duration.
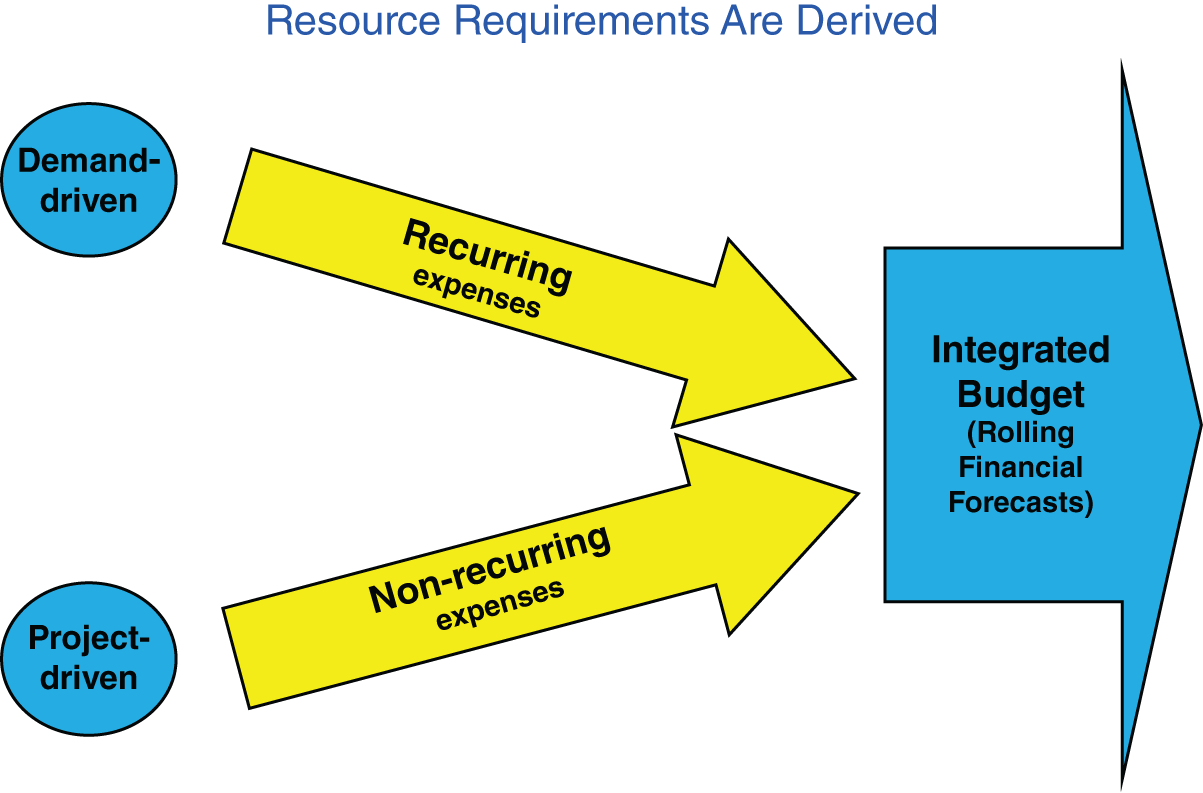
FIGURE 13.7 Resource requirements are derived.
Source: Copyright 2019 www.garycokins.com.
VALUE IS CREATED FROM PROJECTS AND INITIATIVES, NOT THE STRATEGIC OBJECTIVES
As described in Chapter 4, a popular solution for failed strategy execution is the evolving methodology of a strategy map with its companion, the balanced scorecard with KPIs and their targets. Their combined purpose is to link operations to strategy. By using these methods like a strategy map, alignment of the work and priorities of employees can be attained without any disruption from restructuring the organizational chart. A strategy map and its balanced scorecard directly connect the executive team's strategy to individuals, regardless of their departments or matrix-management arrangements.
In Chapter 4 the authors also argued that projects and initiatives should be defined from the strategy map. What matters is that the projects and initiatives be financially funded regardless of how they are identified. Figure 13.8 revisits Figure 4.6. It illustrates who ideally should be responsible for one of the five elements of each strategic objective in a strategy map: the executive team or the managers and employees.

FIGURE 13.8 Nonrecurring expenses/strategic initiatives.
Source: Copyright 2019 www.garycokins.com.
In Figure 13.8, the second column of X choices, what if the managers and employee teams that identified the projects are not granted spending approval by the executives for those initiatives? Presuming that KPIs with targets were established for those projects, these managers will score poorly and unfavorably. But worse yet, the strategic objectives the projects are intended to achieve will not be accomplished. By isolating this spending as strategy expenses, the organization protects these; otherwise it is like destroying the seeds for future success and growth. Capital budgeting is a more mature practice and not the issue that budgeting for strategic projects and initiatives is.
Value creation does not directly come from defining mission, vision, and strategy maps. It is the alignment of employees' priorities, work, projects, and initiatives with the executive team's objectives that directly creates value. Strategy is executed from the bottom to the top. David Norton (co-creator of the balanced scorecard with Robert S. Kaplan) uses a fisherman's analogy to explain this: strategy maps tell you where the fish are, but the projects, initiatives, and core business processes are what catch the fish.
DRIVER-BASED RESOURCE CAPACITY AND SPENDING PLANNING
For daily operations where the normal recurring work within business processes occurs, a future period's amount of product- and service-line volume and mix will never be identical to the past. In future periods, some customer-demand quantities will rise and others decline. This means that unless the existing capacity and dedicated skills are adjusted, you will have too much unnecessary capacity and not enough capacity that is needed. These are dual problems. The former results in unused capacity expenses. The latter results in missed sales opportunities, or customer-infuriating delays due to capacity shortages. Both drag down profits.
Figure 13.9 illustrates advances in applying activity-based costing (ABC/M) to minimize this planning problem. ABC/M principles solve operational budgeting by leveraging historical consumption rates to be used for calculating future-period levels of capacity and spending.
As an oversimplification, future spending is derived by calculating the ABC/M cost assignment network backward. This was described in Figure 13.6 closed loop activity-based planning and budgeting (ABP/B). The organization starts by forecasting its activity-driver quantities (those were the actual driver quantities for past-period costing). Then it uses the calibrated activity driver unit-level consumption rates from its historical costing to compute the amount of required work activities in the operational processes. Next, it equates these workloads into the number and types of employees and the needed non-labor-related spending.
This technique provides the correct, valid resource capacity and spending requirements. With this knowledge, management can intelligently intervene and approve adjustments by adding or removing capacity. It is a logical way of matching supply with demand. Once the capacity interventions (e.g., employee headcount) and planned spending are approved, then a true and valid driver-based budget can be derived – not an incremental or decremental percent change from last year – for each cost center.

FIGURE 13.9 Recurring expenses/future volume and mix.
Source: Copyright 2019 www.garycokins.com.
INCLUDING RISK MITIGATION WITH A RISK ASSESSMENT GRID
Measuring and managing risk possibilities identified in step 3 is now transitioning from an intuitive art to more of a craft and science. (Risk management was discussed in Chapter 6.)
To introduce quantification of risk to this area that involves qualitative and subjectivity, at some stage each identified risk requires some form of ranking, such as by level of severity from the impact if the risk even were to occur – high, medium, and low. Since the severity of a risk event includes not just its impact but also its probability of occurrence, developing a risk assessment grid has become an accepted method to quantify the risks and then collectively associate and rationalize all of them with a reasoned level of spending for risk mitigation. A risk map helps an organization visualize all risks on a single page.
Figure 13.10 displays a risk assessment grid with the vertical axis reflecting the magnitude of impact of the risk event occurring on the strategy execution and the horizontal axis reflecting the probability of each risk event's occurrence. Individual risk events located as circles in the map are inherent risks and not yet selected for mitigation actions; that evaluation comes next. The risks located in the lower left area require periodic glances to monitor if the risk is growing: nominal to no risk mitigation spending. At the other extreme, risk events in the upper right area deserve risk mitigation spending with frequent monitoring.
The risks in the risk assessment grid are evaluated for mitigation action. What this grid reveals is that risks number 2, 3, 7, 8, and 10 are in a critical zone. Management must decide if it can accept these five risks considering their potential impact and likelihood. If not, management might choose to avoid whatever is creating the risk as for example entering a new market. Some mitigation action might be considered that would drive the risks to a more acceptable level in terms of impact and likelihood. As examples, an action might result in transferring some of the risk through a joint venture, or it might involve incurring additional expense through hedging.

FIGURE 13.10 Risk assessment grid.
Source: Copyright 2019 www.garycokins.com.
Management must decide on the cost versus benefits of the mitigation actions. Will the mitigation action, if pursued, move a risk event within the predefined risk appetite guidelines? Is the residual risk remaining after mitigation action acceptable? If not, what additional action can be taken? How much will that additional action cost, and what will be the potential benefits in terms of reducing impact and likelihood? After these decisions are made, then similar to the projects and initiatives derived from the strategy map, risk mitigation actions can be budgeted.
FOUR TYPES OF BUDGET SPENDING: OPERATIONAL, CAPITAL, STRATEGIC, AND RISK
Figure 13.11 illustrates a broad framework that begins with strategy formulation in the upper left and ends with financial budgeting and rolling forecasts in the bottom right. The elements involving accounting are shaded darker. Some budgets and rolling financial forecasts may distinguish the capital budget spending (#2 in the figure) from operational budget spending (#1), but rarely do organizations segregate the important strategic budget spending (#3) and risk budget spending (#4).
The main purpose of the figure is to illustrate that the budget depends on and is derived from two separate sources: (1) a future demand-driven source (operational) and (2) a project-based source (capital, strategic, and risk mitigation).
Ideally, the strategy creation in the upper left uses meaningful managerial accounting information, such as understanding which products and customers are more or less profitable today and are potentially more valuable in the future. With this additional knowledge, the executives can determine which strategic objectives to focus on.
Note that the operational budget (#1) – those expenses required to continue with day-to-day repeatable processes – is calculated based on forecasted volume and mix of “drivers” of processes, such as the sales forecast, multiplied by planned consumption rates that are calibrated from past time periods (and ideally with rates reflecting planned productivity gains). This demand-driven method contrasts with the too-often primitive budgeting method of simply incrementally increasing the prior year's spending level by a few percentage points to allow for inflation, as was illustrated in Figure 13.2. The operational budget spending level is a dependent variable based on demand volume, so it should be calculated that way.
Regardless of whether an organization defines the strategic initiatives before or after setting the balanced scorecard's KPI targets, it is important to set aside strategy spending (#3) not much differently than budgeting for capital expenditures (#2). Too often, the strategy funding is not cleanly segregated anywhere in the budget or rolling financial forecasts. It is typically buried in an accounting ledger expense account. As a result, when financial performance inevitably falls short of expectations, it is the strategy projects' “seed money” that gets deferred or eliminated. The priority must be reversed. Organizations must protect strategy spending and allow it to go forward as it is to successfully accomplish the executive team's strategy.
The same goes for the risk mitigation expenses (#4). Enterprise risk management should be included in spending projections.
Note the question in the bottom right corner of Figure 13.11. Since the first pass at the “derived” budget or rolling forecast will likely be unacceptably too high and rejected by the executive team, the result is to adjust the plan. Hopefully, the project-based, strategy budget spending will be protected, similarly with the risk mitigation spending. Once the strategy and risk management spending are protected, the only other lever is to plan for productivity improvements in the cost consumption rates. This is where process-focused improvement programs like lean management and Six Sigma quality management are leveraged. It is in this way that focused cost reductions (or future cost avoidance) become part of the VBM framework.
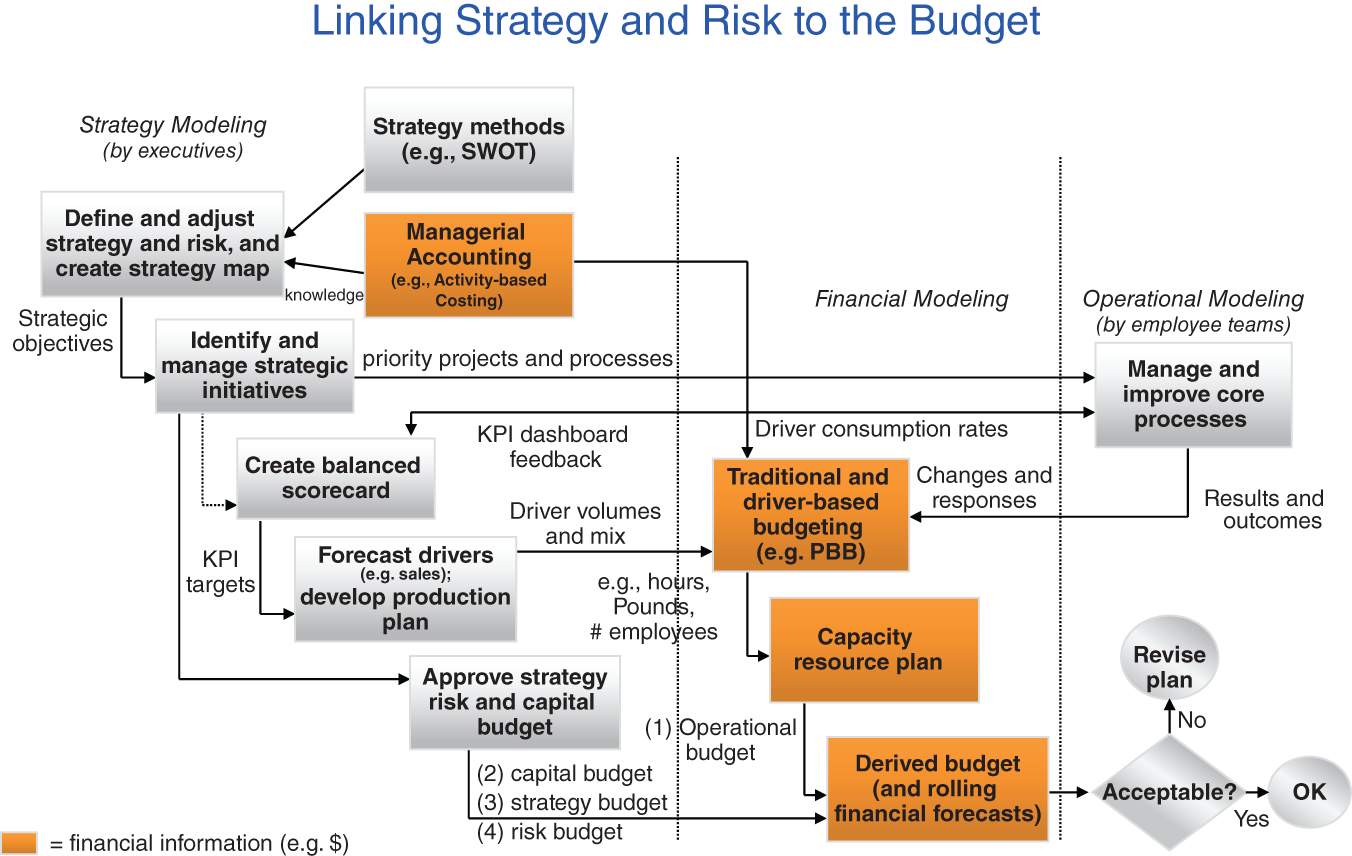
FIGURE 13.11 Linking strategy and risk to the budget.
Source: Copyright 2019 www.garycokins.com.
Put your money where your strategy is!
FROM A STATIC ANNUAL BUDGET TO ROLLING FINANCIAL FORECASTS
Most executive teams request frequent updates and revisions of the financial budget. These are referred to as rolling financial forecasts because the projection's planning horizon is usually well beyond the fiscal year-end date, such as out 18 months to 2 years. Imagine if you're a chief financial officer (CFO) or financial controller required to reprocess the budget as a rolling forecast quarterly (or even monthly). There are not enough cost center spreadsheets to do it! Only with computer automation that integrates several of the methods of the VBM framework, including good predictive analytics with forecasts of demand volume, can an organization produce valid derived rolling financial forecasts.
MANAGING STRATEGY IS LEARNABLE
Organizations with a formal strategy execution process dramatically outperform organizations without formal processes. Building a core competency in strategy execution creates a competitive advantage for commercial organizations and increases value for citizens and stakeholders of public sector government organizations. Managing strategy is learnable. It is important to include and protect planned spending for strategic and risk projects and initiatives in budgets and rolling financial forecasts. Those projects lead to long-term sustainable value creation.
This chapter has presented a dramatically new approach to resource planning and budgeting. The value added from this approach can be enormous in terms of the ability to secure adequate funding to deliver on performance targets, to manage resources, and to report to management. Even though the initial implementation effort is far from trivial, the payoffs in the medium- and long-term make it all worthwhile.
Chapter 14 will conclude the discussion on a practical way to implement a progressive management accounting system. It involves rapid prototyping with iterative remodeling to arrive at that permanent, reliable, and repeatable production system (referenced in Chapter 10) in just a few weeks, not months.
NOTES
- 1 www.bbrt.org.
- 2 The ideas in this chapter on activity-based resource planning (ABRP) are based on research from a professional society, the Activity Based Budgeting Project Team of the Consortium for Advanced Manufacturing International's (CAM-I) Cost Management Systems (CMS) group. More is at www.cam-i.org.