
CHAPTER TWELVE
Using ABC/M Attributes to Assess Quality and Value-Add
PUBLIC SECTOR ORGANIZATIONS NEED to distinguish among work activities that are:
- Not required at all and can be eliminated (e.g., a duplication of effort)
- Ineffectively accomplished and can be reduced or redesigned (e.g., due to outdated policies or procedures)
- Required to sustain the organization (i.e., work that is not directly caused by making products or delivering services but cannot easily be reduced or eliminated, such as building security
- Discretionary and can be eliminated (e.g., annual employee picnic)
- Directly related to core activities (i.e., making products or delivering services)
ABC/M systems provide for distinguishing these work activities either by incorporating them into a cost assignment structure (i.e., organizational sustaining cost objects) or by tagging their costs as an overlay (i.e., attributes). ABC/M attributes described in this chapter address the third question related to activity analysis.
ATTRIBUTES ENERGIZE ABC/M COST DATA
Organizations have very few insights about how their individual costs – for products, service recipients, or business processes – vary among themselves aside from the amount of the cost. Traditional cost accounting methods do not provide any way for individual costs to be tagged or highlighted with a separate dimension of cost other than the amount that was spent. An example of the range of one tag that can be scored against activities is “very important” versus “required” versus “postponable.” Tags are a popular way of measuring how much value-added is contained in the costs and where it is located.
In short, traditional accounting simply provides racked-and-stacked numbers. The problem is that, aside from the cost amount or bolding or italicizing the print font, one cannot differentiate one cost from another. This is true whether one is examining resource expenditures or their calculated costs of activities, processes, and final cost objects (i.e., workflow outputs, service lines, or service recipients). Attributes solve this money-level-only limitation of traditional costing. One can think of attributes as offering many other dimensions to segment costs that are different from absorption costing's single dimension, which only reflects variation and diversity consumption of cost objects such as outputs, products, service lines, and service recipients.
Attributes in no way affect the calculation of ABC/M costs. Attributes are user-defined, unlimited in number, and often subjectively assigned. Attributes can be used as a grading method to evaluate the individual activities that contribute to a process output's goods or services. ABC/M attributes allow managers to differentiate activities from one another even if they are equal in the amount of costs.
THE ANALYST'S DREAM
Some practitioners of ABC/M believe that it is the use of attributes that really brings power to ABC/M analysis. This implies that the attributes information may be more important than the traced and assigned cost data that are so fundamental to what ABC/M is doing – calculating the unique costs of work activities and their consuming outputs. In contrast to ABC/M's objective reporting of the facts, attributes take the ABC/M data an additional step by making the data very suggestive of what actions to take. Attributes have been referred to as the “air conditioning” for ABC/M.
With attributes one is no longer just tracing or adding up costs as an accounting exercise. They serve an alternative purpose: differentiating among the costs that reside within outputs, such as standard service lines and/or customers, or within business processes. The differentiating is based on something other than the amount of costs.
Monetary information alone about the cost amount of an output, product, or service line does not necessarily convey what to do or how to improve. Just knowing the amount of costs may not be sufficient to analyze the results and make judgments. You may want to know more about various types of cost, too; types and attributes are synonymous. Beyond relative magnitude, the activity monetary costs can be further differentiated into user-defined categories to facilitate managerial analysis. Without this additional differentiation, the activities will all look the same except for their description and dollar amount.
ABC/M attributes are frequently scored and graded against the work activities. The number of different attributes is unlimited, but many organizations settle in on their favorite half-dozen or so. Key examples include the level of importance and level of organizational performance.
A POPULAR ATTRIBUTE
Advanced, mature users are masters at employing ABC/M attributes. A popular attribute involves scoring activities along their “high versus low value-adding” scale. The idea is to eliminate low value-adding activities and optimize higher value-adding activities, thus enabling employees and managers to focus on the worth of their organization's work. Employees can see which work really serves customers and which activities may be considered wasteful. Focus and visibility are enhanced because people can more easily see where costs are big or small and also which costs can be changed or managed in the near term. Scoring costs with attributes invokes action beyond just gazing at and analyzing costs.
In the early days of ABC/M, the scoring choices for this specific attribute were limited to either “value-added (VA)” or “non–value-added (NVA).” This simple either/or choice created problems. First, it was a personal insult to employees to tell them that part or all of what they do is non–value-adding – employees are not very happy to hear that. But even more troublesome, the restrictive nature of this scoring method can lead to unresolvable debates. For example, take the activity “expedite orders” to prevent a tardy delivery of a service to an important service recipient. Is this value-added or non–value-added work? A solid argument can support either case. It is better to simply replace the VA versus NVA label with a different set of words that scale along a continuum and better describe levels of importance (e.g., critical, necessary, regulatory, or postponable).
Regardless of what type of scale you use to score or grade value, the objective is to determine the relevance of work or its output to meeting customer and shareholder requirements. The goal is to optimize those activities that add value and minimize or eliminate those that do not. Here are some tips, but by no means hard rules, for classifying value attributes.
High value-adding activities are those that:
- Are necessary to meet customer requirements
- Modify or enhance purchased material or product
- Induce the customer to pay more for the product or service
- Are critical steps in a business process
- Are performed to resolve or eliminate quality problems
- Are required to fulfill customer requests or expectations
- If time permitted, you would do more of
Low value-adding activities are those that:
- Can be eliminated without affecting the form, fit, or function of the product
- Begin with the prefix “re-” (such as rework or returned goods)
- Result in waste without commensurate value
- Are performed due to inefficiencies or errors in the process stream
- Are duplicated in another department or add unnecessary steps to the business process
- Produce an unnecessary or unwanted output
- If given the option, you would do less of
Another popular attribute scores how well each activity is performed, such as “exceeds,” “meets,” or “is below customer expectations.” This reveals the level of performance. Multiple activities can be simultaneously tagged with grades for two or more different attributes. As an option, activities can be summarized into the processes to which the activities belong. Using two different attributes along the process view allows organizations to see, for example, whether they are very, very good at things they have also judged to be very unimportant – and whether they are also spending a lot of money doing those unimportant tasks!

FIGURE 12.1 ABC/M's attributes can be suggestive of action.
Source: Copyright 2019 www.garycokins.com.
Note how suggestive attributes are. Figure 12.1 illustrates the four quadrants that result from combining the attributes for performance (vertical axis) and importance (horizontal axis). In the case just described as being good at something unimportant, it is obvious that the organization should scale back and spend less on that kind of work. These activity costs would be in the upper-left quadrant.
Although most attributes are subjectively scored or graded by managers and employees, when the scores are grouped together, the subjectivity begins to become directionally reliable (presuming there was no bias in the scoring of every single attribute). As a result, the attributed costs introduce an emotionally compelling force to consider taking actions, as in the example above.
Here are a few tips related to ABC/M attributes:
- Keep the definitions concise.
- Allow employees to develop the classifications – and, more importantly, to classify (or distribute) their own activities with the attributes.
- Be clear that attributes are tagged to activities – not to the people who perform the work.
- Constantly ask, “Can the high value-adding activities be done more quickly or at a lower cost?”
- Determine if low-value-adding activities can be eliminated or at least minimized.
Some analytical types of people are uncomfortable with any form of subjective grading and prefer rigorous rule-based methods to determine which attribute score is applicable. In this area, they can lighten up and just go with the flow. Yes, the scorings may come from some snap judgments of employees and other process participants. But the resulting view of the costs is just a starting point for asking more questions. Don't make the data collection effort too large an obstacle.
ABC/M REVEALS THE COST OF QUALITY (COQ)
Here is another way of thinking about this. When attributes are tagged to activities, each cost object will consume multiple grades of a select attribute. As a result, the cost objects will reflect different blends relative to each other. An analogy would be the different gallonage (cost amount) of different colored paint (an attribute's different score) being poured (activity driver) into an empty paint can (cost object). As each empty can is filled, the color shade of paint will be different, even if the cans are filled to comparable levels (same amount of cost).
In this way, attributes can reveal a different mix of value or performance. For example, there can be a major difference between two products with roughly the same unit cost. That is, one color of paint may cost $50.00 per gallon, with $15.00 of that total coming from a dozen activities scored as “below expectations” performance. Another color may also be $50.00 per gallon, but with only $5.00 of that total coming from two “below expectations” activities. Armed with this information, the product managers of these colors now have more insights to adjust their products' costs by adding or lowering services or price. In this way, the attributes are being used as in benchmarking to compare and contrast – and then to focus.
Attributes make ABC/M data come alive to some people. And when the attributed ABC/M data are exported into on-line analytical processing (OLAP) software and executive information system (EIS) tools, they can have a very stimulating impact on users.
QUANTIFYING THE MAGNITUDE OF THE COSTS OF QUALITY
Now comes the hard part. Regardless of what the intended purpose for the quality-related data will be and regardless of how precise or accurate the data need to be to meet that purpose, at some point in time you have to come to grips with quantifying the COQ. And that means collecting, validating, and reporting the data.
COST OF QUALITY CLASSIFICATION SCHEME
The quality management community uses attributes to calculate the cost of quality (COQ). Figure 12.2 illustrates the three popular COQ categories for grading work activities. Categories themselves can be branched into subcategories for more refined reporting.
Category 1 in this graphic means a good and stable process. Category 2 has quality-related costs because the process is not sufficiently stable to trust it, so you must inspect and test. Category 3 has quality-related costs because something is already defective or does not conform to specifications defined for or by the service recipient. With rigor like this, quality teams can pursue stronger improvement programs and shift their time and emphasis away from documentation and reporting to taking corrective actions.

FIGURE 12.2 Attribute can score and tag COQ costs.
Source: Copyright 2019 www.garycokins.com.
Multiple activities can be simultaneously tagged with these grades. And, of course, the money amount trails along, first at the work activity level and then traced into the cost objects or into the processes to which the activities belong. Attributes can also be directly tagged on resources as well as final cost objects, but tagging activities is the more popular.
HOW DO YOU CATEGORIZE DIFFERENT QUALITY COSTS?
To some, quality costs are very visible and obvious. To others, quality costs are understated. They believe that much of the quality-related costs are hidden and go unreported.
There are hidden financial costs beyond those associated with traditional, obvious quality costs. Examples of obvious quality-related costs are rework costs, excess scrap material costs, warranty costs, or field repair expenses. These are typically costs resulting from errors. Error-related costs are somewhat easily measured directly from the financial system. Spending amounts are recorded in the accountant's fund accounting or general ledger system using the “chart-of-accounts.” Sometimes the quality-related costs include the expenses of an entire department, such as an inspection department that arguably exists solely as being quality-related. However, as organizations flatten and de-layer and employees multitask more, it is rare that an entire department focuses exclusively on quality.
The hidden poor quality costs are less obvious and more difficult to measure. For example, a hidden cost would be those hours of a few employees' time sorting through paperwork resulting from a record-keeping or reporting error. Although these employees do not work in a quality department that is dedicated to quality-related activities, such as inspection or rework, that portion of their workday was definitely quality-related. These costs are not reflected in the chart-of-accounts of the accounting system. That is why they are referred to as being hidden costs.
Providing employee teams with visibility of both obvious and hidden quality-related costs can be valuable for performance improvement. Using the data, employees can gain insights into the causes of problems. The hidden and traditional costs can be broadly categorized as:
- Error-free costs: Costs unrelated to planning of, controlling of, correcting of, or improving of quality. These are the do-it-right-the-first-time (nicknamed “dirtfoot”) costs.
- Costs of quality (COQ): Costs that could disappear if all processes were error-free and if all products and services were defect-free. COQ can be subcategorized as:
- Costs of conformance: Costs related to prevention and predictive appraisal to meet requirements.
- Costs of nonconformance: Costs related to internal or external failure to meet requirements, including defective appraisal work. The distinction between internal and external is that internal failure costs are detected prior to the shipment or receipt of service by the service recipient or customer. In contrast, external failure costs usually result from discovery by the service recipient or customer.
An oversimplified definition of COQ is the costs associated with avoiding, finding, making, and repairing defects and errors (presuming that all defects and errors are detected). COQ represents the difference between the actual costs and what the reduced costs would be if there were no substandard service levels, failures, or defects.
Simple examples of these cost categories for a magazine or book publisher might be as follows:
- Error-free: “First time through” work without a flaw
- Prevention: Training courses for the proofreaders or preventive maintenance on the printing presses
- Appraisal: Proofreading
- Internal failure: Unplanned printing press downtime or corrections of typographical errors
- External failure: Rework resulting from a complaint by a service recipient or customer.
In principle, as the COQ expenses are reduced, they can be converted into budget surpluses or spent on higher value requirements.
“Attributes” can be tagged or scored into increasingly finer segments of the error-free and COQ subcategories. Attributes are tagged to individual activities for which the activities will have already have been costed using ABC/M. Hence, the subcategory costs can be reported with an audit trail back to which resources they came from. Each of the subattributes can be further subdivided with deeper “indented” classifications.
Since 100 percent of the resource costs can be assigned to activities, then 100 percent of the activities can be tagged with one of the COQ attributes – the activities have already been costed by ABC/M. The attribute groupings and summary roll-ups are automatically costed as well.
Life would be nice in an error-free world, and an organization's overall costs would be substantially lower relative to where they are today. However, they will always experience some level of error. This is human nature. The goal is to manage mistakes and their impact. COQ simply serves to communicate fact-based data – in terms of money – to enable focusing and prioritizing.
As previously mentioned, unless an entire department's existence is fully dedicated to one of the COQ subcategories or coincidentally an isolated chart-of-account expense account fully applies to a COQ category, then most of the COQ spending is hidden. That is, the financial system cannot report those costs.
A danger exists if only a fraction of the quality-related costs is measured and their amount is represented as the total quality costs – this is a significant understating of the actual costs. And, unfortunately, there are as many ways of hiding quality costs as there are people with imagination. Organizations that hide their complete COQ from themselves continue to risk deceiving themselves with an illusion that they have effective management. ABC/M is an obvious approach to make visible the missing COQ amount of spending.
DECOMPOSING COQ CATEGORIES
In effect, the technique for calculating a reasonably accurate COQ is to apply ABC/M and ABC/M's attribute capability. Figure 12.3 reveals a list of categories for work activities that are one additional level below the four major categories of COQ. Each of these subcategories can be tagged against the ABC/M costs. This provides far greater and more reliable visibility of COQ without the great effort required by traditional cost accounting methods.

FIGURE 12.3 Typical examples of cost of quality categories.
Source: Copyright 2019 www.garycokins.com.
COQ: BOTH GOOD AND POOR QUALITY
Some equate quality-related work activities only with problems and reactionary efforts by employees to fix things. But with COQ, additional quality-related work activities (e.g., inspection) that are not directly associated with poor quality are included as part of the broad COQ category. In short, one can think of COQ's costs of conformance work as good quality COQ and the costs of nonconformance as poor quality COQ. However, both good and poor COQ when combined are costs of quality that may not be incurred at all in a perfect world. In short, prevention and appraisal costs are worth measuring.
This broader picture of COQ provides much greater visibility and thereby ensures that the quality management projects and programs are efficiently run. That is, including the costs that are intended to prevent potential problems can ensure that there is not overspending too far beyond the spending required to satisfy the service recipient or customer. It is natural for organizations to be interested in failure-related costs. These usually attract the most attention. But prevention and appraisal costs are not that difficult to identify and report, and they should not be excluded from the visibility of managers.
When making decisions, the universally popular costs-versus-benefits test can be applied with COQ data. If either subcategory of COQ is excessive, it draws down profits for commercial companies or draws down resources in government agencies that could have been better deployed on higher value-added activities elsewhere.
GOALS AND USES FOR THE COQ INFORMATION
An organization should not invest its time in constructing a COQ measurement system if it is destined to be just another way for some employees to spin numbers. The bottom line message is: Don't start measuring COQ information if you won't use it!
In short, the uses of a COQ measurement system can include (1) favorably influencing employee attitudes toward quality management by quantifying the financial impact of changes, and (2) assisting in prioritizing improvement opportunities. The premise for even bothering to implement COQ is based on the following logic:
- For any failure, there is a root cause.
- Causes for failure are preventable.
- Prevention is cheaper than fixing problems after they occur.
If you accept the premise that it is always less expensive to do the job right the first time than to do it over, then the rationale for quality management and using COQ to give a quality program concrete and fact-based data should be apparent:
- Directly attack failure costs with the goal of driving them to zero.
- Spend time and money in the appropriate prevention activities, not fads, to effect improvements.
- Reduce appraisal costs according to results that are achieved.
- Continuously evaluate and redirect prevention efforts to gain further improvement.
Figure 12.4 illustrates the direction for which quality-related costs can be managed. Ideally, all four COQ cost categories should be reduced, but one may initially need to prudently increase the cost of prevention in order to dramatically decrease the costs of and reduced penalties paid for nonconformance. This makes COQ more than just an accounting scheme; it becomes a financial investment justification tool.

FIGURE 12.4 Driving cost of quality downward.
Source: Copyright 2019 www.garycokins.com.
A general set of corrective operating principles is that as failures are revealed – for example, via complaints from service recipients – the root causes should be eliminated with corrective actions. A general rule of thumb is that the nearer the failure is to the end-user, the more expensive it is to correct. The flipside is that it becomes less expensive, overall, to fix problems earlier in the business process. As failure costs are reduced, appraisal efforts can also be reduced in a rational manner.
Figure 12.5 illustrates the midway point of a fictitious manufacturer's COQ as nonconformance-related costs are displaced by conformance-related costs.
The figure illustrates a more desirable end goal for our fictitious manufacturer. Not only are nonconformance costs significantly reduced, but the level of prevention and inspection costs, which some classify as non–value added, are also reduced. The $20,000 of COQ has been reduced by $12,000, to $8,000. The reward for this good work has meant more requests for orders and higher sales without any changes in manpower. The error-free costs have risen by the same $12,000, from $80,000 to $92,000.
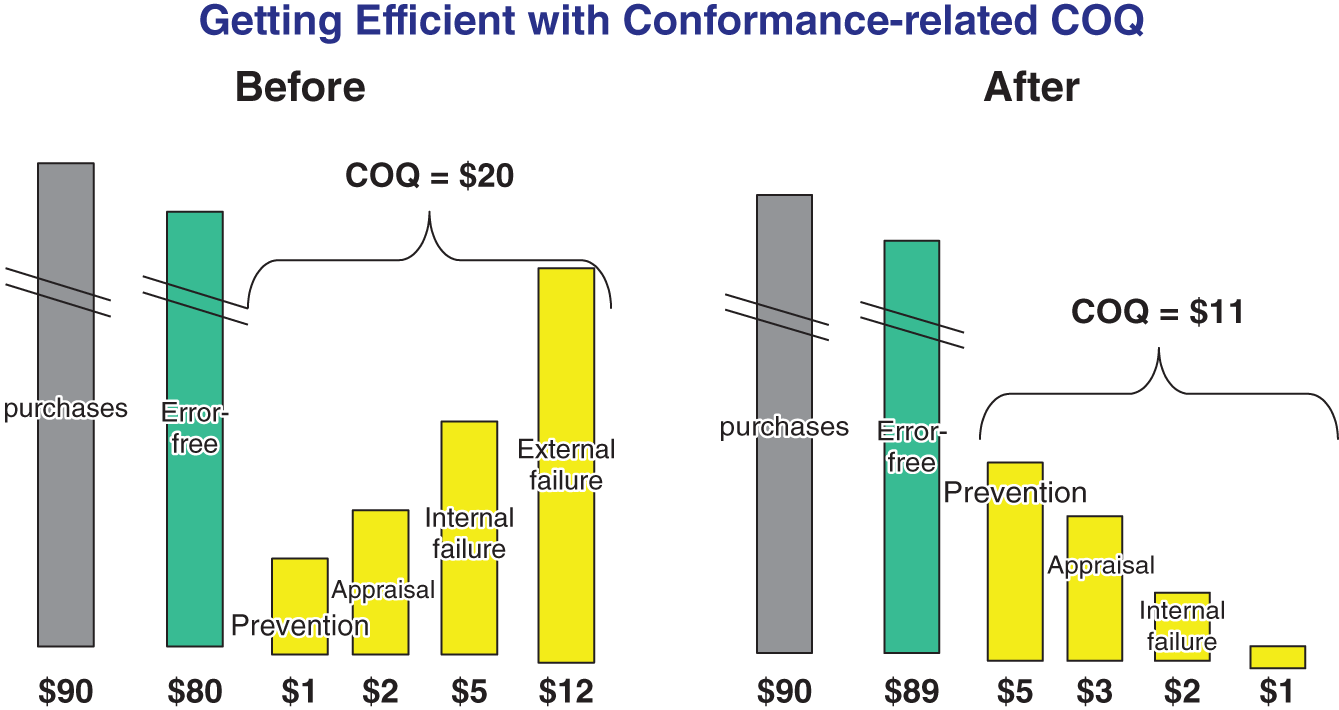
FIGURE 12.5 Getting efficient with conformance-related COQ.
Source: Copyright 2019 www.garycokins.com.
COQ MEASUREMENT SYSTEM
The more formal COQ measurement system provides continuous results. In contrast to a one-time assessment, it requires involvement by employees who participate in the business and administrative processes. More importantly, these employees need to be motivated to spend the energy and time, apart from their regular responsibilities, to submit and use the data.
Commercial ABC/M software products were designed for frequent repeated updating. For such a COQ system to be sustained longer-term, the system requires senior management's support and interest as well as genuinely perceived utility by users of the data to solve problems.
Continuous COQ measurement systems require a greater amount of effort, expertise, and maturity. Many organizations underestimate the maturity requirement. It is advisable that the organization gradually implement its system through a combination of: (1) measuring selected and local areas where relatively higher benefits are more likely to be realized, and (2) starting at more summarized levels of data before decomposing the levels of detail to the more granular work task level. The level of detail should only be relatively greater in the areas where there are anticipated opportunities. The levels of depth and detail can be raised or lowered as problems arise and recede following resolution.
Up to this point ABC/M has been applied to the past historical view of costs. In Chapter 13 we shift to the predictive view – the future is coming at an organization. This involves the planning, forecasting, budgeting, rolling financial forecasts, what-if scenario analysis, and other decision support needs from management accounting information.