
CHAPTER TEN
If ABC/M Is the Answer, What Is the Question?
ONE CAN ONLY REFER to “ABC/M” for so long before needing to visualize it and understand it as a cost-flow mechanism. Chapter 9 described what an ABC/M system looks like and how it calculates costs. In this chapter we address some of the questions that invariably loom large in the minds of organizational planners contemplating ABC/M application to their problem-solving. The chapter introduces some of the concepts and terms that are basic to understanding ABC/M as an accounting tool and, more importantly, as a management tool for encouraging behavioral change.
SO, WHAT IS THE BIG PROBLEM?
Why do some public sector managers shake their heads in disbelief when they think about their organization's cost accounting system? The authors once heard a public official complain, “You know what we think of our cost accounting system? It is a bunch of fictitious lies – but we all agree to them.” Of course, he was referring to the misallocated costs based on those broad averages violating costing's causality principle that result in flawed and misleading information. What a sad state it is when the users of the accounting data simply resign themselves to a lack of hope. And unfortunately, many of the accountants are comfortable if the numbers all foot-and-tie in total; they care less if the parts making up the total are correct. The total is all that matters to them, and any arbitrary cost allocation can tie out to the total expenses.
Imagine if you were a roving reporter and asked managers and employee teams throughout your organization, “How happy are you with the financial and accounting data that now support policy decisions aimed at improving effectiveness, efficiency, and performance?” Thumbs up or down? Many would give it thumbs down. When you have the wrong information coupled with the wrong measurements, it is not difficult to make wrong decisions.
How can traditional accounting that has been around for so many years all of a sudden be considered so bad? The answer is that the cost information is not necessarily bad so much as somewhat distorted, woefully incomplete, and partly unprocessed. Figure 10.1 provides the first hint of a problem. The left side shows the classic monthly responsibility cost center report that managers receive under the general ledger system. Note that the example used is a back-office department of a license bureau, such as for driver or hunting licenses. It is a factory, too, only its outputs are not tangible products but documents. This is to demonstrate that, despite misconceptions, indirect white-collar workers produce outputs the same as factory workers do. You can substitute any department, government or commercial, for the license bureau department in the example and the lessons will hold.
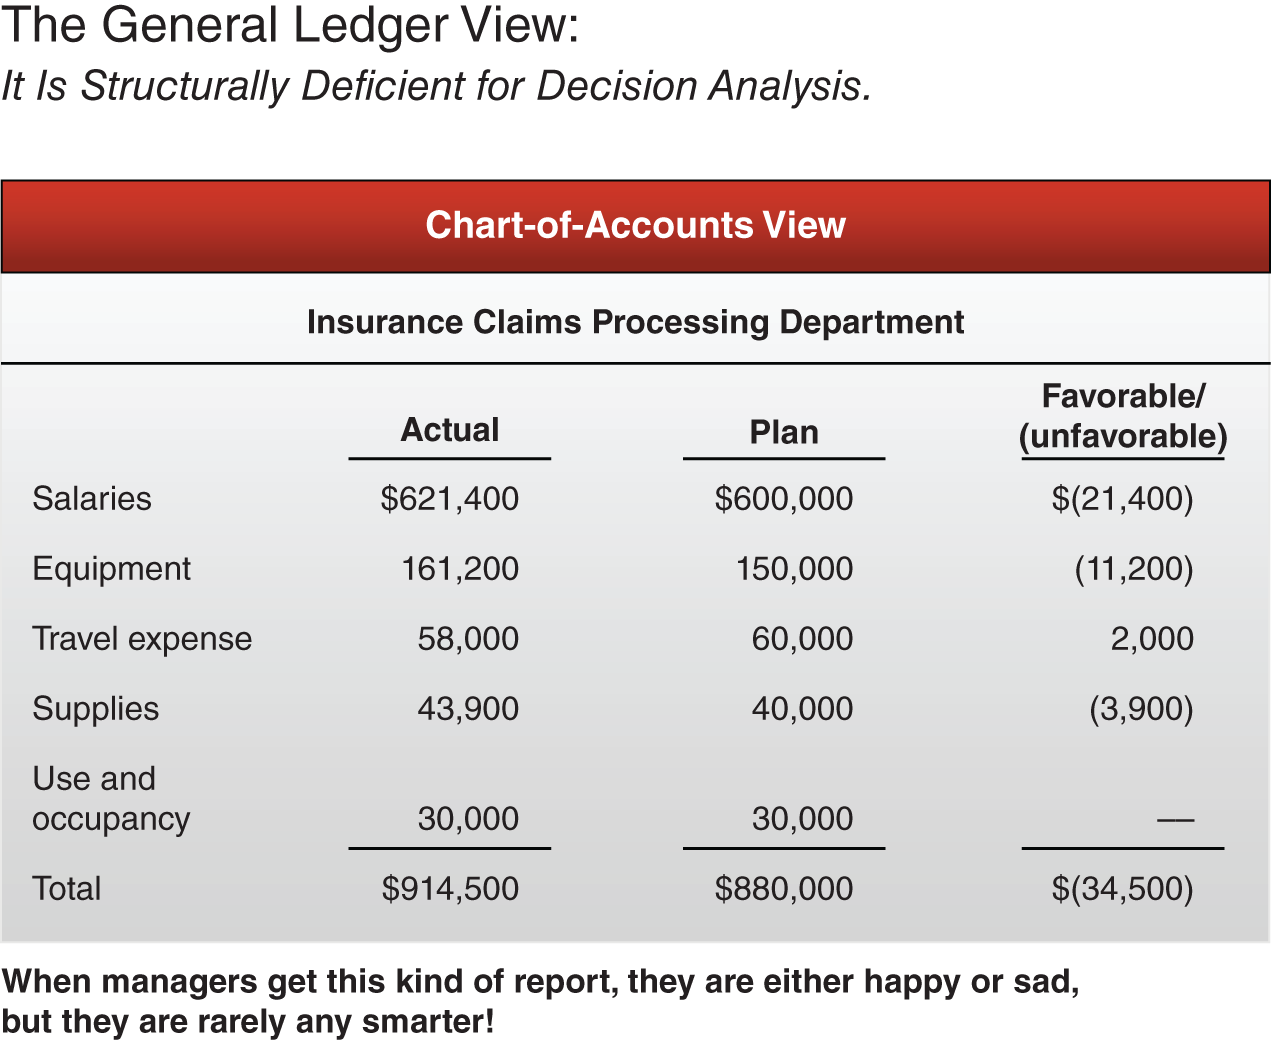
FIGURE 10.1 The general ledger view.
Source: Copyright 2019 www.garycokins.com.
If you question managers who routinely receive this report, “How much of these expenses can you control or influence? How much insight do you get from this report into the content of your employees' work?” they will likely answer both questions with a “Not much!” This is because salaries and fringe benefits usually make up the most sizable portion of controllable costs, and all that the manager sees are those expenses reported as lump-sum amounts.
When you translate those “chart-of-account” expenses shown under the general ledger or fund accounting system into the actual work activities that consume these expenses, a manager's insights begin to increase. The right side of Figure 10.2 is the ABC/M view that is used for analysis and as the starting point for calculating the costs both for processes and for diverse outputs. In effect, the right-side ABC/M view begins to resolve the deficiencies of traditional financial accounting by focusing on work activities. ABC/M is very work-centric, whereas general ledger and fund accounting systems are expenses transaction-centric.
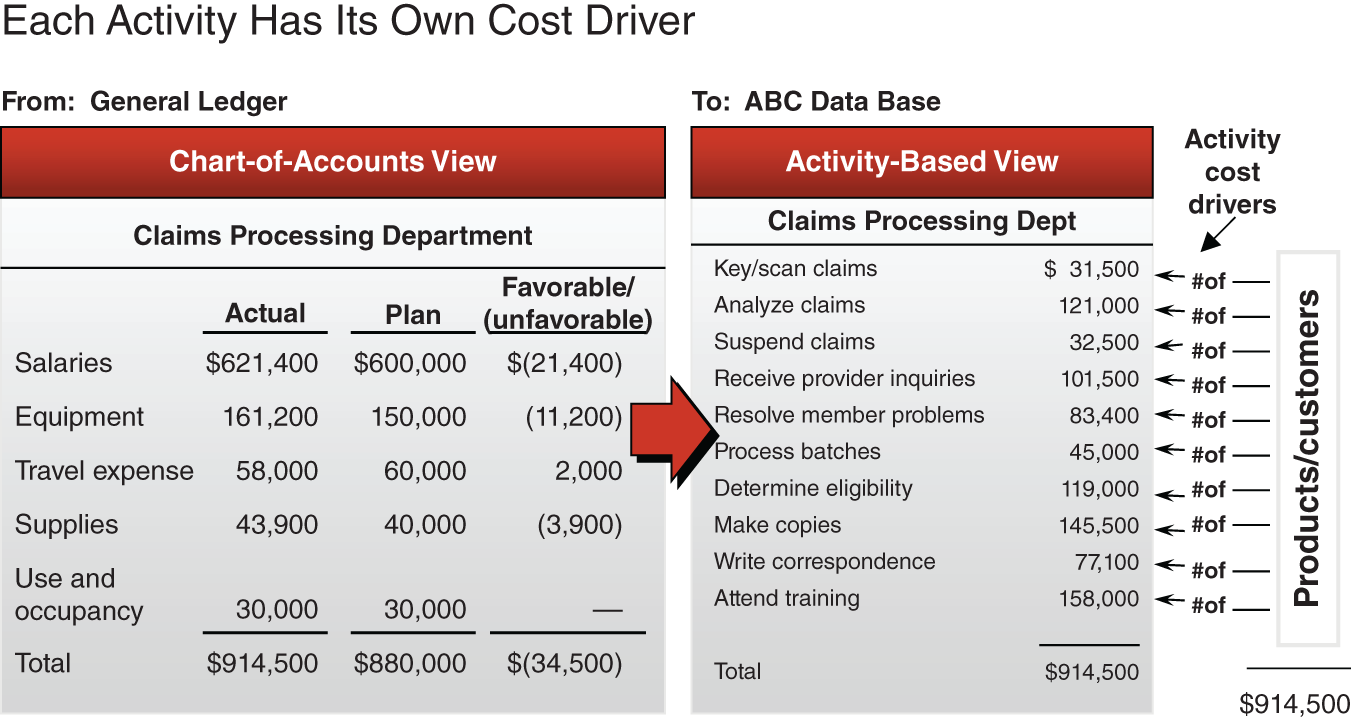
FIGURE 10.2 Each activity has its own cost driver.
Source: Copyright 2019 www.garycokins.com.
Another key difference lies in the language used to depict cost allocations (i.e., absorption costing). ABC/M describes activities using an “action verb-adjective-noun” grammar convention, such as “process building permit” or “open new taxpayer accounts.” This gives ABC/M its flexibility. Such wording is powerful because managers and employee teams can better relate to these phrases, and the wording implies that the work activities can be favorably affected through change, improvement, or elimination. General ledger and fund accounting systems use a chart-of-accounts, whereas ABC/M uses a chart-of-activities as its language. In translating the data from a general ledger or fund accounting system into the information of activities and processes, ABC/M preserves the total reported budget funding and costs but allows the individual elements to be viewed differently.
To be further critical of the left side chart-of-accounts view, notice how inadequate those data are in reporting the costs of processes that run cross-functionally and penetrate through the vertical boundaries of a government agency's organization chart. The general ledger and the fund accounting system are organized around separate departments or cost centers. This presents a reporting problem. For example, with a city's department of public works, what is the true total cost for processing equipment repair requisitions that travel through so many hands? For a service organization, what is the true cost of opening a new account for a citizen or service recipient?
Many organizations have flattened and de-layered such that employees from different departments or cost centers frequently perform similar activities and multitask in two or more core workflow processes. Only by reassembling and aligning the work-activity costs across the workflow processes, like “process home buyer permits” or “open new taxpayer accounts,” can the end-to-end process costs be seen, measured, and eventually managed.
The structure of the general ledger and fund accounting system is restricted by cost-center mapping to the hierarchical organization chart. As a consequence, this type of reported information drives vertical and hierarchical behavior, not the much more desirable end-to-end process behavior. In effect, with traditional accounting systems, public sector managers are denied visibility of the costs that belong to their end-to-end workflow processes – and what is driving those costs.
In summary, the general-ledger and fund-accounting view describes “what was spent,” whereas the activity-based view describes “what it was spent for, to whom, and why.”
HOW DO COST DRIVERS WORK?
Much additional information can be gleaned from the right-side view of Figure 10.2. Look at the second activity, “analyze licenses,” at a total cost of $121,000 and ask yourself what would make that cost significantly increase or decrease. The overall answer is the number of licenses analyzed. That is that work's activity driver. Figure 10.2 illustrates that each activity on a stand-alone basis has its own activity driver. At this stage, the costing is no longer recognizing the organization chart and its artificial boundaries. All the employees' costs have been combined into the work performed. The focus is now on the cost of that work and on what influences and affects the level of that workload.
There is yet more that can be gained from this view. Let's assume that 1,000 licenses were analyzed during that period for the department shown. Then the unit cost per each analyzed license is $121 per license. If one specific group – senior citizens over the age of 60, for example – was responsible for half those claims, then we would know more about the sources of demand (i.e., workload). The senior citizens would have caused $60,500 of that work (500 claims multiplied by $121 per claim). If married couples with small children required another fraction, married couples with grown children a different fraction, and so on, then ABC/M will have traced all of the $121,000. If each of the other work activities were similarly traced, using the unique activity driver for each activity, ABC/M will have piled up the entire $914,500 into each group of beneficiaries. This reassignment of the resource expenses will be much more accurate than any broad-brush “butter spreading” cost allocation applied with traditional accounting systems that use broad averages.
This cost assignment network is one of the major reasons that ABC/M calculates costs of outputs more accurately. The assignment of the resource expenses also demonstrates that all costs actually originate with the ultimate end user, service recipient, or beneficiary of the work. That location and origin of costs could be a citizen, welfare recipient, new home buyer seeking permits, or another government agency relying on those services. This is at the opposite end from where people who perform “cost allocations” think about costs. They think it begins with the expenses.
Traditional cost allocations are structured as a one-source-to-many-destinations redistribution of costs. They ignore that the destinations are actually the origin for the costs. The destinations, usually outputs or people, place demands on work, and the work draws on the resource capacity (i.e., the spending); hence the costs measure the effect by reflecting backward through the ABC/M cost assignment network. In sum, accountants have historically allocated “what we spend” from the general ledger, whereas ABC/M assigns “what it costs.”
WHAT ARE COSTS?
Although the two cost views – the cost assignment and the process view – seem logical, people who design or use ABC/M systems often have difficulties deploying the power of these two views. In practice, they often confuse the two.
Part of the problem in defining and designing costing systems involves understanding just what exactly costs are. What are costs, anyway? Costs themselves are abstract and intangible. We cannot see costs or hold a couple of them in our hands. Yet we all know they are there. Like an echo, we know they exist whether we measure them or not.
We know that costs increase or decrease as changes in the workload affect the activity costs via changes in the quantity or frequency of their cost drivers. Work activities are triggered by events, and the costs react as the effect. In one sense, since costs are not tangible, ABC/M operates as “an imaging system” similar to radar, sonar, or an electrocardiogram. Like a digital camera, ABC/M records the image.
As just stated, costs measure effects. And costs measure effects more than they illuminate root causes. However, ABC/M systems can provide an enterprise-wide image of all the collective effects plus the causal relationships that result in an organization's costs. So, costs give insights to root causes, but mainly through their inferences. This may sound ironic, but “cost management” can be considered an oxymoron (such as “jumbo shrimp” and “hospital food”) – a contradictory phrase. You do not really manage costs; you understand the causes (and drivers) of costs. Then you manage the causes.
So, in effect, an organization does not manage its costs; it manages: (1) what causes those costs to occur (i.e., its cost drivers), and (2) the effectiveness and efficiency of the organization's people and equipment in responding to those causal triggers.
It is sort of amazing that, when one designs a cost measurement system, the resulting information is actually measuring something intangible and invisible! But in its own way, ABC/M makes tangible the data to represent things that most people believe are intangible.
To sum up, in one sense, the report on the left side of Figure 10.2 represents more of an “accounting police” or “budget police” command-and-control tool. This is the most primitive form of control. Have you overspent your budgeted target? If you have, who says that budgeted target amount was fair when it was initially imposed? As previously mentioned, when managers receive the left-side cost center report, they are either happy or sad but rarely any smarter. That is unacceptable in today's world, which expects much more out of organizations than in the past. We will all witness the emergence of the “learning organizations,” not ones that are straightjacketed with spending restrictions. The right side of our graphics in the Figure 10.2 restates the same expenses as on the left side, but the costs are reported in a much more useful format and structure for decision support.
When expenses are expressed as activity costs, they are in a format to be traced into outputs. Expenses are transformed into calculated costs. As a result, employees can never say, “We couldn't care less about what anything costs.” People care more when they know what things cost and believe in the accuracy of those costs. Cost accounting is outside their comfort zones. ABC/M makes “cost” understandable and logical.
HOW DOES ABC/M INTERSECT WITH TRADITIONAL COST ACCOUNTING?
Figure 10.3 uses the analogy of an optical lens to show how ABC/M serves as a translator of general ledger and fund accounting system data to provide more focused information for improved decision support. The lens not only translates the ledger expenses into a more useful and flexible format but provides more sensory information. The information from the ABC/M lens can serve as an early warning detector that some resource level of spending may be out of alignment, perhaps with the goal or strategy of the organization or with the needs of its customers. For quality managers, ABC/M makes visible all the work related to the cost of quality (COQ) – for example, where quality-related costs are located and which outputs and products the COQ costs have gone into.
As shown in Figure 10.3, ABC/M is not a replacement for the traditional general ledger and fund accounting system. Rather, it is a translator or overlay that lies between the traditional expense account accumulators and the end users. Examples of end users include the government agency's own managers and employee teams who apply cost information in decision making, as well as governing authorities or oversight committees who may evaluate how to better redeploy spending budgets.

FIGURE 10.3 ABC/M doesn't replace the accounting system.
Source: Copyright 2019 www.garycokins.com.
ABC/M translates expenses into a language that people can understand: into elements of costs, namely the work activities, which can be more flexibly linked or assigned to processes or cost objects based on demand-driven consumption patterns. It is not a simplistic and arbitrary system of broad average cost allocations.
The reason ABC/M is becoming popular in government and public sector organizations is that general ledger and fund accounting systems are now recognized as being structurally deficient. The data from those systems are not in a format that will provide good managerial information for decision support. Traditional accounting is a sound mechanism for collecting and accumulating transaction-intensive expenses, but not for converting those into costs for useful decision-making support.
In the simplest terms, the general ledger or fund accounting system acts like a checkbook. One can read the amount of money spent but not really know the what-for's and why's of any individual “check.” And, unfortunately, the spending ledger's largest “check” amounts are employee payroll-related, which gives managers virtually no visibility into the content of the employee work activities being performed. Further, the payroll-related costs do not reveal the interrelationships of that work with other work or with products and service lines for service recipients or beneficiaries. Moreover, there are no insights into what events cause or drive variations in work activity costs. Since an organization's work activities probably represent the costs most subject to management control, it is critical to know and to understand them.
An ABC/M system does not replace the accounting system. It restates the same data and adds operating relationships to support decision-making more effectively. In contrast to traditional accounting, ABC/M focuses on the work activities associated with operating and managing any institution, including those in the not-for-profit or government sector. As noted, ABC/M is work-centric, whereas the general ledger or fund accounting system is expenses transaction-centric. Both have their place and purpose, but the data provided by traditional accounting are too raw to be considered business intelligence for decision support. ABC/M solves that problem and does much more. Just translating the ledger account expenses into their work activities is an incomplete view of ABC/M. The total picture includes ABC/M's linkage of these activities into networks to calculate the cost of outputs useful for performing analysis, for determining tradeoffs, and for making decisions.
The modern movement toward “managing with a process view” has created a growing need for better managerial and costing information. Managing processes and managing activities (i.e., costs) go together. By current definition, a workflow process comprises two or more logically related work activities intended to serve end-receivers and beneficiaries; thus, a means of integrating processes, outputs, and measured costs has become an even more important requirement for managers and employee teams. ABC/M information provides a logical way to visualize and report on these linkages.
In sum, ABC/M resolves the structural problem of data inherent in the general ledger and the fund accounting system by first converting account balances into activity costs. ABC/M then assigns the activity costs to cost objects or reassembles the activity costs across processes. These new and transformed cost data can be used to identify operating relationships that are key to making good decisions affecting products, service lines, and customers.
WHY THE INCREASED INTEREST IN ABC/M?
In the early 1980s, many organizations began to realize that their traditional accounting systems were generating inaccurate or incomplete costing information. The typical organization's cost structure had been changing substantially as overhead and indirect costs increased and displaced direct labor and material costs. As alluded to earlier, the three primary causes for this shift were: (1) increasing organizational complexity resulting from proliferation in the variety of product and service-line offerings, (2) a more diverse group of delivery channels and service recipients, and (3) increased automation, new technologies, and new methodologies.
In the past, the system of calculating costs by using simplistic volume-based cost allocations may have been acceptable and may not have introduced excessive error. The rapid rise in indirect and overhead expenses changed all that. The traditional costing method became increasingly invalid because of its failure to tie actual consumption costs to the broadening array of products and standard service lines. The unfavorable impact of these costing distortions was becoming much more intense than in the past.
Some managers understood intuitively that their outdated accounting system was distorting product and service line costs, so they sometimes made informal adjustments to compensate. Some created their own “shadow” cost reporting separate from the accounting department's reports. However, with so much complexity and diversity, it was nearly impossible for managers to predict the magnitude of adjustments needed to achieve reasonable accuracy. ABC/M was seen as the way to resolve the problem of poor indirect and overhead cost allocations and to provide additional information that would serve as a basis for positive actions, both strategic and operational.
The rise in ABC/M is also the result of external factors. The level of performance and service that is expected of most organizations has increased dramatically. In the past, many organizations were reasonably comfortable with making mistakes. There was adequate time or resources to mask the impact of any wrong or poor decisions. In many cases, there simply was no accountability with consequences. Errors and poor service were more easily tolerated.
Today the pressure has intensified, and the margin for error is slimmer. Governments and not-for-profit organizations cannot make as many mistakes or use excess capacity and expect that they will not be noticed. Cost estimates for new projects, capital investment decisions, technology choices, outsourcing, and make-versus-buy decisions today all require a sharper pencil. More private sector organizations are behaving like predatory competitors. These companies are becoming strong rivals to government institutions by better understanding the cause-and-effect connections that drive costs and by fine-tuning their processes and competitive bid prices accordingly.
The resulting squeeze from the existence of more and possibly better options for service recipients is making life for some government organizations much more difficult than in the past. Budget tightening has worsened the problem. Knowing what products, service lines, and service recipients truly cost is becoming key to survival. With ABC/M visibility, organizations can understand what drives their costs and identify where to remove waste, low-value-adding costs, and unused capacity. These topics will be discussed in Chapter 12.
Today an organization's road is no longer long and straight; it is winding, with bends and hills that do not give much visibility or certainty to plan for the future. Organizations need to be agile and continuously transform their cost structure and work activities. This is difficult to do if they do not understand their own cost structure and economics.
HOW DOES ABC/M YIELD MORE ACCURACY?
As previously described, ABC/M was developed as a practical solution for problems associated with traditional cost management systems. In traditional cost accounting, the indirect expenses are usually too aggregated to serve any purpose, thus ruining any likelihood of an accurate calculation of cost by type of output.
Moreover, these overhead cost allocations are generally determined by applying broad-brush average cost rates to a volume-based factor, such as the number of employee labor hours or department expenses. Overall, this system may reflect inputs used or outputs produced but will not accurately measure the segments. This flawed basis for allocating costs rarely reflects the specific cause-and-effect relationship between the indirect overhead expense and the product, service line, channel, or service recipient (i.e., the cost object) that is actually consuming the cost. Many managers are tired of the “allocation food fights.”
Because allocating is a zero-sum error game, the result of inaccurate cost allocations is that some cost objects get overcosted while the remainder must be undercosted. In practice, the undercosting of some cost objects can be substantial. That is because these service lines, service recipients, or perhaps even other government agencies require far more technical attention or consume more employee time than the broad-brush averages applied. Some people refer to traditional cost allocations as spreaders. In effect, we have allowed the accounting profession to construct a costing scheme that distorts reality and violates costing's causality principle as a manager understands it.
ABC/M corrects for these flaws by identifying the work activities that are responsible for costs. It builds a cost-flow assignment network, which allows the work activity costs to be continuously reassigned or passed on only if the products, service lines, or service recipients, or in some cases other work activities, actually use and consume the activity. Remember the restaurant example? Figure 10.4 shows a diagram popularly called the ABC/M cross, which is critical to understanding this concept.
Costs represent the belief system of the organization. Many employees accept the reported costs as true strictly because the accountants report them. Other employees are suspicious. An allocation-free cost system is like a smoke-free environment: no pollution. In short, don't allocate – prorate. ABC/M brings in the “myth grenades” that blow up the old flawed beliefs and replace them with real facts.
The ABC/M cross reveals that work activities, which are located in the center intersection of the cross, are integral to calculating and reporting both the costs of workflow processes and the costs of cost objects. Cost objects are the persons or things that benefit from incurring activity costs; examples are products, service lines, internal or external recipients (e.g., citizens and customers), stakeholders, and outputs of internal processes. Cost objects can be thought of as for what and for whom work is done.
Figure 10.4 lists the questions that the vertical cost-assignment view answers. The vertical cost-assignment view explains what specific things cost, whereas the horizontal process view explains what causes costs to exist and to fluctuate.
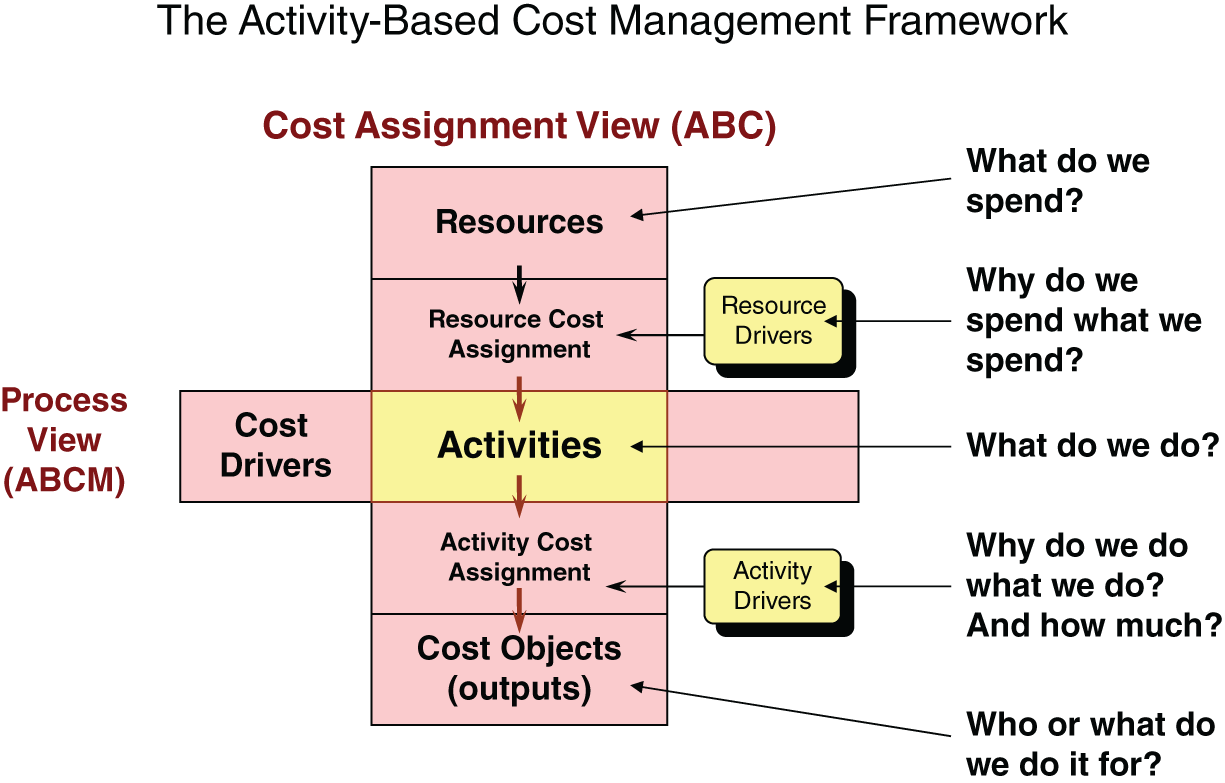
FIGURE 10.4 The activity-based cost management framework.
Source: © 2019 The Consortium of Advanced Manufacturing International (CAM-I). All Rights Reserved; used with permission.
The vertical axis reflects costs and their sensitivity to demands from all forms of product and service-recipient diversity. The work activities consume the resources, and the products and services for the end users, citizens, and beneficiaries consume the work activities. The vertical ABC/M cost-assignment view is a cost-consumption chain. After each cost is traced based on its unique quantity or proportion of its driver, then all of the costs are eventually reaggregated into the final cost objects.
The horizontal view of the ABC/M cross is the workflow-process view. A workflow process is defined as two or more activities or a network of activities with a common purpose. Activity costs belong to the workflow processes. Across each process, the activity costs are sequential and cumulatively additive. In this orientation, activity costs satisfy the requirements for popular flowcharting and process-modeling techniques and software. Process-based thinking, tipping the organization chart 90 degrees and flowing across the organizational chart “boxes,” now dominates managerial thinking. ABC/M provides the cost elements for process costing that are not available from the general ledger and the fund accounting system.
Figure 10.5 illustrates the mechanism of the vertical axis of the ABC/M cross. It reveals that an activity cost has an output cost rate that is synonymous with the activity driver rate.
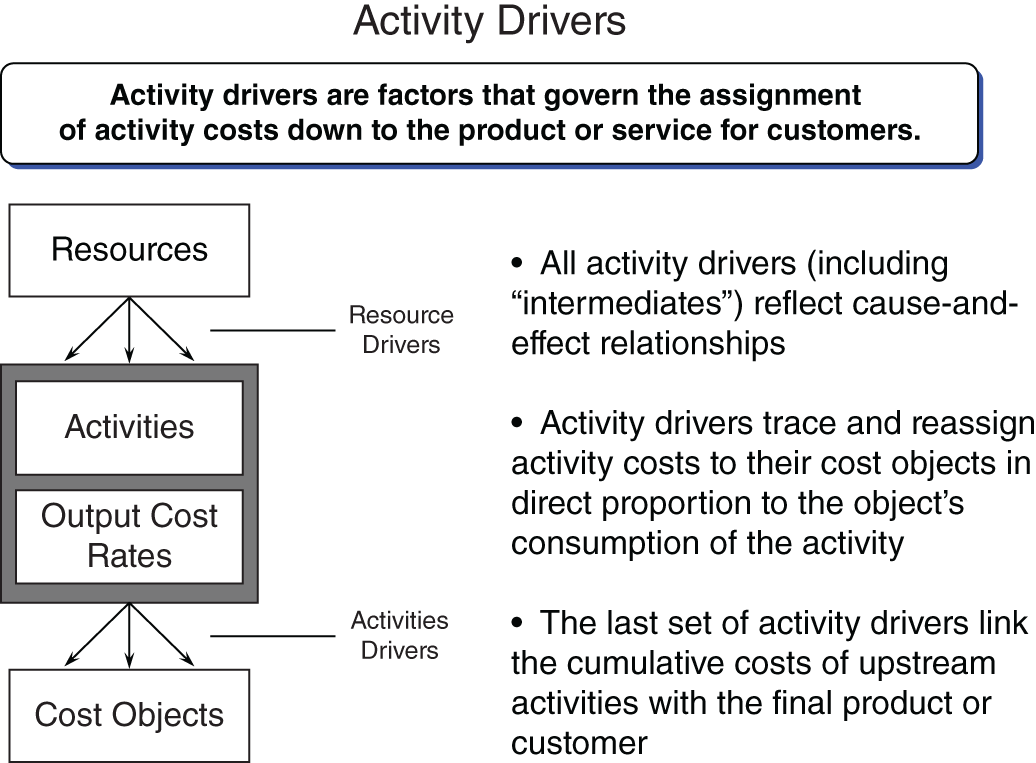
FIGURE 10.5 Activity drivers.
Source: Copyright 2019 www.garycokins.com.
WHAT ARE DRIVERS?
Other than “activity,” there probably is no term that has become more identified with activity-based cost management than the term “driver” and its several variations. The problem is that it has been applied in several ways with varying meanings. To be very clear, a cost driver is something that can be described in words but not necessarily in numbers. For example, a storm would be a cost driver that results in much cleanup work, which in turn has related costs. In contrast, the activity drivers in ABC/M's cost assignments must be quantitative, using measures that apportion expenses into costs. In the ABC/M vertical cost-assignment view, there are three types of drivers, and all are required to be quantitative:
- Resource drivers trace expenditures (cash or fund outlays) to work activities
- Activity drivers trace activity costs to cost objects
- Cost object drivers trace final cost object costs into other final cost objects.
In the ABC/M cross's vertical cost-assignment view, activity drivers will have their own higher-order cost drivers. Events or other influences, which are formally called cost drivers, cause work activities. Think of a cost driver as a work order that triggers the work activity, which in turn uses resources to produce outputs or results. Activity costs are additive along the process and therefore can be accumulated along the business and value chain process.
Cost drivers and activity drivers thus serve different purposes. Activity drivers are output measures that reflect the usage of each work activity, and they must be quantitatively measurable. An activity driver, which relates a work activity to cost objects, “meters-out” the work activity based on the unique diversity and variation of the cost objects that are consuming the activity. It is often difficult to understand whether use of the term “activity driver” is related to a causal effect (input driver, such as “number of labor hours worked”) or to the output produced by an activity (output driver, such as “number of licenses processed” or “number of meals prepared”). In many cases, this is not a critical issue so long as the activity driver traces the relative proportion of the activity cost to its cost objects.
Figure 10.6 illustrates how activity drivers are lower-order drivers of cost drivers. ABC/M relies on activity drivers for tracing costs. Collectively they are useful when combined with total quality management (TQM) problem-solving tools for identifying root causes.
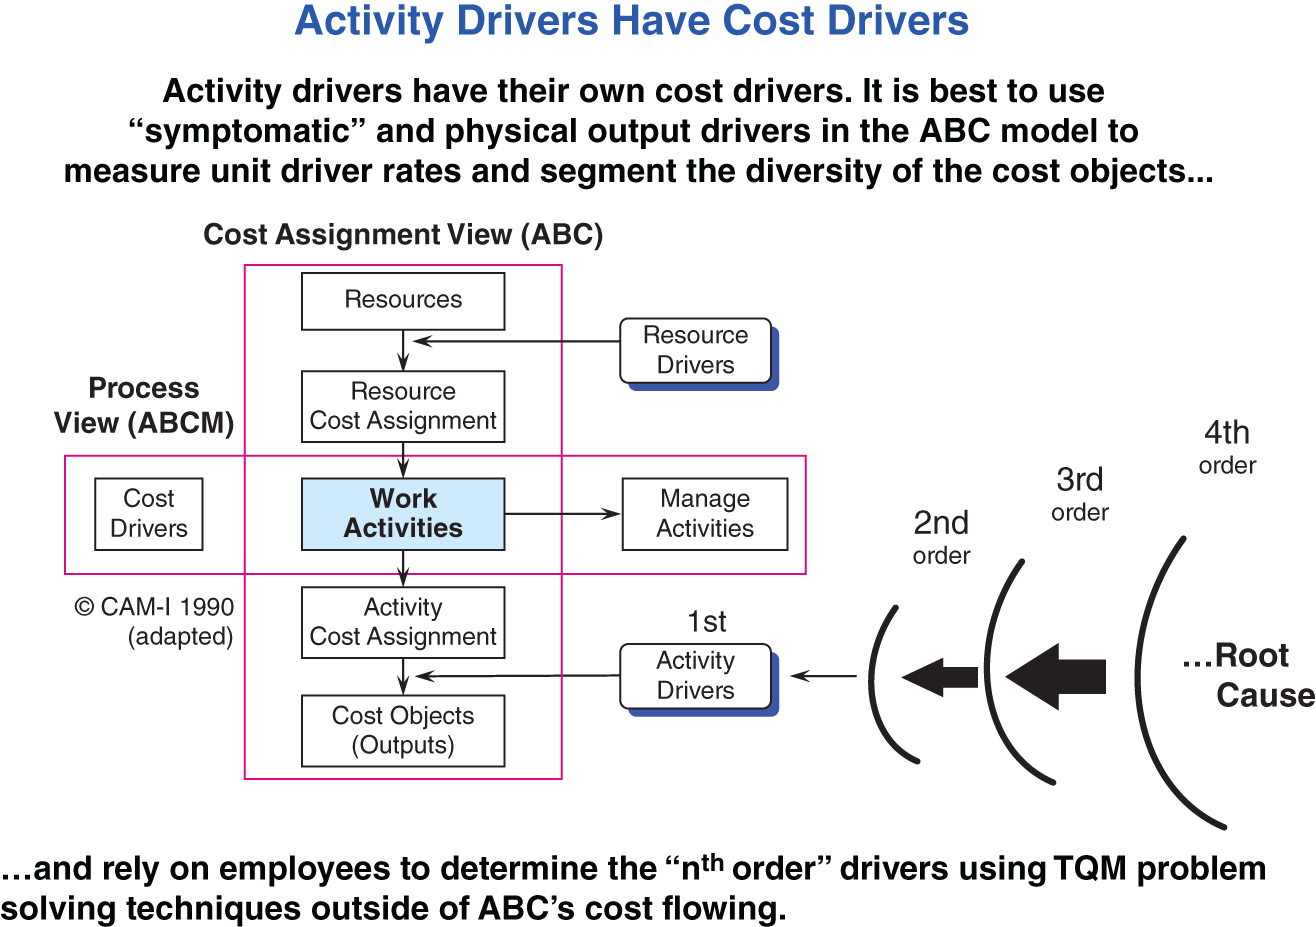
FIGURE 10.6 Activity drivers have cost drivers.
Source: Copyright 2019 www.garycokins.com.
Driver data, whether it is cost-driver or activity-driver information, sparks root cause analysis. Generally, the activity drivers used for ABC/M costing are output-based. Therefore, as the quantitative measures of the drivers rise or fall over time, ABC/M can report the historical trend in terms of per-unit cost of work rates for the activity outputs and ultimately for the products as a whole. Alternatively, it can also provide the per-unit cost of each output rates for use in predictive planning and what-if scenarios, which are popular uses of the ABC/M information.
Cost estimating with ABC/M is very natural because the activity costs react and behave linearly with changes in their activity drivers. Too often with traditional costing, the cost rates do not directly vary with changes in volume; this fault then results in misestimates and ultimately in errors resulting in poor decisions.
As mentioned, in the vertical cost-assignment view, the term “driver” is prefix-appended in three areas. The first – called a resource driver – deals with the method of assigning resource costs to activities. The second – an activity driver – deals with the method of assigning activity costs to cost objects. The third – a cost object driver – applies to final cost objects after all activity costs have already been logically assigned. Note that cost objects can be consumed or used by other cost objects.
In this context, references to old 1990s language of “first-stage” and “second-stage” drivers are being abandoned as being obsolete. Their use today would give a misleading impression that ABC/M can be easily accomplished as a simplistic two-step allocation. ABC/M practitioners have come to recognize that ABC/M is a multistage cost assignment scheme (which will be discussed in Chapter 11). By limiting the use of the word “driver” to four clearly defined areas – cost driver plus the three just mentioned as appearing on the vertical axis – this will hopefully prevent misinterpretation or misuse of the term.
Regardless of how management decides to achieve improvements, the main message here is that work is central to ABC/M. The effort will provide useful inputs to the decision-making process. ABC/M will answer these important questions: What do we do? How much do we do it? For whom do we do it? How important is it? Are we very good at doing it?
WHY IS MINIMIZING THE SIZE OF THE ABC/M SYSTEM IMPORTANT?
In practice, ABC/M systems will sometimes trace work activity costs to two or more other intermediate work activities that consume the work upstream from the ultimate products and services that initially trigger the demands on work. The reassignment network of cost-segmented consumption is key to ABC/M's superior costing accuracy. ABC/M can tolerate reasonable cost-driver estimates as proxies for actual-transaction detail drivers because the error does not compound – it dampens out on its way to the final cost objects. Although counterintuitive, with ABC/M, precision inputs are not synonymous with accurate outputs. This property significantly lightens the workload for data collection. And this is why the mantra of ABC/M is: “It is better to be approximately correct than precisely inaccurate!”
Figure 10.7 illustrates the impact of the error-dampening property. The figure shows several asymptotic curves that all have the same destination: 100 percent perfectly accurate cost results. The vertical axis represents the accuracy level while the horizontal axis represents the “level of effort.” For each incremental level of administrative effort to collect, validate, calculate, and report more and better data, there is proportionately less improvement in accuracy. So the phrase “Is the climb worth the view?” is truly applicable to ABC/M.

FIGURE 10.7 Balancing levels of accuracy with effort.
Source: Copyright 2019 www.garycokins.com.
This graphic also draws attention to efficient and inefficient performance levels exhibited by ABC/M project teams in finding the right combination of accuracy and ABC/M administrative effort. There will always be a balanced tradeoff of more data for higher accuracy. But the appropriate questions being raised here are “Which data? And what is the effort to collect those particular data?”
Poorly designed ABC/M systems will yield less accuracy despite greater effort. Even the best-designed systems will yield less increase in accuracy per unit of effort expended as the size of the collection effort increases.
With better design, ABC/M Project Team A is achieving higher accuracy with much less collection effort relative to ABC/M Project Team B.
Unfortunately, most ABC/M project teams perform too far to the right on Figure 10.7 and usually on a much lower “frontier curve.” That is, they have put in much greater effort than was needed, and they received less accuracy in costing than they could have achieved if they had been cleverer in two areas of developing their ABC/M model. First, they need to select beforehand what data are most important to collect. Second – and more important – they need to design a good cost assignment structure. The challenge for today's ABC/M teams is to determine how to right-size their ABC/M model – and to right-size it appropriately. Few organizations can afford excesses. In the end, the level of accuracy and detail needed depends on what types of decisions are going to be based on the cost information. And usually the accuracy requirements are not unreasonably harsh.
ABC/M's property of error-dampening means that an ABC/M model does not need to be very detailed and granular and, consequently, very large in size. Unfortunately, because this is counterintuitive, many ABC/M systems are over-engineered in size. They go well beyond diminishing returns in extra accuracy for incremental levels of effort of work. I refer to this as “ABC/M's leveling problem.”
What level of detail and precision do you need? Chapter 14 will describe the ABC/M rapid prototyping with iterative remodeling design implementation approach previously mentioned. This approach takes advantage of this thinking to maximize the value of the reported cost information with the minimum effort to create the information.
No one knows in advance how detailed and granular to build the first ABC/M model. The project team, often led by accountants, errs on the side of excess detail. As a result, some ABC/M projects are exposed to a risk of being abandoned because they collapse under their own weight as the system becomes unnecessarily difficult to maintain long before the users comprehend how they can apply the ABC/M information usefully. ABC/M is a solution, but a solution to a problem should not become the next problem. ABC/M rapid prototyping with iterative remodeling accelerates the learning of the properties of ABC/M model design and architecture.
Some of the lessons learned about ABC/M and analysis are:
- Information, even though not precise, can provide an organization with substantially improved support for decision-making and can greatly improve its understanding of cost behavior.
- An organization does not need “excellent” ABC/M analysis to make great improvements.
- No system providing ABC/M information and its analysis is perfect. Good judgment and additional qualitative information are necessary before final decisions are made.
- Excess ABC/M model structure – such as number of activities and drivers – saps the strength of ABC/M in the initial stages.
A simple rule that will be repeated in this book is to constantly ask, “Is the higher climb worth the better view?” That is, by building a more detailed and slightly more accurate ABC/M model, will your questions be better answered? Avoid the creeping elegance syndrome. Larger models introduce maintenance issues.
The next chapter dives deeper to describe the structure of an ABC/M model that ultimately evolves into a permanent, repeatable, and reliable production ABC/M system.