
CHAPTER FOUR
The Strategy Map and Its Balanced Scorecard
THE BALANCED SCORECARD, THE methodology developed by Drs. Robert S. Kaplan and David Norton, recognizes the shortcoming of executive managements' excessive emphasis on after-the-fact, short-term financial results. It improves organizational performance by shifting attention from financial measures to managing nonfinancial operational measures related to customers, internal processes, and employee innovation, learning, and growth. These influencing measures are reported during the period when sooner reactions can occur. This in turn leads to better financial results.
The balanced scorecard is one potential approach to completing the linkage between the setting of strategic direction and the organization's ability to deliver on that direction, thereby supporting the full vision of VBM. Will the adoption rate of the balanced scorecard find the same difficulty crossing the chasms encountered by activity-based costing (ABC) systems in the 1990s? It took many failures in ABC system implementations before organizations learned what ABC is and how to shape, size, and level the detail of ABC systems before organizations began to get them ready and right for use. Are balanced scorecard implementations going to travel down the same bumpy road?
There is lack of consensus as to what a balanced scorecard is. To complicate matters, many organizations initially start with developing a balanced scorecard without first developing its companion and arguably more important strategy map from which the balanced scorecard's key performance indicators (KPIs) should be derived. Further complicating matters is that organizations confuse strategic KPIs that belong in a scorecard with operational performance indicators (PIs) that belong in a dashboard. The differences between KPIs and PIs are described later in this chapter.
LACK OF CONSENSUS
An early indication of trouble is the confusion about what a balanced scorecard is, and more confusion about what its purpose is. There is little consensus. If you ask executives whether they are using a balanced scorecard, many say they are. But if you next ask them to describe it, you'll get widely different descriptions. There is no standard – yet. Some executives say they have successfully transferred their old columnar management reports into visual dashboards with flashing red and green lights and directional arrows. Some realize a scorecard is more than that, and they have put their old measures on a diet, compressing them to a smaller, more manageable number of more relevant measures. Neither may be the correct method.
But how does anyone know if those measures – the so-called key performance indicators (KPIs) – support the strategic intent of the executive team? Are the selected measures the right measures? Or are they what you can measure rather than what you should measure? And is the purpose of the scorecard only to better monitor the dials rather than to facilitate the employee actions needed to move the dials?
Talk about balanced scorecards and dashboards seems to be appearing in business magazines, website discussion groups, and at conferences. Today's technology makes it relatively simple to convert reported data into a dashboard dial. But what are the consequences? What actions are suggested from just monitoring the dials?
In the VBM framework, results and outcome information should answer three questions: What? So what? And then what? Sadly, most scorecards and dashboards only answer the first question. Worse yet, answering the “what” may not even focus on a relevant “what.” Organizations struggle with determining what to measure.
Organizations need to think deeper about what measures drive value and reflect achieving the direction-setting strategic objectives of their executive team. With the correct measures, organizations can then strive toward optimizing these measures, and ideally be continuously forecasting their expected results.
One of today's organizational problems is the disconnection and absence of alignment between local measurements of things a manager or employee can control or influence and the subsequent organizational results. Figure 4.1 reveals how dysfunctional measures create undesirable behavior and results. It illustrates the problem with a symbolic “wall of disconnects” that prevents the existing measures from aligning with the vision and strategy. The example used in the figure is a purchasing department. If you motivate the purchasing function to purchase the lowest-price supplies, equipment, and services, the purchasing function may look good, but other departments may end up having problems. You did not necessarily eliminate costs, but rather shifted costs elsewhere. Worse yet, you may have increased total costs. Strategy maps and a scorecard system remove this wall by selecting the few KPIs that point like vectors toward the organization's vision, mission, and strategy.
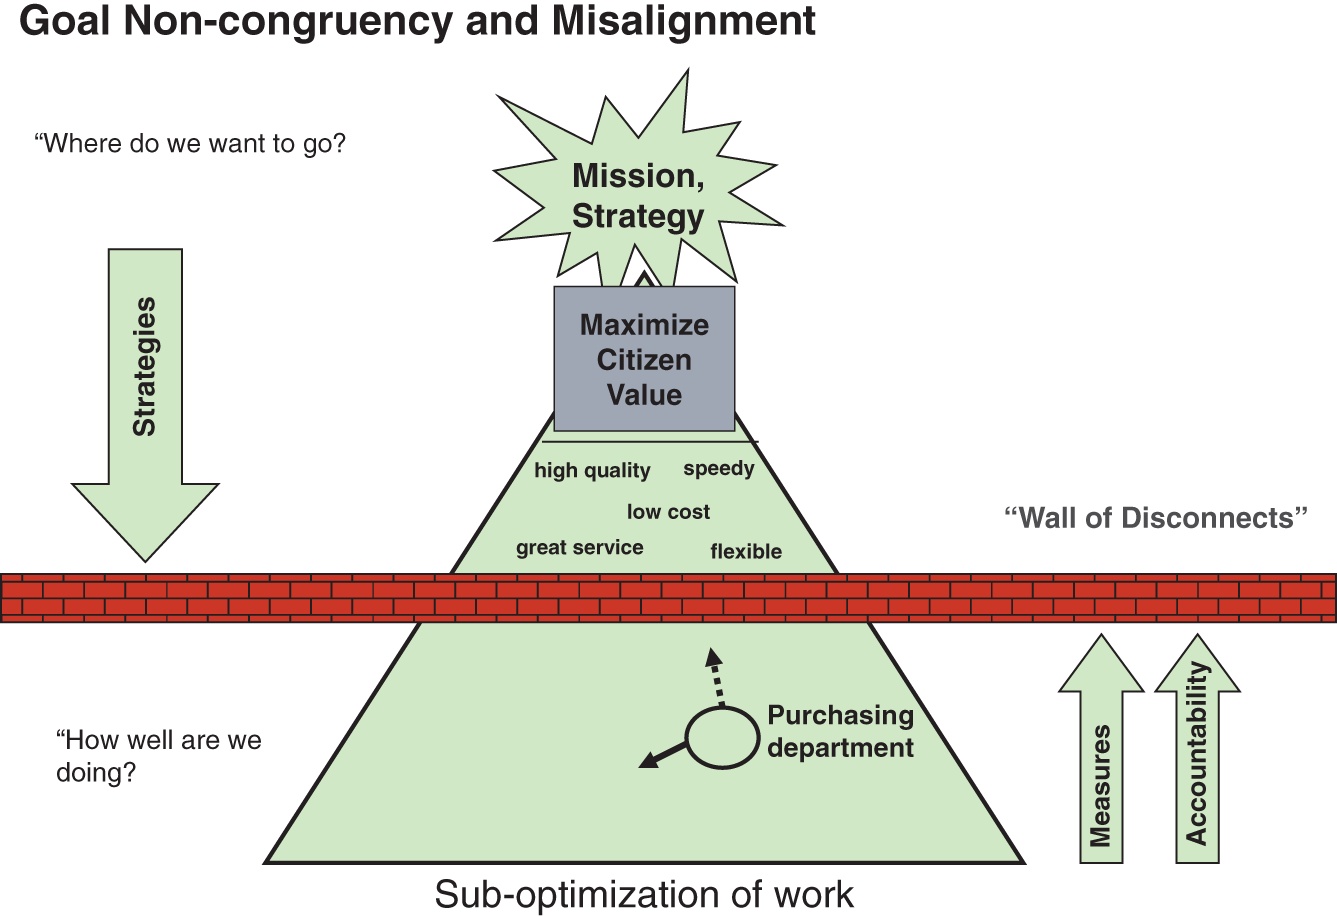
FIGURE 4.1 Goal congruency and misalignment.
Source: © 2019 www.garycokins.com. Used with permission.
IMPLEMENTING TOO FAST AND SKIPPING KEY STEPS
Why are so many people familiar with the term balanced scorecard but so few familiar with the term strategy maps? Strategy maps are orders of magnitude more important than the scorecard, which is merely a feedback mechanism. Why do executives want a balanced scorecard but without a strategy map? One possible explanation is the mistaken belief that those vital few KPI measures, rather than the trivial many, can be derived without first requiring employee teams and managers to understand the answer to a key question: “Where does the executive team want the organization to go?” This question is best answered by the executive team's vision and mission – and they must point to the direction they want the organization to follow them to. That is the executive team's primary job: setting direction. The strategy map and its companion scorecard are important, too, but their combination answers a different question: “How will we get there?”
Figure 4.2 illustrates a generic strategy map with its four stacked popular perspectives. Each rectangle represents a strategic objective and its associated projects or competencies to excel at plus their appropriate measures and targets.

FIGURE 4.2 Generic strategy map architecture.
Source: © 2019 www.garycokins.com. Used with permission.
Note that there are dependency linkages in a strategy map with an upward direction of cumulating effects of contributions. The derived KPIs are not in isolation but rather have context to the mission and vision. To summarize a strategy map connects the linkages from the bottom perspective upward:
- Accomplishing the employee innovation, learning, and growth objectives contributes to the internal process improvement objectives.
- Accomplishing the internal process objectives contributes to the customer satisfaction objectives.
- Accomplishing the customer-related objectives results in achieving the financial objectives, typically a combination of revenue growth and cost management objectives.
The strategy map is like a force field in physics, as with magnetism, where the energy, priorities, and actions of people are mobilized, aligned, and focused. Its purpose is to fulfill the results for the VBM framework, leveraging cause-and-effect relationship linkages via feedback measurements to the organization.
The peril that threatens the success of this methodology is executive teams that are anxious to assign measures with targets to employees and hold them accountable. Executives typically skip three critical steps: (1) explaining their strategy to managers and employees so they understand it, (2) involving the managers and employees to gain their buy-in (and also commitment to the measures), and (3) the more critical prior step to identify the mission-essential projects and initiatives that will achieve the strategic objectives. The presence of enabling projects and initiatives goes to the heart of what distinguishes a strategic objective from just getting better at what you have already been doing. This linkage of using strategic goals to guide definition of supporting projects and actions is fully consistent with the decomposition of objectives discussed in Chapter 3 and shown in Figure 2.5.
An interesting question that is routinely asked is “Where is the organization's strategy defined and located on the strategy map?” The simple answer is that it does not appear. Why not? The reason is that the connected network of the strategic objectives is equivalent to the strategy! Strategic objectives suggest the actions that an organization must complete – or at least make much progress toward completing – or the core processes to excel at in order to achieve the organization's strategy, which in turn would realize its vision. The role of the strategy map is to communicate to employees and managers the direction the executives wish the organization to go. In short, the strategic objectives and supporting strategy map collectively are the strategy!
Figure 4.3 illustrates a modification of the strategy map for public sector organizations. “Maximize Community Value” replaces “Maximize Shareholder Value” for a private sector commercial company. Also, the financial perspective of the private sector strategy map is switched with a citizen/taxpayer/stakeholder perspective.
The list below displays the cause-and-effect flow of a strategy map's perspective from bottom to top.
- A learning environment stimulates process excellence.
- Process excellence leads to balancing of results achieved, resources/costs consumed, and risk accepted.
- Balancing of results achieved, resources/costs consumed, and risk accepted creates value for citizens, taxpayers, and stakeholders.
- The result is to maximize community value.
Figure 4.4 illustrates ideally who should be responsible for which one of five elements of each strategic objective: the executive team or the managers and employees. Sadly, many organizations neglect the first two elements identified in a strategy map. They begin with the third column to select KPIs without first constructing a strategy map. The performance management intelligence resides in the strategy map.
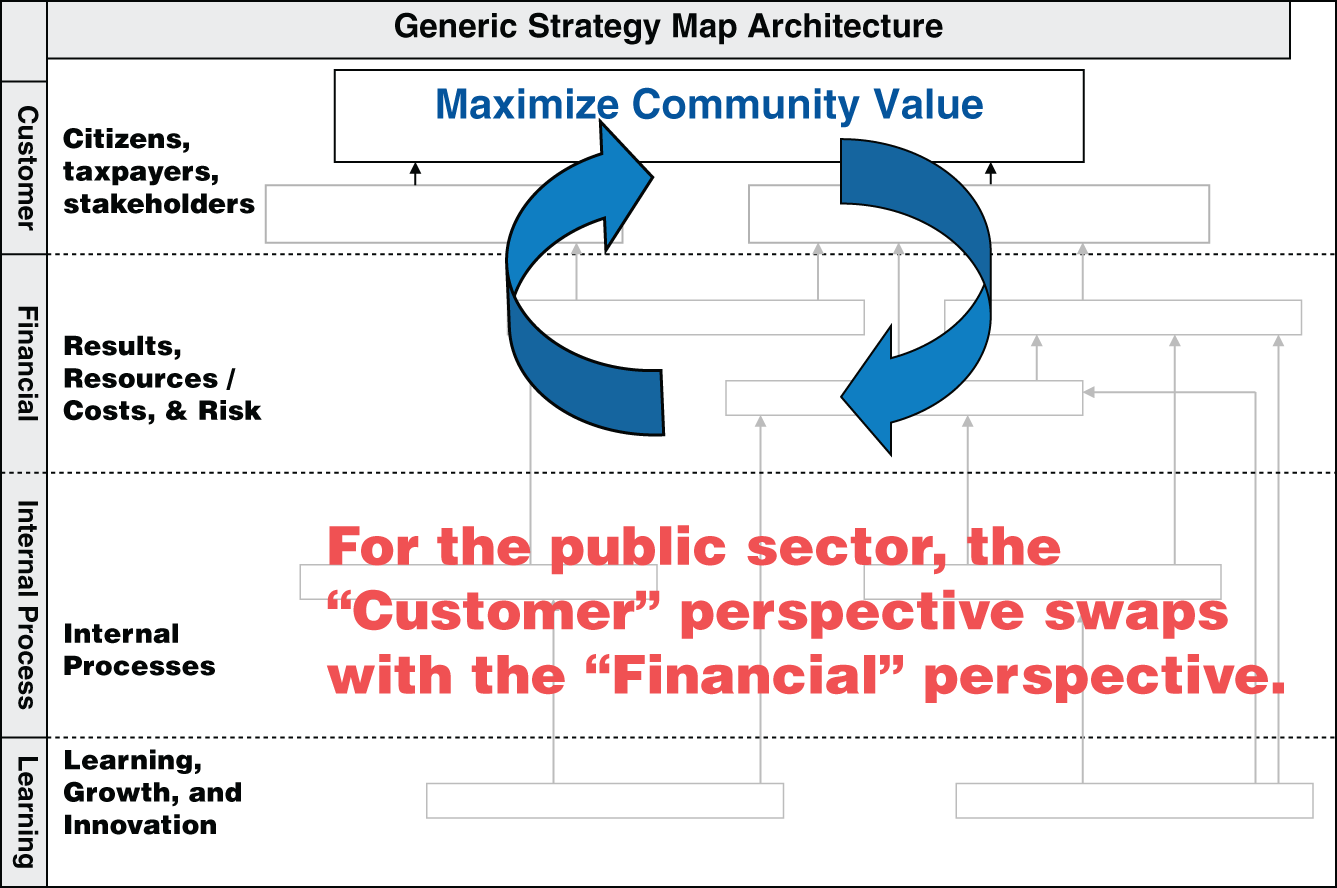
FIGURE 4.3 Public sector strategy map.
Source: © 2019 www.garycokins.com. Used with permission.
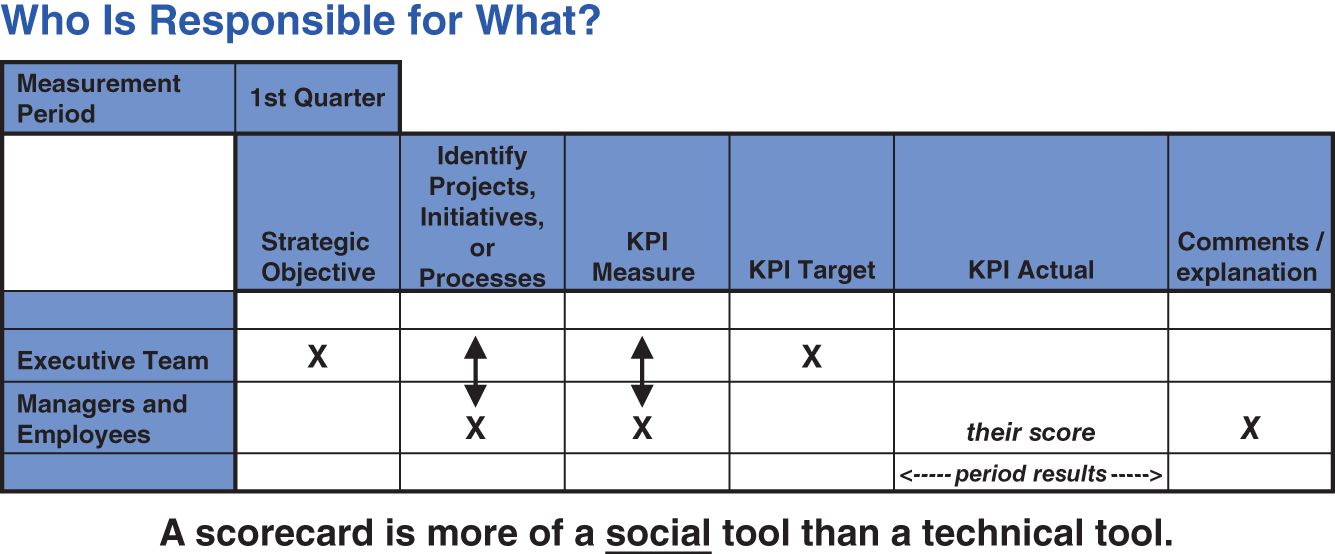
FIGURE 4.4 Who is responsible for what?
Source: © 2019 www.garycokins.com. Used with permission.
Strategy maps and their derived scorecard are navigational tools to guide the organization to execute the strategy, not necessarily to formulate the strategy. Executive teams are typically good at defining strategy, but a high involuntary turnover rate for chief executive officers (CEO) and the increasingly shorter tenure of CEOs are evidence of their failure to implement their strategy.
MEASUREMENTS ARE BOTH SOCIAL AND TECHNICAL
Selecting and measuring KPIs are critical. You get what you measure, and strategy maps and scorecards serve a social purpose. Performance measures motivate people and focus them on what matters most.
Imagine if every day, every employee in an organization, from the cleaning person and janitor at the bottom of an organization to the CEO or managing director at the top, could answer this single question: “How am I doing on what is important?” The first half of the question can be easily displayed on a dial with a target; it is reported in a scorecard or dashboard. But it is the second half of the question that is the key – “on what is important” – and that is defined from the strategy map.
The risk and peril of the balanced scorecard involves the process of identifying and integrating appropriate cause-and-effect linkages of strategic objectives that are each supported by the vital few measures, and then subsequently cascading the KPIs down through the organization. KPIs ultimately extend into performance indicators (PIs) – operational performance indicators – that employees can relate to and directly affect.
The primary task of a strategy map and its companion balanced scorecard is to align people's work and priorities with multiple strategic objectives that, if accomplished, will achieve the strategy and consequently realize the endgame of maximizing shareholder wealth (or maximizing citizen value). The strategic objectives are located in the strategy map, not in the scorecard. The KPIs in the scorecard reflect the strategic objectives in the strategy map.
Debate will continue about how to arrive at the vital few KPIs for workgroups. Here are two approaches:
- Newtonian-style managers, who believe the world is a big machine with dials, pulleys, and levers to push and pull, find appeal in looking at benchmark data to identify which relevant and unfavorably large performance gaps should therefore be areas for their focus. They want to know, “What must we get better at?” The KPIs are then derived. Strategies are then deduced from recognizing deficiencies.
- In contrast, Darwinian-style managers, who believe the organization is a sense-and-respond organism, find appeal in having the executive team design the strategy map by applying a SWOT (strengths, weaknesses, opportunities, and threats) approach, which begins with the executive team freely brainstorming and recording an organization's SWOTs. They then cluster similar individual SWOTs into strategic objectives with causal linkages in the strategy map. Following this initial step, the middle managers and core process owners are then tasked with identifying the few manageable projects and core processes to improve that will attain the executive team's strategic objectives in the strategy map. After that step, those same middle managers can identify the KPIs that will indicate progress toward achieving the projects and improving critical core processes. This latter approach not only assures that mid-managers and employee teams will understand the executive's strategy, about which most mid-managers and employees are typically clueless, but it further generates their buy-in and ownership of the scorecard and KPIs since these have not been mandated to them from the executives. (Of course, the executive team can subsequently challenge and revise their lower managers' selected projects and KPIs – debate is always healthy – but only after the buy-in and learning has occurred.) Figure 4.5 shows managers clustering their SWOTs into the strategic objectives with each perspective in the strategy map.

FIGURE 4.5 Strategy map construction workshop.
Source: © 2019 www.garycokins.com. Used with permission.
SCORECARD OR REPORT CARD? THE IMPACT OF SENIOR MANAGEMENT'S ATTITUDE
Regardless of which technique or method is used to identify the KPIs, the KPIs ideally should reflect the executive team's strategic intent and not be reported in isolation disconnected, as typically the annual financial budget is disconnected from the strategy. This is the peril of the balanced scorecard. Its main purpose is to communicate the executive team's strategy to employees in a way they can understand it, and to report the impact of their contribution to attaining it. But starting with KPI definition without context to the executive's mission and vision denies this important step.
Research from Professor Raef Lawson when he was at the State University of New York, Albany, suggests that a major differentiator of success from failure in a balanced scorecard implementation is the senior management's attitude. Scorecard or report card? Will we use it for punishment or remedy? Do we work for bosses we must obey as if we were a dog (“roll over”)? Or do we work for coaches, like on a sports team, and mentors who guide and counsel us?
As an example, is senior management anxiously awaiting those dashboards so they can follow the cascading score meters downward in order to micromanage the workers under their middle managers, acting like Darth Vader to see which of their minions may need to be cut off from their air supply? Or will the executives appropriately restrict their primary role and responsibility to define and continuously adjust strategy (which is dynamic, not static, always reacting to new insights) and then allow the empowerment of employee teams to select KPIs from which employees can actively determine the corrective interventions to align with the strategy?
The superior strategy map and scorecard systems embrace employee teams communicating among themselves to take actions rather than a supervisory command-and-control, in-your-face style from senior managers. An executive team micromanaging the KPI score performance of employees can be corrosive. If the strategy map and cascading KPI and PI selection exercise is done well and subsequently maintained, then higher-level managers need only view their own score performance, share their results with the employee teams below them, and coach the teams to improve their KPI and PI scores and/or reconsider adding or deleting KPIs or PIs.
A DIFFERENCE BETWEEN VBM AND THE BALANCED SCORECARD
In Chapter 2 it was mentioned that the balanced scorecard is one of several methods used for strategy execution. Other examples are blue ocean strategy, “good to great,” creating shared value, disruptive innovation, return-driven strategy, and reverse innovation. The authors chose to illustrate strategy execution using the balanced scorecard because it is a popular one.
VBM adds a variation to the balanced scorecard. Refer back to Figure 3.3, which is similar to how KPIs are cascaded downward to the managers and employee teams. These are also “subobjectives,” which do not reside in a strategy map. The subobjectives are decomposed operational objectives that contribute to attaining the higher-level strategic objectives. Here is text from that chapter:
This requires translating or decomposing strategic goals of value to stakeholders into operational objectives for the overall organization. These goals and objectives are in turn decomposed and cascaded downward to lower organizational levels that are focused on delivering more specific elements of the higher-level objectives.
Other than this variation the concepts remain similar.
WHY NOT AN AUTOMOBILE GPS NAVIGATOR FOR AN ORGANIZATION?
Most new cars today have a global positioning system (GPS) route navigator. As with most new technologies, such as when handheld calculators replaced slide rules or laptop computers emerged, a GPS is another device that has evolved into a must-have for many of us. They get you to your destination without a hassle and offer a comforting voice to guide you along the way. Why can't an organization have a similar device? It can.
The refinement in usage of strategy maps and its companion balanced scorecard are becoming the GPS route navigator for organizations. For organizations the destination input into the GPS is the set of strategic goals. As earlier described, the executive team's primary job is to set strategic direction, and the “top” of their strategy map is their destination. However, unlike a GPS's knowledge of roads and algorithms to determine the best route, managers and employee teams must “map” which projects, initiatives, and business process improvements are best to get to the destination for achieving the strategic goals. In addition, when you are driving a car with a GPS instrument and you make a wrong turn, the GPS voice chimes in to tell you that you are off track – and it then provides you with a corrective action instruction. However, with most organizations' calendar-based and long cycle-time reporting, there is delayed reaction. The VBM includes a GPS.
Next, the organization as the automobile itself needs to be included. The motor and driveshaft are the employees with their various methodologies, such as customer value management and service delivery, that propel the organization toward its target. Collectively, the many methodologies, including lean management and activity-based costing, are two of the intermeshed gears of VBM.
But what important aspect of this automobile analogy is missing? Fuel efficiency. However, just like a poorly performing car with some broken gears, tires out of alignment, and gunky lubrication will yield poor gallons per mile (or liters per kilometer), the analogy is poorly integrated methodologies, impure raw data, and lack of digitization and analytics results in poor rate of shareholder financial wealth creation. The full vision of the VBM framework removes the friction and vibration plus weak torque, not only to optimize the consumption of the organization's resources – its employees and spending – but it also gets the organization to its strategy destination faster, cheaper, and smarter. The result? A higher shareholder wealth creation yield.
Finally, as mentioned earlier, a strategy is never static but is constantly adjusted. This means the destination input to the GPS navigator is constantly changing. This places an increasing importance on predictive analytics to determine where the best destination for stakeholders is located. How much longer do you want to drive your existing automobile when a VBM car with a GPS is now available to lift wealth creation efficiency and yield?
FAILURES DUE TO ARROGANCE, IGNORANCE, OR INEXPERIENCE?
Some proposed management improvement methodologies, like the lights-out manufacturing factory touted in the 1980s, are fads that come and go. But the strategy map and its companion, the balanced scorecard for feedback, are most certain to be a sustained methodology in the long term. It only makes common sense that executive teams provide direction-setting and employee teams then take the actions to “get there.” Are these early twenty-first-century missteps and misunderstandings in implementing the balanced scorecard due to arrogance, ignorance, or inexperience? This book proposes it is due to inexperience.
Conflict and tension are natural in all organizations. Therefore, it takes time among managers and employees to stabilize what ultimately is a behavioral measurement mechanism of cause-and-effect KPIs, to distinguish between KPIs and PIs; and to then get mastery with how to use both these types of measures to navigate, power, and steer as an integrated enterprise. As stated by the author Peter Senge, a thought leader in the field of organizational change management, the differentiator between successful and failing organizations will be the rate, and not just the amount, of organizational learning. Those intangible assets – employees as knowledge workers and the information provided to them – are what truly power the performance management framework.
HOW ARE BALANCED SCORECARDS AND DASHBOARDS DIFFERENT?
There is confusion about what the difference is between a balanced scorecard and a dashboard. There is similar confusion differentiating key performance indicators (KPIs) from normal and routine measures that we can refer to as just performance indicators (PIs). The adjective “key” of a KPI is the operative term. An organization has only so much resources or energy to focus. To use a radio analogy, KPIs are what distinguish the signal from the noise – the measures of progress toward strategy execution. As a negative result of this confusion, organizations are including an excessive number of PIs in their scorecard system that should be restricted to KPIs.
A misconception about a balanced scorecard is that its primary purpose is to monitor results. That is secondary. Its primary purposes are to report the carefully selected measures that reflect the strategic intent of the executive team, and then enable ongoing understanding as to what should be done to align the organization's work and priorities to attain the executive team's strategic objectives. The strategic objectives should ideally be articulated in a strategy map, which serves as the visual vehicle from which to identify the projects and initiatives needed to accomplish each objective, or the specific core processes at which the organization needs to excel. After this step is completed, then KPIs are selected and their performance targets are set. With this understanding, it becomes apparent that the strategy map's companion scorecard, on its surface, serves more as a feedback mechanism to allow everyone in the organization, from frontline workers up to the executive team, to answer this question: “How are we doing on what is important?” More importantly, the scorecard should facilitate analysis to also know why. The idea is not to just monitor the dials but to move the dials.
VITAL FEW VERSUS THE TRIVIAL MANY
Michael Hammer, the author who introduced the concept of business process reengineering, described the sad situation of measurement abuse in his book, The Agenda: What Every Business Must Do to Dominate the Decade:
In the real world … a company's measurement systems typically deliver a blizzard of nearly meaningless data that quantifies practically everything in sight, no matter how unimportant; that is devoid of any particular rhyme or reason; that is so voluminous as to be unusable; that is delivered so late as to be virtually useless; and that then languishes in printouts and briefing books without being put to any significant purpose. … In short, measurement is a mess. … We measure far too much and get far too little for what we measure because we never articulated what we need to get better at, and our measures aren't tied together to support higher-level decision making.1
Hammer is clearly not hiding his feelings. But has the cure been worse than the ailment? Simply reducing the number of measures can still result in an organization measuring what it can measure as opposed to what it should measure. But to determine what you should measure requires deeper understanding of the underlying purposes of a balanced scorecard relative to a dashboard.
SCORECARDS AND DASHBOARDS SERVE DIFFERENT PURPOSES
The two terms – scorecards and dashboards – have a tendency to confuse, or rather get used interchangeably, when each brings a different set of capabilities. The sources of the confusion are:
- Both represent a way to track results.
- Both make use of traffic lights, dials, sliders, and other visual aids.
- Both can have targets, thresholds, and alert messages.
- Both can provide drill-down to other metrics and reports.
The difference comes from the context in how they are applied. To provide some history, as busy executives and managers have struggled to keep up with the amount of information being thrust at them, the concept of traffic lighting has been applied to virtually any and all types of reporting. As technology has improved, more bells and whistles have been added; an example is the ability to link to other reports and to drill down to finer levels of detail. The common denominator was the speed of being able to focus on something that required action or further investigation. The terminology evolved to reflect how technology vendors described what provided this capability. As a consequence, both dashboard and scorecard terms are being used interchangeably.
Figure 4.6 illustrates the difference between scorecards and dashboards using a taxonomy starting with all measurements in general. Scorecards and dashboards are not contradictory; they are used for different purposes.
At the top portion of the figure is the realm of scorecards. Scorecards are intended to be strategic. They align the behavior of employees and partners with the strategic objectives formulated by the executive team. In contrast, dashboards, at the bottom portion of the figure, are intended to be operational.

FIGURE 4.6 Difference between KPIs and PIs: scorecard versus dashboard.
Source: © 2019 www.garycokins.com. Used with permission.
Some refer to dashboards as “dumb” reporting and scorecards as “intelligent” reporting. The reason is dashboards are primarily for data visualization; they display what is happening during a time period. Most organizations begin with identifying what they are already measuring and construct a dashboard dial from there. However, dashboards do not communicate why something matters, why someone should care about the reported measure, or what the impact may be if an undesirable declining measure continues. In short, dashboards report what you can measure.
The selection and validation of the correct or best KPIs is a constant debate. Statistical correlation interaction analysis among KPIs can determine the degree of influence and “lift” that various cascaded KPIs have on the higher-level enterprise-wide KPIs; hence correlation analysis validates or improves the KPI selection. In addition, this type of analysis can automatically uncover previously unknown statistical relationships that may suggest cause-and-effect and can be used for predictive power. You want to make changes based on anticipated targets and constantly refocused outcomes so that employees can proactively make changes before unexpected events occur that would require a much more expensive reaction. In short, scorecards report what you should measure.
Here are some guidelines for understanding the differences:2
- Scorecards chart progress toward strategic objectives. A scorecard displays periodic snapshots of performance associated with an organization's strategic objectives and plans. It measures organizational activity at a summary level against predefined targets to see if performance is within acceptable ranges. Its selection of KPIs helps executives communicate strategy to employees and focuses users on the highest-priority projects, initiatives, actions, and tasks required to execute plans. The adjective “key” differentiates KPIs from the PIs reported in dashboards.
Scorecard KPIs ideally should be derived from a strategy map rather than just a list of important measures that the executives have requested to be reported. Regardless of whether the Kaplan and Norton suggested four stacked perspectives are used or some variant, scorecard KPIs should have cause-and-effect linkages (e.g., statistical correlations). Directionally upward from the employee-centric innovation, learning, and growth perspectives, the KPIs should reveal the cumulative build of potential to realized economic value.
There are two key distinctions of scorecards: (1) each KPI must require a predefined target measure; and (2) KPIs should comprise both project-based KPIs (e.g., milestones, progress percentage of completion, degree of planned versus accomplished outcome) and process-based KPIs (e.g., percent on-time delivery against customer promise dates). A scorecard comprised mainly or exclusively by process-based KPIs is not an efficient engine of change; it merely monitors whether progress from the traditional drivers of improvement, such as quality or cycle-time improvement, is occurring. Process improvement is important, but innovation and change are even more important.
- Dashboards monitor and measure processes. A dashboard, however, is operational and reports information typically more frequently than scorecards and usually with measures. Each dashboard measure is reported with little regard to its relationship to other dashboard measures. Dashboard measures do not directly reflect the context of strategic objectives.
This information can be more real-time in nature, like an automobile dashboard that lets drivers check their current speed, fuel level, and engine temperature at a glance. It follows that a dashboard should ideally be linked directly to systems that capture events as they happen, and it should warn users through alerts or exception notifications when performance against any number of metrics deviates from the norm or what is expected.
The caution the authors have for organizations that are paying more attention to their performance measurements involves (1) the linkage of scorecard KPIs to the strategy diagram (often referred to as a strategy map) and also to the fiscal budget (as well as rolling financial forecasts); and (2) the linkage of dashboard PIs selected to influence behavior that will ultimately result in achieving or exceeding the KPI targets. Strategy diagrams and the budget are located in Figure 4.6 and are described below.
The authors observe a limitation of the balanced scorecard is that it does not include risk management and key risk indicators (KRIs). One can simply consider that if the KRIs are falling below their set targets, then there will be an adverse impact on KPIs. That is a simplistic view of the linkage of KRIs and KPIs where reporting of KRIs can be viewed as an early warning system that leads to impacts on KPIs.
SCORECARDS LINK THE EXECUTIVES' STRATEGY TO OPERATIONS AND TO THE BUDGET
A strategy diagram is located in the upper left of Figure 4.6, which denotes that KPIs should be derived from the executives' strategic objectives and plans. If KPIs are selected independent of the strategy, then they will likely report only what can be measured as opposed to what should be measured. Failure to execute a strategy is one of a CEO's major concerns, and therefore KPIs should either reflect mission-critical projects and initiatives or core business processes that must be excelled at. (Hence there is the need for both project-based and process-based KPIs.)
The budget (and increasingly rolling financial forecasts) should be derived from the required funding of the projects (i.e., the nonrecurring strategy expenses and capital investments) and of the operational processes (i.e., the recurring operational capacity-related expenses that vary with driver volumes, such as workload demand from stakeholders, such as citizens).
Furthermore, the budget should also include spending derived from risk management. As was just mentioned, a limitation of the balanced scorecard is the absence of linkage to risk management. Chapter 6 in Part Four of this book is on risk management.
A strategy is dynamic, never static, as executives appropriately shift directions based on their new insights and observations. Reliably accurate forecasting is critical for both strategy formulation and future balancing of results, resources, and risks.
DASHBOARDS MOVE THE SCORECARD'S DIALS
The organization's traction and torque are reflected in the dashboard's PI measures, the more frequently reported operational measures. Although some PIs may have predefined targets, PIs serve more to monitor trends across time or results against upper or lower threshold limits. As PIs are monitored and responded to, then the corrective actions will contribute to achieving the KPI target levels with actual results.
Cause-and-effect relationships between and among measures underlie the entire approach to integrating strategy diagrams (formulation), scorecards (appraisal), dashboards (execution), and fiscal budgets (the fuel).
STRATEGY IS MORE THAN PERFORMING BETTER: IT INVOLVES DOING DIFFERENT THINGS
As mentioned earlier, strategy is dynamic, not static. The purpose of strategic objectives in a strategy map is to redirect the organization from the tyranny of maintaining the status quo. Strategy is about reacting to constant change. Strategic objectives are about the changes an organization should make to deliver maximum stakeholder value.
Dashboards and scorecards are not mutually exclusive. In fact, the best dashboards and scorecards merge elements from one another.
A simple rule is to use the term “dashboard” when you merely want to keep score, as in a sports event, and use the term “scorecard” when you want to understand the context of key scores in terms of how they influence achievement of strategic outcomes. A scorecard's measures will be fewer in number; they are strategic and carry more weight and influence. In contrast, the number of dashboard measures could number in the hundreds or thousands – you still need a way to focus on the unfavorable-to-target ones fast for tactical action. However, action with respect to a single metric in a dashboard is less likely to change strategic outcomes as dramatically compared to when reported in a scorecard.
GETTING PAST THE SPEED BUMPS
The authors believe that the scorecard and dashboard components of commercial software should have predefined KPIs. However, for the integrated software component that reports measurements, the vendor's software should deliberately come with a limited rather than a comprehensive selection of KPIs that are commonly used by each type of industry. The purpose of providing standard KPIs should only be to accelerate the implementation of an organization's construction of their scorecard/dashboard system with a jumpstart.
The reason for not providing a comprehensive and exhaustive list of industry-specific measures is because caution is needed whenever an organization is identifying its measures. Measures drive employee behavior. Caution is needed for two major reasons:
- Measures should be tailored to an organization's unique strategic goals.
- Organizations should understand the basic concepts that differentiate scorecards from dashboards and KPIs from PIs.
Organizations should successfully implement and sustain an integrated strategic scorecard and operational dashboard system. Hence organizations should understand the distinctions described here. This is why the reader is cautioned against simply using an out-of-the-box list of various industries' common KPIs and PIs, regardless of their source.
As with any improvement methodology, experience through use refines the methodology's effectiveness and impact. The plan-do-check-act (PDCA) cycle is a great practice for learning organizations. With improvement methodologies, it's difficult to “get it perfectly right” the first time. There will always be a learning curve. Many organizations overplan and underexecute. With regard to KPI and PI selection, first learn the principles, and then apply them through selecting, monitoring, and refining the KPIs. Strategy maps and balanced scorecards are a craft, not a science.