
CHAPTER ELEVEN
Fundamentals: What Is ABC/M?
IN THIS CHAPTER, WE will get into a lot more of the nitty-gritty involved in designing an ABC/M system. Chapter 10 briefly covered some of the basic concepts underlying the ABC/M model and introduced the ABC/M cross in its simplified form as Figure 10.4. Now we will enlarge upon the basic view in Chapter 10 to show the fuller richness and complexity of the ABC/M model as it actually works.
EXPANDING THE TWO-STAGE ABC/M CROSS MODEL
The ABC/M cross in Figure 10.4 depicted the key relationship between ABC/M and the management analysis tools that are needed to bring full realization of benefits to the organization. ABC/M is a methodology that can yield significant information about cost drivers, activities, resources, cost objects, and performance measures. This information gives an organization the opportunity to improve the value of its products and services. The ABC/M data reflect how the organization is consuming its resources, and this image in turn serves as an enabler for inferences and decision support.
The initial focus of early ABC/M applications was the determination of product and service-line costs through better segmentation and assignment of resource expenses consumption. Subsequent applications in larger and more complex organizations revealed that ABC/M information is useful in solving broader problems. For these solutions, the ABC cost calculation usually required more than a simple, so-called “two-stage” cost reassignment, as indicated by the cost assignment view of the ABC/M basic cross model. Figure 11.1 illustrates the expansion of the cost assignment network from two stages to a multistage network.
The expanded ABC/M model includes intermediate stages of activities (i.e., activity outputs that are inputs to successive work activities). This expansion recognizes that overhead is complex and escalating in expense. Support departments do work for other support departments that in turn do work for other support departments, ultimately doing work for the front-line primary work activities that produce products or deliver services for end users, service recipients, and customers. Specific usage, not time-based sequence, is the dominant factor for determining this cost assignment structure. These intermediate input/outputs cannot easily be traced directly to final cost objects (i.e., products, service lines, or types of service recipients) since there is no causal relationship. As a result, intermediate activities are two or more stages of cost assignment removed from a final cost object. These support-related activity costs raise the question “How much of this activity is consumed by specific products or service lines?”
ABC/M is more complex than what we have described up to this point. To segment resource expenses consumption to reflect variety and diversity, the ABC/M vertical axis expands somewhat. It is virtually impossible to answer this question because the work is simply too indirect and remote from the products or service recipients to detect or sense the relationship. However, these support activities can be traced in proper proportions to other activities that require their input. Such support-related activity costs are eventually burdened into the primary activity costs. These intermediary activities support the work activities that detect the variation and diversity of the products or service lines.
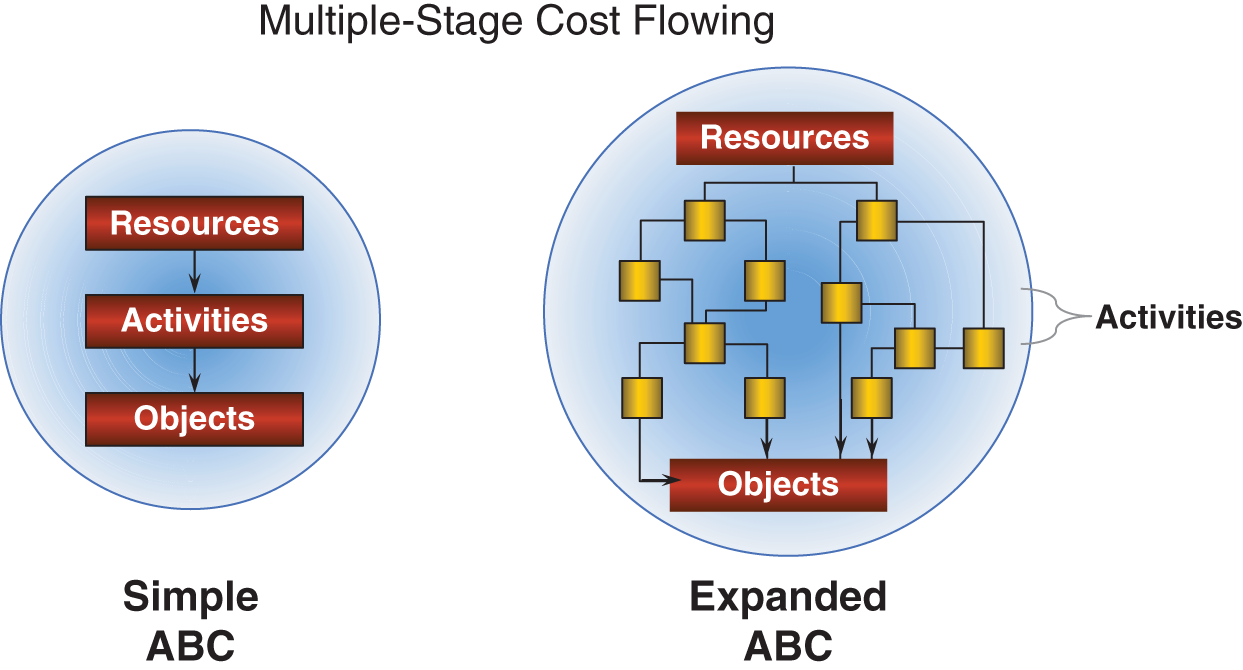
FIGURE 11.1 Multiple-stage cost flowing.
Source: Copyright 2019 www.garycokins.com.
The ABC/M model uses multi-stages to trace all the costs through a network of cost assignments into the final cost objects.
Figure 11.2 diagrams a generic cost assignment network in an expanded ABC/M model. The main difference between this diagram and the basic ABC/M model in Figure 4.1 is the presence of: (1) intermediate stages of activity-to-activity cost assignments, and (2) cost object–to–cost object assignments.

FIGURE 11.2 ABC/M cost assignment network.
Source: Copyright 2019 www.garycokins.com.
It is helpful to visualize the cost assignment paths of the generic expanded ABC/M model of Figure 11.2 as thin straws and wide pipes, where the diameter reflects the amount of cost flowing. The power of the expanded ABC/M model is that the cost assignment paths and destinations provide traceability from beginning to end. That is, it is from resource expenditures to each type of (or each specific) product or service recipient, which are the origin for all costs.
It is useful to mentally and visually reverse all the arrowheads in this diagram so that costs flow in the opposite direction. That is what is actually happening in an organization every minute, hour, day, week, month, and year. The citizens, customers, products, service lines, and supplier-related costs are placing demands on work that in turn draws on the resource expenses spending. The calculated costs then measure the effect in the opposite direction. Costs measure effects. This polar switch reveals that all costs originate with a demand-pull from customers and service recipients and that the costs simply measure the effect on resources.
Figure 11.2 also demonstrates that assets and equipment perform activities, too, and they are another example of an intermediate activity. As examples, people operate machines and machines make products, or people drive buses and buses deliver passengers. These are activity-to-activity cost assignments. In capital equipment–intensive organizations, the equipment essentially performs the mainstream work that fulfills the needs of service recipients. Equipment-related activities often require support activities to operate effectively. The equipment activity costs are usually assigned to cost objects using activity drivers that are based on:
- Units of time (e.g., per minute), or
- Equivalent inputs or outputs (e.g., number of units produced), which measure the relative processing time per unit of output, roughly equal among products or service lines
Some people are initially intimidated by Figure 11.2. It makes logical sense the more you work with ABC/M. The ABC/M cost assignment network is related to an observation that has become known as Metcalf's Law:
The value of a network increases as the number of nodes increases.
The authors' experience with ABC/M has convinced us that the key to a good ABC/M system is the design and architecture of its cost assignment network. The “nodes” are the sources and destinations through which all the expenses are reassigned into costs. Their configuration helps ensure the utility and value of the data for decision makers. And, although this is counterintuitive, the number-one determinant of the accuracy of the final cost objects is the network itself. By detecting how the diversity and variation of outputs relates to the work, it is linked relationships that influence cost object accuracy more than the quantities in the cost drivers.
IDENTIFICATION AND TREATMENT OF ORGANIZATIONAL SUSTAINING COSTS
The final cost object to the far right in Figure 11.3 is the organizational sustaining costs. Many activities in an organization do not directly contribute to value, responsiveness, and quality. That does not mean that those activities can be eliminated, or even reduced, without doing harm to the organization. For example, preparing required regulatory reports for other government agencies certainly does not add to the value of any cost object or to the satisfaction of the customer or service recipient. However, this activity does have value to the organization: it permits the organization to function in a legal manner. These types of activity costs are usually traced to a “sustaining cost object” group. Organizational sustaining costs are not involved with directly making or delivering a product or serving a citizen, customer, or service recipient.

FIGURE 11.3 Organizational sustaining final cost object.
Source: Copyright 2019 www.garycokins.com.
Organizational sustaining costs are those costs not caused by products or citizen and customer-service needs. The consumption of these costs cannot be logically traced to products, services, citizens, customers, or service recipients. One example is the cost associated with the accounting department closing the books each month. How can one measure which service line or service recipient caused more or less of that work? Another example is the cost of lawn maintenance.
Organizational sustaining costs cannot be directly charged to a service line in any possible fair and equitable way; there is simply no use-based causality originating from the service line or service recipient. (Yet overhead costs are routinely and unfairly “allocated” this way despite the result being misleading costs.) Recovering these costs via pricing or funding may eventually be required, but that is not the issue here; the issue is fairly charging cost objects when no causal relationship exists.
In early ABC/M cost assignment structures, ABC teams conveniently allocated all support and general administrative expenses to activities or directly to final cost objects (e.g., products, service lines) despite no cause-and-effect relationships. This also overstates the true costs of costs objects.
The structure of expanded ABC/M systems leverages the use of sustaining activities traced to sustaining cost objects to segregate activity costs related to products and service recipients from activities that have little to do with delivering services. “Sustaining costs” can be included or excluded in the final cost of cost objects depending on the nature of the decision to be made; that is, the assumption of applying full versus marginal cost absorption is decision-dependent.
Organizational sustaining costs for government and not-for-profit organizations can eventually be fully absorbed into products or service lines, but such a cost allocation is blatantly arbitrary. There simply is no cause-and-effect relationship between an organizational sustaining cost object and the other final cost objects. If and when these costs are assigned into final cost objects, organizations that do so often refer to them as a “management tax” representing a cost of doing business apart from the products and service lines.
Examples of final cost objects that constitute business sustaining cost objects may include senior management (at individual levels, such as headquarters, division, and local) or other government regulatory agencies (such as environmental, occupational safety, or tax authorities). In effect, these organizations – via their policies and compliance requirements or via their informal desires, such as briefings or forecasts – place demands on work activities not caused by or generally attributable to specific service lines or service recipients.
Other categories of expenses that may be included as organizational sustaining costs could include idle but available capacity costs or research and development (R&D). Remember that ABC is managerial accounting, not regulated financial reporting, so strict rules of generally accepted accounting principles (GAAP) do not need to be followed, but they can be borrowed.
THE TWO VIEWS OF COST: COST OBJECT AND PROCESS VIEWS
As government agencies flatten their organizational structures and strengthen their commitment to the interests of their customers, effective business processes become critical to improved performance – if not to survival. An organization's processes are the integrating theme for its work and are the vehicles that ultimately achieve value for customers. Managing business processes, and their outputs, requires understanding what the business processes and their outputs cost, as well as knowing what their value is perceived to be by taxpayers, service recipients, and governing bodies. That brings us to the reason that a more effective measurement of costs is becoming so important.
It is important for ABC/M design teams to correctly design their cost assignment networks and process views at the outset – not later, when the ABC/M system is large and making changes is difficult.
The expanded ABC/M approach calls for two separate cost assignment structures:
- The horizontal process cost scheme is governed by the time sequence of activities that belong to the various processes.
- The vertical cost reassignment scheme is governed by the variation and diversity of the cost objects.
In effect, think of the ABC/M cost assignment view as time-blind. The ABC/M process costing view, at the activity stage, is output mix-blind. The cost assignment and business process costing schemes are two different views of the same resource and activity costs. The work activity costs at the intersection of the ABC cross are shared and common to both views. These activity costs at the intersection are the starting point of their two alternative route networks for flowing costs – one diversity-based and the other time sequence–based. The activity costs are the initial translation of the general ledger or fund accounting expenditures that represent their resource consumption. After the work activities are costed from the resources via resource drivers, the activity costs may then either:
- Be added across time for the process view, or
- Be reassigned with their eventual accumulation into the products, service lines, channels, or service recipients for the view of the mix of final cost objects.
Figures 11.4 and 11.5 show these two views of activity costs. After the resource costs are assigned to and translated into activity costs, one may prefer to think of the activity costs at the ABC cross's intersection as being on a pivot. In Figure 11.4, each activity cost is pivoted in the direction of diversity and variation; the activity costs are aimed at the cost object that is the originating source of that diversity. One way to think of the ABC/M vertical cost assignment view is that end-customers “place demands on work” in one direction, thus consuming the resources. Then the costs flow as a result (“costs measure the effect”) in the opposite direction. These relationships preserve the basic tenets of a full absorption costing system.

FIGURE 11.4 The vertical cost object view of assigning costs.
Source: Copyright 2019 www.garycokins.com.
In Figure 11.5 the activity costs are pivoted in the direction of time, the ABC/M horizontal process view. Managers and employees generally find the ABC/M process view easier to understand since it aligns with the sequence of their actual activities. Managers are comfortable with a flowchart view of their processes.
In summary, in the ABC cross, the total cost of the same activities going horizontally (i.e., total business process costs) and the total costs being assigned and causally traced vertically (i.e., total product, customer, receiver, or business infrastructure-sustaining costs) must equal each other.

FIGURE 11.5 The horizontal process view of sequencing costs.
Source: Copyright 2019 www.garycokins.com.
LEVELING OR DISAGGREGATION BRINGS ABOUT A THREE-DIMENSIONAL ABC CROSS
One of the questions that organizations implementing ABC most frequently ask is, “How many activities should we include in our ABC system?” There is no one correct answer. The number of activities is dependent on the answer to several other questions, such as, “What problem are you trying to solve with the ABC data?” In other words, the size, depth, granularity, and accuracy of an ABC system are dependent variables; they are determined by other factors. The level of detail and accuracy of an ABC system depends on what decisions the ABC data will be used for.
Indeed, one of the challenges for ABC/M implementation teams is determining the level of detail to build into the system – specifically, how many activities to use. More refinement usually leads to more activities and greater disaggregation of activities (i.e. levels, or depth), which in turn results in increasingly larger ABC/M systems – despite accounting for the same amount of expenditures. Greater size implies greater administrative effort, but not necessarily more usefulness from the additional data. Greater size can lead to death by details.
Thus, the ABC/M cross can be displayed as layers that lie immediately below the single “box” for each of the three modules of the expanded ABC/M model. The three-dimensional view in Figure 11.6 reveals what the cross looks like with depth and layers of detail. Not only are there always two or more specific resources, activities, and final cost objects, but any one of these can be decomposed (or disaggregated, as in an indented “bill of cost”).

FIGURE 11.6 The three-dimensional ABC cross.
Source: Copyright 2019 www.garycokins.com.
It is now known that the degree of ABC/M data detail – and its accuracy – should depend on its uses (i.e., the types of decisions to be made using the data). High accuracy in the cost of cost objects is not automatically achieved with additional disaggregation (i.e., depth). Moreover, if pursued too far, disaggregation may in fact hamper the effort to sustain an ABC/M system. Controlling the levels (i.e., depth) and size of an ABC system is an important ABC/M system design decision that affects how easily an ABC system can be maintained for updated reporting.
THE IMPACT OF THE REPEATABILITY OF WORK
When work activities are nonrecurring, such as with a law firm's client-billing or when constructing a skyscraper or earth-orbiting satellite, then a more exacting form of direct costing may be needed for higher accuracy. This is where project accounting, work order costing, or job costing is more appropriate. This approach to costing requires that all activity charges be made simultaneously and directly to the ultimate customer account or to a work-step in a project plan.
In Figure 11.7, the horizontal axis represents the repeatability of work, ranging left to right from nonrecurring to recurring. The curve for project accounting, job costing, and work order costing descends in applicability as the type of work becomes less nonrecurring – that is, more repeatable. With projects, the time schedule, including unplanned delays and their consequences, can severely govern the total costs. Project accounting serves well when the conditions of nonrecurring work and lots of interdependencies are present. However, where work activities are recurring and repetitive, such as with the cashier in the license bureau, project accounting is less applicable.

FIGURE 11.7 ABC versus project/program accounting.
Source: Copyright 2019 www.garycokins.com.
Since there is broad diversity and variation in services and outputs, even for a cashier, organizations are keenly interested in the unit costs of the output of work. (“What is the cost per license renewal of an individual versus a commercial customer?”). This is where ABC/M provides an economical solution. In Figure 11.7, the curve for ABC/M ascends in applicability as work activities become more recurring, though varying in time duration, even though the work produces or serves a broad variety of diverse products, services, customers, service recipients, and taxpayers.
Next up, Chapter 12 describes how ABC/M information can be used for operational and productivity improvement. This is often referred to as “cost management.”