
Chapter 2
A Conceptual Framework and Mathematical Foundation for Trade-Off Analysis
Gregory S. Parnell
Department of Industrial Engineering, University of Arkansas, Fayetteville, AR, USA
Azad M. Madni
Systems Architecting and Engineering and Astronautical Engineering, Viterbi School of Engineering, University of Southern California, Los Angeles, CA, USA
Robert F. Bordley
Systems Engineering and Design, University of Michigan, Ann Arbor, MI, USA; Booz Allen Hamilton, Troy, MI, USA
Truly successful decision making relies on a balance between deliberate and instinctive thinking.
(Malcolm Gladwell)
2.1 Introduction
Systems are developed to create value for stakeholders that include customers, end users/operators, system developers/integrators, and investors. Decisions are ubiquitous in the system life cycle beginning from systems definition to the systems concept development to design to delivery of products and services to retirement of the system (see Chapter 1). System decision-makers (DMs) are those individuals who need to make important decisions pertaining to system definition, concept, architecture, design, test, implementation, operation, maintenance, improvement, and disposal.
Enterprise decision-makers, program managers, and systems engineers stand to benefit from a collaborative decision-making process that engages all stakeholders (SHs) who have a say in system trade-off analysis (e.g., customers, operators/users, system architects and engineers, subject matter experts (SMEs)). In particular, systems engineers can exploit trade-off studies to identify the decision opportunity, identify sources of value, create alternatives, evaluate alternatives, identify risks, and provide insights and recommendations to system DMs and other SHs.
The focus of this chapter is on the use of decision analysis for systems engineering trade-off analysis techniques for both systems and system of systems. We propose that trade-off studies be based on a formal lexicon, a sound mathematical foundation, supported by credible data from DMs, SHs, and SMEs. We provide such a lexicon and a formal foundation based on decision analysis for effective and efficient trade-off studies. Our approach supplements decision analysis, a central part of decision-based design (Hazelrigg, 1998), with Value-Focused Thinking (Keeney, 1992) within a model-based engineering rubric (Madni & Sievers, 2016).
The proposed framework also accommodates trade-offs that vary with context (Madni & Freedy, 1981) (Madni et al., 1982). At the outset, we also note that System of Systems (SoS) trade-offs are complicated by the fact that different systems have different governances and systems can often enter and exit the SoS constellation based on mission requirements (Madni & Sievers, 2013). This means that context is continually changing and, therefore, trade-offs have to be revisited when the context changes (Madni & Freedy, 1981). These changes in context have a fundamental impact on system concept and architectural trade-offs.
2.2 Trade-Off Analysis Terms
In this section, we provide a brief definition and some examples of the key terms that we will use in this book. Table 2.1 provides a list of the key terms and examples from oil and gas, aerospace, Air Force, and Army domains. A decision opportunity is a potential activity that we consider expending resources to achieve organizational objectives. A concept focuses on the system need, purpose, functions, and operations prior to defining the architecture and the design. An architecture comprises the fundamental concepts or properties of a system in its environment embodied in its elements, relationships, and in the principles of its design and evolution. A system design defines the architecture, system elements, interfaces, and other characteristics of the system (ISO/IEC/IEEE, 2015). The objectives identify the goals of the stakeholders for the system. The value measures identify how the organization can measure the potential achievement of the objectives at the time of the decision to pursue the decision opportunity.
Table 2.1 Key Terms with Examples
| Terms | Oil and Gas | Aerospace | Air Force | Army |
| Decision opportunity | Develop energy resources | Design and manufacture of a commercial aircraft | Provide air superiority to achieve national security objectives | Provide intelligence support to ground forces |
| Concept | Deepwater project in the Gulf of Mexico | Long-range, mid-size jetliner | Manned stealth fighter | Portable unmanned aircraft system |
| Architecture | Topside and semisubmersible technology | Wide-body, twin-engine jet airliner | Supersonic speed, agility, and integrated sensors | Hand-launched and controlled unmanned aircraft system |
| Design | Jack/St. Malo Project Design | The Boeing 787 Dreamliner | Lockheed F-35 | RQ-11A/B Raven |
| Objectives (illustrative) | Maximize shareholder value, maximize safety, and minimize impact on environment | Maximize shareholder value, increase fuel efficiency, and increase humidity | Maximize air superiority, improve affordability, replace several aging airframes | Maximize loiter time, maximize range, and maximize probability of threat detection |
| Value measures (illustrative) | Profit, reliability, number of hazards, and probability of spill | Profit, fuel efficiency, and humidity | Radar cross section, probability of kill against specific future threat, and life cycle cost | Loiter time, range, and probability of threat detection |
2.3 Influence Diagram of the Tradespace
Defining the decision opportunity is the most important step in any trade-off analysis and determines the boundary for the analysis. The systems engineering decision process, similarly to every decision process, starts with an understanding of the problem or opportunity.1 This is referred to as the following:
- Framing and Tailoring the Decision in the Decision Management Process in the Systems Engineering Body of Knowledge (Systems Engineering Body of Knowledge)
- Problem Definition in the Systems Decision Process (Parnell et al., 2011)
- Decision Framing (Parnell et al., 2013) in the decision analysis literature.
Chapter 6 describes the best practices for defining the decision opportunity.
A common term in trade-off analysis is the tradespace. The tradespace is a multidimensional space that defines the context for the decision, defines bounds to the region of interest, and enables Pareto optimal solutions for complex, multiple stakeholder decisions. The tradespace can be described in many dimensions including the requirements, decisions, system performance measures, value, or utility.
Influence diagrams, a decision analysis technique (Buede, 1994; Buede, 2000), have been used for trade-off analysis. These diagrams are used to show the important decisions, uncertainties, and values (Parnell et al., 2013). We use an influence diagram to provide a conceptual framework and an integrated model for trade-off analysis. Figure 2.1 provides an influence diagram that identifies the tradespace concepts discussed in this chapter along with their primary relationships. This influence diagram is used in Chapter 9 to provide an illustrative example of a trade-off analysis. In specific studies, some of these nodes may not be used and others may be added. In early stages of the life cycle, more nodes will be decisions and uncertainties. In later stages, some of the nodes will be known and considered to be constants.
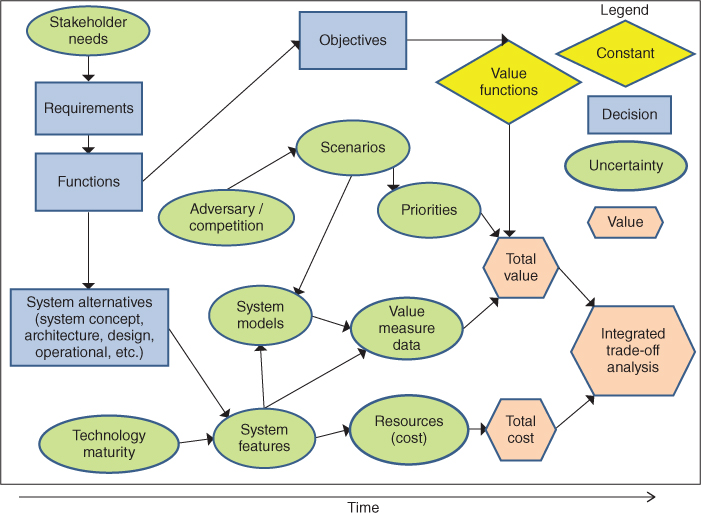
Figure 2.1 Overview of integrated trade-off value, cost, and risk analysis
In the next few sections, we briefly describe each node in the influence diagram and present the use of decision analysis as a mathematical foundation for trade-off analysis. First, we discuss the stakeholder needs, functions, and requirements. Second, we discuss the stakeholder objectives for the system in the decision opportunity. Third, we describe the decision alternatives to meet the objectives. We emphasize the concepts, architectures, designs, and other system alternatives. Fourth, we discuss the major uncertainties inherent in the scenarios, including adversary/competitor behavior. Fifth, we discuss the evaluation of alternatives using value measures, value functions, and utility functions (not shown in Figure 2.1). Sixth, we discuss the important resource issues for trade-off analysis. Seventh, we discuss our proposed framework for integrated trade-off analyses, that is, trade-off analyses that can be used to identify value, cost, and risks as opposed to separate and disconnected analyses.
2.3.1 Stakeholder Needs, System Functions, and Requirements
For systems decision-making, the mission analysis includes stakeholder needs analysis, functional analysis, and requirements analysis to identify the stakeholder needs, functions that the system must perform to create value, the requirements that must be met, and the interfaces with other systems. The results of this analysis available in the life cycle stage are important inputs to any trade-off analysis. Of course, in trade-off analysis, the affordability of any need, function, or requirement may be part of the trade-off analysis.
2.3.2 Objectives
As noted earlier, the fundamental purpose of a system is to create value for its stakeholders (Madni et al., 1985; Madni, 2015). One of the key principles of Value-Focused Thinking is to begin with objectives (Madni, 2013) before developing alternatives (e.g., system concepts, architectures, system designs) (Keeney, 1992). Beginning with alternatives runs the risk of missing actual, important objectives from key stakeholders (Madni et al., 1985). It is important to define the value in terms that are understandable by all DMs, SHs, and SMEs. Decision analysts typically use a value hierarchy (also called a value tree or an objectives hierarchy) to structure the objectives and to identify value measures to assess how well alternatives might achieve our objectives (Keeney, 1992). The value hierarchy has at least three levels: the decision purpose; the objectives that define value; and the value measures for each objective to assess potential value.
We use the term objectives to include goals, criteria, and other similar terms used in the literature. An objective is specified by a verb followed by an object (noun). Common objectives include “maximize profit,” “maximize performance,” “minimize time,” and “minimize cost.”
The identification of objectives is challenging for a new system that is expected to be in service for many years and survive the actions of competition/adversaries. Again, the systems engineering (Parnell et al., 2011; Madni, 2015) and decision analysis literature (Keeney, 1992; Parnell et al., 2013) offer useful techniques for engaging DMs, SHs, and SMEs using research, interviews, focus groups, and surveys to identify potential objectives and then structure them in value hierarchies and functional value hierarchies. These are described in Chapter 7.
It is important to remember that the objectives are developed based on the decision opportunity, NOT the decision alternatives. The objectives need to be independent of decision alternatives. This allows evaluation of very different alternatives using the same model. Also, the objectives should be fundamental objectives (i.e., what we care about) and not means objectives (i.e., how we achieve a fundamental objective). A fundamental objective for a small Unmanned Air Vehicle might be to “maximize detection range.” Detection range is important because a soldier would want advance warning of threats. A means objective would be to “maximize use of composite materials in the airframe.” The use of composite materials is a means to reduce weight, which in turn can increase the range.
For systems engineering applications, we have found the functional value hierarchy to be a useful technique for systems of systems and complex systems that perform multiple functions (Parnell et al., 2011). The functional value hierarchy has four levels: the system purpose; the necessary and sufficient functions and their interactions required to meet the system purpose; the objectives for each function that define value; and the value measures for each objective to assess the potential value.
2.3.3 System Alternatives
Developing alternatives that span the decision space (sometimes called tradespace generation) is one of the most important, and sometimes overlooked, tasks in systems engineering trade-off analyses. The decision tradespace is much more than the baseline or the baseline and two ad hoc alternatives. The decision space needs to be as large as possible to offer the most potential to create value. Since extraneous system constraints and requirements reduce the decision tradespace, it is important to identify and remove them to the extent possible.
Systems engineering and decision analysis provide useful techniques for defining a large decision tradespace and identifying creative, feasible initial alternatives for analysis that span the tradespace (Madni et al., 1985; Madni, 2013). One important technique has been called Zwicky's morphological box, the alternative generation table (Parnell et al., 2011), and, in decision analysis, the strategy table (Parnell et al., 2013). Typically, the choices within each column range from the very conservative (mild) to the very innovative (wild). A decision alternative is defined by making different choices from each of the columns of the table. Certain combinations of choices are infeasible. In other cases, making a choice in one column necessitates the making of a certain choice in another column. It is critical to remember that these are only the initial alternatives. An important purpose of the trade-off analysis is to identify higher value, more affordable, and lower risk alternatives after we learn from the development of our model and our analysis. In that sense, the selection and evaluation of the initial alternatives is primarily an information-gathering exercise intended to discover which aspects of the different alternatives create the most value, which features drive the cost, and which features introduce the most risk. This makes it important to select alternatives that allow the project team to explore as much of the tradespace as possible. Chapter 8 provides a review of the techniques for alternative generation.
In this chapter, we define decision alternatives that depend on the system life cycle. For example, early in the life cycle, we need to decide which concept to pursue. Concept tradespace includes all the possible system concepts that could reasonably be considered to perform the system functions in the time horizon of the study. The next step is to consider alternative architectures. Later in the life cycle, the architecture is selected and alternative design decisions considered. We may select an existing system, modify an existing system, or design a new system. However, in the early stages of the life cycle, the majority of important decisions are made that determine a large percentage of the system capabilities and cost. In general, we can use the variable y to identify a decision alternative at any stage in the life cycle. Chapters 10–14 provide the unique features and illustrative example of trade-off analysis by life cycle stage.
It is important to note that a trade-off analysis might include multiple spaces. For example, the trade-off analysis might include exploring multiple architectures for each concept. See Chapter 8 for an illustrative example.
2.3.3.1 Concept Tradespace
The system concept significantly impacts the potential system value, schedule, risks, and life cycle costs. For example, a small unmanned aircraft system can be developed quicker and at a significantly lower cost than a manned fighter aircraft. While it will have less risk, it will also have fewer capabilities. Consequently, it is imperative to explore system concepts in early trade-off analyses.
We use the index c = 1, …, C to indicate candidate system concepts. After exploring various system concepts, one system concept, c, is selected.
- yc is the cth alternative of system concept c.
2.3.3.2 Architecture Tradespace
Architecture is the fundamental organization of a system embodied in its components, their interdependencies and relationships to each other, and to the environment, and the principles that guide its design and evolution (ISO/IEC 15288, 2015). The best practice is to consider alternative architectures.
We use the index a = 1,…, A to indicate candidate system architectures. Once architecture evaluation is completed, a particular architecture, a, for system concept c is selected.
- yca is the ath alternative architecture of system concept c.
2.3.3.3 Design Tradespace
We use the index d = 1, …, D to indicate candidate system designs. Once the system design evaluation is completed, there is one system design for architecture a of system concept c. During the design phase, the selection of system concept c and architecture a significantly reduces the size of the decision tradespace.
- ycad is the dth design for architecture a of system concept c.
2.3.3.4 Other Decision Alternatives in Later Life Cycle Stages
While the system concept, system architecture, and system design trade-off analyses are arguably the most critical, systems engineers conduct trade-off analyses throughout the system life cycle. Examples might include the following: testing, manufacturing, deployment, operations, maintenance, and system retirement alternatives. The trade-off studies assume concept c, architecture a, and design d. In general, the variable y can be used to identify a decision alternative at any stage in the life cycle. We remove the indices c, a, and d and use the following instead:
- yj, j = 1, …, m is the alternative index, where m is the number of alternatives.
2.3.4 Uncertainty
Surprisingly, many trade-off studies do not consider uncertainty or consider uncertainty in only one objective, for example, cost. But considering uncertainty is especially important when systems development includes the consideration of new technologies whose cost, schedule, and value are poorly understood. In addition, system developers will typically be uncertain of all the circumstances under which users might employ the system.
There are many sources of uncertainty in systems design and operation that should be considered in trade-off analyses. The uncertainties include independent uncertainties (e.g., what scenario will the system be used in, how well will a technology work, what will be the cost of a new component) and dependent uncertainties (e.g., system value, cost, and schedule) that depend on the independent uncertainties. In general, there is greater independent and dependent variable uncertainty in the earlier stages in the system life cycle. As the life cycle progresses, the uncertainties are reduced (Keisler & Bordley, 2014). Some of the major uncertainties include the following:
- Technology maturity. One of the major challenges for system development is technology maturity. These uncertainties can directly impact value, cost, and schedule.
- Requirements. In the early life cycle stages, the requirements are preliminary or not yet defined. Requirements can have a major impact on design features, cost, and schedule.
- Design features. Many system concepts and architectures have design feature requirements, for example, two engines, and goals, for example, UAV weight. Depending on the requirements imposed on the system and design decisions, there is uncertainty about the final design features.
- Adversaries. In security applications, we should consider the potential actions of our adversaries over time.
- Competition. In commercial applications, we should consider the potential actions of our competition.
- Scenarios. Scenarios define when, where, how, and how long a system will be used and the capabilities of the adversary/competition. When and where the system is used determines the physical environment of system operation. Many systems are designed for one or more scenarios. However, since system lifetimes are very long, systems are modified to be used for other scenarios and changing adversary/competition capabilities.
- System performance. The system performance is uncertain. It depends on the technology maturity, design features, adversary/competition, and scenarios.
- Value. Value uncertainty is a function of the problem uncertainties and their interactions. Models can be used to propagate the uncertainty in the independent variables to the value model.
- Schedule. It is well known that system development also offers significant schedule uncertainty.
- Cost. It is also well known that system development offers significant cost uncertainty. The best practice for cost analysis is to develop a life cycle cost analysis and to perform Monte Carlo simulation by assigning probability distributions to the independent variables.
2.3.5 Preferences and Evaluation of Alternatives
Once the tradespace has been generated, we need to explore the tradespace. Using decision analysis, we use our preferences to evaluate alternatives and guide the exploration. In performing an evaluation of alternatives, the preferences of the DMs and SHs are used implicitly or explicitly. The mere identification of value measures is a statement of preferences. For example, if miles per gallon is used as a value measure of a vehicle, maximize fuel efficiency (a natural measure) could be the objective, or a proxy measure for minimizing the impact on the environment could be used. Many times value measures are developed in an ad hoc fashion. Instead, the value measures should be derived from the objective identification and structuring described in Section 2.2.2. If SHs identify a value measure not linked to the objectives, it may well be that there is a missing objective.
A key aspect of preferences and evaluation of alternatives is mathematical scales. There are three types of mathematical scales that can be employed in alternative evaluation. The first is an ordinal scale. In an ordinal scale, we define a preference ordering without defining the strength of preference. Consider, for example, a five-point ordinal scale, 1, 2, 3, 4, and 5 in increasing preference. All that can be said is that 5 > 4 > 3 > 2 > 1. Actually, the use of numbers in an ordinal scale is deceptive and should be avoided. It is preferable to use a, b, c, d, and e. Thus, the ordinal preferences could be e > d > c > b > a. The second is an interval scale. An interval scale provides the strength of preference but does not define an absolute zero. Common examples of an interval scale are the temperature scales of Celsius and Fahrenheit. The third scale is a ratio scale. A ratio scale provides both strength of preference and an absolute zero. The ratio scale for temperature is Kelvin. The type of scale defines the mathematical operations that can be performed. With an interval scale, a positive affine transformation can be used (e.g., we can transform an interval scale from 2–12 to 0–100 by subtracting 2 and multiplying by 10). With a ratio scale, only multiplication by any positive transformation is possible.
Since value measures require an interval or ratio scale (see next section), it is useful to note that an ordinal ranking can be converted to an interval or a ratio scale by performing a value assessment or other techniques. For example, Barron & Barrett (1996) suggest using the rank-ordered centroid technique to construct a ratio scale using only the information in an ordinal scale. With n alternatives, rank-order centroid assigns the following:
- The lowest ranked (or nth highest ranked) alternative, a score proportional to (1/n)
- The (n − 1) highest ranked alternative, a score proportional to (1/n) + 1/(n − 1)
- …
- The top-ranked alternative, a score proportional to (1/n) + 1/(n − 1) + … + 1.
Scores are then normalized to sum to 1. While there are other methods for estimating ratio scales from ordinal scales, empirical evidence suggests that this method is more consistent with the ratio scores that individuals would actually assign to alternatives (if they were asked).
2.3.5.1 Value Measures
There are several terms used in the literature as synonyms for measures. Some common terms include value measures, performance measures, attributes, figures of merit, effectiveness measures, and metrics. This chapter uses value measures to include all measures used to assess the objectives of interest to the DMs and SHs. Value measures assess how well an alternative achieves an objective that we care about. If all potential outcomes can be converted into dollars, we can use dollars as our measure of value. If not, we can use multiple value measures. Example value measures are profit, range, probability of detection, reliability, safety, sustainability, maintainability, cost, schedule, and safety. An alternative's scores on a value measure for an objective may be deterministic or uncertain.
We use the following notation for value measures:
- i = index of system value measure, 1, …, n
- xji = alternative j's score in the ith value measure
- xj = vector of the scores of each alternative j on all n value measures.
Systems engineering trade-off studies can be conducted using value measures. However, these tend to be two or three value measures at a time. To make decisions based on value measures requires the decision-makers to make judgments about preferences for a level of one value measure compared to the levels of the other value measures. This assumes that the DMs and SHs understand the nuances of the scales being used and the ranges of each value measure. For example, comparing an ordinal scale with an interval and ratio scale would be cognitively challenging. In addition, changing the range of a value measure can make significant visual differences in the trade-off charts.
To increase the number of value measures being considered and to make the preference judgments more explicit, decision analyst and systems engineers can employ the value model for trade-off analyses.
2.3.5.2 Value Models
Value can be single-dimensional (e.g., dollars) or multidimensional using many value measures derived from the objectives. For single-dimensional values such as dollars, it is possible to calculate the net present value using a discount rate to normalize dollars to a standard year.
The majority of the trade-off analysis literature use multiple objectives –sometimes called multiattribute value or multiattribute utility. Multiobjective decision analysis (MODA) defines value as the normalized returns to scale on a value measure (Kirkwood, 1997).
For multidimensional value, two kinds of value dimensions need to be distinguished:
- Screening dimensions: Screening is used to eliminate alternatives. Screening reduces the decision tradespace and needs to be used very carefully. The screening criteria (requirements) can be applied simultaneously or sequentially. If the screening criteria are applied simultaneously, the alternatives that do not meet the criteria are eliminated. One sequential screening approach would be to rank screening criteria from highest to lowest importance. In deciding between alternatives, only those alternatives that are good enough under the most important screening criteria need to be considered. For example, when buying a car, the sequential screening criteria are off-road vehicles and 25 miles per gallon and in that order. Thus, the steps are to first find the off-road vehicles and then find the one that had greater than or equal to 25 mpg. (If alternatives provide roughly the same value of the most important value measure, then we make the choice based on the next most important screening dimension.)
- “Tradable” dimensions: These are dimensions that act in trade-off fashion. Once all screening dimensions are satisfied, attention shifts to other dimensions to balance improvement on one against improvements on the others. For example, a little performance may be sacrificed to achieve increased affordability, and a little affordability can be sacrificed to achieve an increase in performance. If this is the case, then affordability and performance are tradable dimensions. It is important to realize that the tradable dimensions can also have screening criteria. For example, there may be a minimum level of performance that is required.
For tradable dimensions, the most common multidimensional value model is the additive value model (Keeney & Raiffa, 1976). Many other value model forms exist (Kirkwood, 1997), but they are most complex and require more time for DMs and SHs to assess preference and are more difficult to interpret. The additive value model requires mutual preferential independence (Kirkwood, 1997). In simple terms, mutual preferential independence means that our preferences for one value measure do not depend on the scores on other value measures. From important theoretical findings, we know that only n − 1 questions need to be asked to ensure that this requirement is met. In practice, this requirement is met by constructing the value measures to be collectively exhaustive and mutually exclusive. For example, both reliability and availability would not be used because reliability is included in the calculation of availability. In addition, preferential dependence can be avoided by combining two preferential dependent value measures into one new value measure. (It is important to note that preferential independence has nothing to do with probabilistic independence, which is discussed in Chapter 3.)
The additive value model uses Equations 2.1 and 2.2. A single-dimensional value function, vi(xi), can be developed for each value measure. Each single-dimensional value function can be normalized and then weighted by each contribution, wi. The total value is the weighted sum of the single-dimensional value.
where
- i = index of the value measures, 1, …, n
- j = index of the alternatives, 1, …, m
- v(xj) = the multidimensional value of value measure i
- xji = alternative's score in the ith value measure
- vi(xji) = normalized single-dimensional value of the score of xji
- wi = normalized swing weight of ith value measure
To obtain a precise mathematical meaning for v(xj), appropriate scales must be used for the single-dimensional value functions and the swing weights. The additive value model places requirements on the two scales. Each single-dimensional value function must use an interval or a ratio scale. In practice, interval scales are usually used for the practical reason that if a ratio scale did exist, it would usually result in a much larger scale than required for the trade-off study. This would result in unused value tradespace. It is important to note that swing weights must use a ratio scale, and zero weight means no value.
It is also important to note that neither the value functions vi nor the weights wi depend on the alternatives. Therefore, a value model is useful when comparing significantly different system concepts, architectures, designs, and alternatives in any life cycle stage.
The six most common single-dimensional value functions are shown in Figure 2.2. The four curve shapes are linear returns to scale, decreasing returns to scale (concave), increasing returns to scale (convex), and the S-curve. In all of the functions, xi0 is the minimum acceptable score on the value measure and xi* is the ideal. The minimum and maximum scores should be determined based on the decision opportunity and the time horizon of the system development.
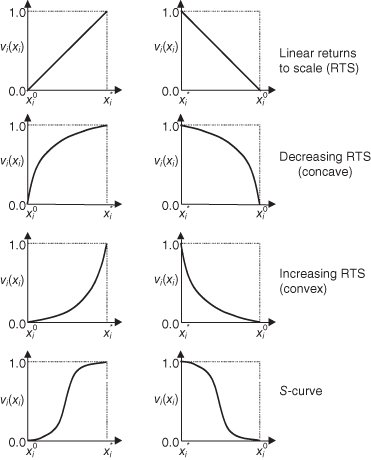
Figure 2.2 Single-dimensional value functions
Since interval scales are used for the value functions and ratio scales for the swing weights, a precise mathematical measure can be defined and associated with a multidimensional alternative value. Value has a very clear meaning relative to trade-off analyses. If the value range is 0−10, a hypothetical alternative with the minimum acceptable score on each measure has a value of 0 and a hypothetical alternative with the ideal score on each measure has a value of 10. The additive value model defines the n-dimensional tradespace. Therefore, a value of 7.5 means that the alternative achieves 75% of the weighted multidimensional value between a hypothetical minimum acceptable alternative and the ideal alternative. This interpretation is a very useful way to communicate value and explain the trade-offs to DMs and SHs. Other approaches to multiattribute value analysis have been developed using relative scoring instead of value functions (Buede & Choisser, 1992).
One of the most common and critical mistakes in trade-off studies is using importance weights instead of swing weights (Parnell et al., 2014). MODA quantitatively assesses the trade-offs between conflicting objectives by evaluating the alternative's contribution to the value measures (a score converted to value by single-dimensional value functions) and the importance of each value measure across the range of variation of the value measure (the swing weight). Every decision analysis book identifies this as a major problem. For example, “some experimentation with different ranges will quickly show that it is possible to change the rankings of the alternatives by changing the range that is used for each evaluation measure. This does not seem reasonable. The solution is to use swing weights” (Kirkwood, 1997). Swing weights play a key role in the additive value model in Equation 2.1. The swing weights depend on the measure scales' importance and range. The word “swing” refers to varying the range of the value measure from its minimum acceptable level to its ideal level. If all other measure ranges are held constant and the range of one of the measure scales is reduced, then the measure's relative swing weight decreases, and the swing weight assigned to the others increases since the weights have to sum to 1.0.
Not using swing weights can have dramatic consequences on the credibility of the trade-off study. Parnell et al. (2014) were asked to consult on an Analysis of Alternatives performed on an Army ground vehicle. The analysts had used importance weights and assessed the weights top-down. There were five criteria at the top of the hierarchy, each was assessed an importance weight of about 0.20. Mission and reliability were two of the top-level objectives. One of the four mission's objective measures was vehicle operator safety. Using top-down importance weights, the analysts assessed that passenger safety had a weight of 0.04 and reliability a weight of 0.20. The weights and the results of the study were dismissed by senior reviewers since the primary purpose of the new vehicle was to improve the vehicle operator safety (large difference between the current capability and the desired capability) and the reliability was a secondary factor (small difference between the current capability and the desired capability). When the analysis was redone using the swing weight matrix (Parnell et al., 2011), passenger safety was assessed the highest weight (about 0.25) and reliability a weight of 0.05. With the new swing weights, the client was able to successfully complete their trade-off study. The use of swing weights made a significant change in the credibility of the study and in the alternative rankings.
The swing weight matrix technique is one of many good “direct elicitation” approaches for eliciting ratio scale weights. There are also indirect elicitation techniques focused on inferring weights from choices individuals make in hypothetical settings. These techniques, called conjoint analysis, have been widely used in marketing and involve the following:
- Presenting an individual with a hypothetical choices
- Observing the individual's actual choice
- Defining a new set of hypothetical choices – designed to gather as much relevant information as possible based on what the past choices have revealed about the individual
- Repeat steps 2 and 3 until sufficient information is gathered about the individual's weights.
An advantage of indirect methods over direct methods is that they ask experts simpler questions and can sometimes be fielded as surveys. The disadvantage is that they require many more questions, which can fatigue respondents (and lead to inaccurate responses.)
These are only two of many techniques being used in decision analysis. Hybrids of direct and indirect elicitation are also possible. Proposed assessment techniques must be evaluated based on their logical defensibility as well as whether empirical evidence shows that they faithfully reflect the priorities of the DMs. In addition, the method has to be easy enough so that clients continue to use it and transparent enough to convince them that the results are credible.
2.3.5.3 Utility Models
Utility can be used in place of value in Figure 2.1. Utility considers the decision-maker's preferences for the value of the outcome and the probability of the outcome. As decision-based design (Hazelrigg, 1998) emphasizes, consistent decision-making (in the sense of satisfying the von Neumann–Morgenstern axioms (von Neuman & Morganstern, 1953) ) requires that the selected decision have the highest utility score. The value defined in the previous section is a special case of utility – a risk-neutral decision-maker. Alternatively, a decision-maker using axiomatic design would specify utility to be the probability of satisfying all functional requirements. This is an example of a target-oriented utility (Castagnoli and LiCalzi, 1996; Bordley & Li Calzi, 2000).
Standard safety system methods for assessing failure risk can be used to decompose the probability of meeting functional requirements into the probability of satisfying detailed requirements. As Bordley and Kirkwood (2004) showed, the resulting decomposed probability will be consistent with the classic multiattribute utility (Keeney and Raiffa, 1976) in decision theory with the attributes being the dimensions described by the detailed requirements. But satisfying requirements, instead of being the end goal, is often a means of satisfying customer objectives – with there being some uncertainty about whether meeting requirements satisfies stakeholder objectives. To extend target-oriented utility to this case, utility could be defined as the probability of meeting stakeholder objectives.
But this is only straightforward as long as there is an unambiguous definition of what it means to satisfy stakeholder objectives. When there are varying degrees to which stakeholders can be satisfied (when they are not either satisfied or dissatisfied), developing such an unambiguous definition may be difficult. In such cases, utility can still be treated as simply a measure of returns to scale and risk preference (Kirkwood, 1997).
The three types of risk preference are risk-neutral, risk-averse, and risk-seeking. Value is appropriate for a risk-neutral decision-maker. Utility functions have been defined for single and multiple objectives (Keeney & Raiffa, 1976). For example, for a tradespace exploration using utility and uncertainty, see (Ross & Hastings, 2005). The trade-off analysis literature shows a very limited use of utility functions (using the decision analysis definition of utility). There are several reasons that can explain this finding.
- Many systems engineers and decision-makers believe that a risk-neutral preference is most appropriate for large organizations making a large number of decisions.
- The cumulative probability distribution of value can be used to assess deterministic and stochastic dominance (Clemen & Reilly, 2001).
- Some systems engineers may not know the difference between value and utility.
- Many decision-makers and stakeholders involved in the system decision may have very different risk preferences. For very good reasons, the project manager may be risk-adverse, but the director of R&D may be risk-neutral or even risk-seeking for some projects.
- Assessing risk preference is challenging and time-consuming. This is especially true when we have several single-dimensional utility functions and multiple DMs and SHs with conflicting risk preferences.
Based on the first two reasons, we use value instead of utility in Figure 2.1. We will define risk as the probability of obtaining a low value, and we will use the cumulative probability distribution of value to assess deterministic and stochastic dominance. See Chapters 5, 9, and 13 for examples.
2.3.6 Resource Analysis
Affordability is a major concern for most systems. Systems engineering trade-off analyses need to consider finite resources. Minimizing resources required for a system is usually an objective. The primary resource is financial (cost). However, other resources including manpower and facilities must be included. The best practice for cost analysis is to develop a life cycle cost analysis model that converts the operations concept and the features of the system under consideration to life cycle cost.
It is useful to note that mathematically cost could be one of the measures in the additive value model. However, many decision-makers prefer to visually see the value for the cost. In DoD, the policy of Cost as an Independent Variable (CAIV) and affordability analysis requires the separation of cost from value. The chart with value plotted on the vertical dimension and cost along the horizontal dimension becomes a particularly useful way to think about the value added of alternatives and is an essential tool for affordability analysis.
2.3.7 An Integrated Trade-Off Analyses
Many trade-off studies do not provide an integrated assessment of value, cost, and risk (Parnell et al., 2014). Figure 2.1 illustrates how an influence diagram is used to model the relationships between decisions, uncertainties, and value and provide an integrated trade-off analysis model. The influence diagram was selected as the preferred representation because it offers a probabilistic decision analysis model that identifies the major variables and their dependencies.
We can now provide a more precise discussion of Figure 2.1. Several important features of this influence diagram model are as follows:
- The decisions include the functions, objectives, requirements, and system decision alternatives. Adding the functions, objectives, and requirements as decisions is very important, especially in the concept, architecting, and design decisions. In later life cycle stages, the functions, objectives, and requirements may be constants.
- There are several major uncertainties: stakeholder needs, scenarios, adversary actions, competition actions, technology maturity, system features, system models, value measure data, priorities, and resources. In general, the priorities depend on the scenario. The scenarios will depend on the objectives and the adversary actions.
- The influence diagram assumes a multiple objective model using the additive value model. The value can be calculated based on decision, the value measure data, the value functions, and the priorities (swing weights) using the additive value model. If all objectives can be monetized, we would delete the priorities (swing weight) node and add a constant node for the discount rate. The single value would be Net Present Value. Similarly, if we want to model the risk preference other than risk neutral, we could replace value by utility.
- If the stakeholders are willing to agree on a set of priorities, the priorities would be constant. Another approach is to have multiple priority sets for different stakeholder groups and/or different scenarios. This approach allows the identification of alternatives preferred by different stakeholders and alternatives preferred for different scenarios. The value measure scores would depend on the scenario, the competitor's actions, and the outputs of system models and simulations. The design features are uncertain until the later life cycle stages. The resources (cost) will depend on the system features. If the system value is higher, fewer systems may be needed.
- The value functions are modeled as constant for the decision opportunity, objectives, and requirements. As the decision opportunity, objectives and requirements change, and the value functions change. See, for example, Ross et al. (2015).
- The primary tradespace is between value and cost. The analysis can be deterministic or probabilistic. Risk can be value or cost risk. The decision tradespace can be explored by optimization, experimental design, or designing creative decisions that span the decision space.
- In probabilistic analysis, probability distributions can be assigned to the uncertain independent variables. The uncertainty is then propagated through system models and the value model by Monte Carlo simulation. The decision space can be explored by optimization, simulation optimization, experimental design, or designing creative decisions that span the space. After the probabilistic integrated value and cost analyses are performed, the value and risk drivers can be analytically identified using tornado diagrams (Clemen & Reilly, 2001).
A framework to implement integrated trade-off analyses has been added to the Systems Engineering Body of Knowledge (Decision Management). For an illustration of this integrated framework, see Chapters 5 and 9, and (MacCalman & Parnell, 2016).
2.4 Tradespace Exploration
In this chapter, we advocate the use of value (or utility) to evaluate each alternative in the decision space. However, we do not advocate the use of decision analysis as the only technique to explore the tradespace. For complex systems and system of systems, value measure scores may come from operational data, test data, simulations, models, or expert opinion. In addition, tradespace exploration requires the tailored use of other mathematical techniques in conjunction with decision analysis including optimization, simulation optimization, and simulation with design of experiments.
Optimization (Bordley & Pollock, 2009, 2012) is an analytical technique to explore the decision tradespace. This technique can be very effective and efficient. However, it requires the model be able to mathematically express the objective, the essential relationships, and the constraints. Optimization provides the one best alternative unless there are alternative optimal solutions. Additional analysis is required to provide information about nearly optimal alternatives that may be of interest to the decision-makers.
Another important tradespace exploration technique is to perform an experimental design using models (Bordley & Bier, 2009) and simulations (Parnell et al., 2011). The statistical method of design of experiments is a widely used technique in all areas of science to help understand complex behavior. These experiments allow systems engineers to efficiently explore design spaces to identify features that have the most impact on the desired system behavior.
Chapter 8 presents and compares several techniques for defining and exploring the tradespace. Chapter 9–14 provides illustrative examples of the techniques our authors have found to be the most useful in each stage of the life cycle.
2.5 Summary
This chapter has four themes. The first is a standard terminology to discuss trade-off analyses. The second is the use of decision analysis as the mathematical foundation for trade-off analysis. The third is the use of integrated trade-off analysis to identify value, cost, and risk based on a probabilistic decision analysis with a value and cost model developed for trade-off analyses. The fourth is the use of tradespace exploration techniques combined with decision analysis.
Systems are designed to last decades, and system development involves many uncertainties. However, many trade-off analyses are deterministic and do not consider the risk and opportunities provided by uncertainty. The integrated framework for value and risk analysis is an important step to value risks and opportunities and to provide a sound foundation for risk analysis. The framework will need to be tailored to the opportunity, system, life cycle stage, and decision-makers.
It is well known that trade-off analyses are very important in systems development but are not consistently well done. We believe that a major contributor is the lack of a standard lexicon and a sound mathematical foundation. The proposed lexicon offers the opportunity to provide a terminology that is mathematically sound and has been proven effective in many important systems engineering trade-off analyses.
Decision analysis has a successful track record for providing insights to decision-amakers and stakeholders in public and private organizations. Decision analysis is the mathematical foundation for the INCOSE SE Handbook Decision Management section and the Systems Engineering Body of Knowledge Decision Management Section.
The purpose of a system (or a system of systems) is to provide value in the form of capabilities and services to clients, operators, and owners. Decision-making is central to value identification and value realization. Trade-off analyses, a fundamental systems engineering technique, inform system decisions throughout the system life cycle. Systems engineering is a trade-off rich field. Trade-off analysis at present is performed in somewhat ad hoc fashion. This chapter presents an integrated trade-off analysis approach grounded in decision sciences. The same analysis can identify the value and risk drivers. The approach employs a clear lexicon and a sound mathematical foundation for trade-off analyses. The integrated model for trade-off analyses presented in this chapter considers the decisions, the uncertainties, and the values of decision-makers. Both systems and system-of-systems issues are addressed in this chapter.
2.6 Key Words
- Architecture: The fundamental concepts or properties of a system in its environment embodied in its elements, relationships, and in the principles of its design and evolution.
- Concept: A concept focuses on the system need, purpose, functions, and operations prior to defining the architecture and the design.
- Design: A design defines the architecture, system elements, interfaces, and other characteristics of the system (ISO/IEC/IEEE, 2015).
- Decision: A choice among alternatives that results in an allocation of resources.
- Decision Opportunity: Potential activity that we consider expending resources on to achieve organizational objectives.
- Influence Diagram: An influence diagram is a compact graphical representation of a decision opportunity that identifies the decisions, uncertainties, and value and shows their relationships.
- Objectives: The goals of the stakeholders for the system. Objectives are defined by a verb and an object.
- Risk: A potential and undesirable deviation of an outcome from some anticipated value.
- Tradespace: A multidimensional space that defines the context for the decision, defines bounds to the region of interest, and enables Pareto optimal solutions for complex, multiple stakeholder decisions.
- Uncertainty: Imperfect knowledge of the value of some variable.
- Value Function: Returns to scale on a value measure.
- Value Measure: Identifies how the organization can measure the potential achievement of the objectives at the time of the decision.
- Utility Function: Returns to scale and risk preference on a value measure.
2.7 Exercises
- 2.1 Consider Table 2.1 and a problem domain of interest to you. Develop a similar table for the following:
- a. Two existing systems
- b. One system in development
- c. One future system.
- 2.2 This book uses decision analysis as the mathematical foundation for quantifying the tradespace and performing a trade-off analysis. (Alternative approaches for evaluating alternatives are presented in Chapter 8.)
- a. Identify the advantages of this approach.
- b. Identify the disadvantages of this approach.
- 2.3 This chapter advocates an integrated approach to value, cost, and risk analysis. Compare this approach to separate value, cost, and risk analyses.
- a. Identify the advantages of the integrated approach.
- b. Identify the disadvantages of integrated approach.
- 2.4 Find a trade-analysis article in a refereed journal, for example, Systems Engineering. Use the influence diagram in Figure 2.1 as a framework to assess the trade-off analysis.
- a. What decisions were considered in the article?
- b. What uncertainties were considered in the article?
- c. What type of resource analysis was performed?
- d. What preference function was used to evaluate the trade-offs?
- e. Was the risk of the alternatives explicitly considered?
- f. Was the trade-off analysis an integrated analysis?
- 2.5 Consider a trade-off analysis you have performed in the past or will be performing in the future.
- a. Draw an influence diagram for the analysis.
- b. Compare your influence diagram with Figure 2.1. What are the similarities and differences?
References
- Barron, F.H. and Barrett, B.E. (1996) Decision quality using ranked attribute weights. Management Science, 42, 1515–1523.
- Bordley, R. and Bier, V. (2009) Updating beliefs about variables given new information on how those variables relate. European Journal Of Operational Research, 193 (1), 184–194.
- Bordley, R. and Li Calzi, M. (2000) Decision analysis using targets instead of utility functions. Decisions in Economics and Finance, 23, 53–74.
- Bordley, R.F. and Kirkwood, C.W. (2004) Multiattribute preference analysis with performance targets. Operations Research, 52 (6), 823–835.
- Bordley, R. and Pollock, S. (2009) A decision analytic approach to reliability-based design optimization. Operations Research, 57 (5), 1262–1270.
- Bordley, R. and Pollock, S. (2012) Assigning resources and targets to an organization's activities. European Journal of Operational Research, 220 (3), 752–761.
- Buede, D.M. (1994). Engineering design using decision analysis. 1994 IEEE International Conference. 2, (pp. 1868–1873), IEEE, San Antonio.
- Buede, D.M. (2000) The Engineering Design of Systems: Models and Methods, John Wiley & Sons, 2016.
- Buede, D.M. and Choisser, R.W. (1992) Providing an analytic structure for key system design choices. Journal of Multi-criteria Decision Analysis, 1, 17–27.
- Castagnoli, E. and LiCalzi, M. (1996) Expected utility without utility. Games and Economic Behavior, 41 (3), 281–301.
- Clemen, R.T. and Reilly, T. (2001) Making Hard Decisions with Decision Tools, Duxbury Press, Belmont, CA.
- Decision Management (n.d.). Systems Engineering Body of Knowledge: http://www.sebokwiki.org/wiki/Decision_Management (accessed 15 November 2014).
- Hazelrigg, G.A. (1998) A framework for decision-based engineering design. Journal of Mechanical Design, 120 (4), 653–658.
- ISO/IEC (2015) Systems and Software Engineering — System Life Cycle Processes, International Organization for Standardization (ISO)/International Electrotechnical Commission (IEC), Geneva, Switzerland.
- ISO/IEC/IEEE (2015) Systems and Software Engineering — System Life Cycle Processes, International Organization for Standardization (ISO)/International Electrotechnical Commission (IEC)/Institute of Electrical and Electronics Engineers (IEEE), Geneva, Switzerland.
- Keeney, R.L. (1992) Value-Focused Thinking: A Path to Creative Decisionmaking, Harvard University Press, Cambridge, MA.
- Keeney, R.L. and Raiffa, H. (1976) Decisions with Multiple Objectives Preferences and Value Tradeoffs, Wiley & Sons, New York, NY.
- Keisler, J.M. and Bordley, R.F. (2014) Project management decisions with uncertain targets. Decision Analysis, 12 (1), 15–28.
- Kirkwood, C. (1997) Strategic Decision Making: Multiobjective Decision Analysis with Spreadsheets, Duxbury Press, Belmont, CA.
- MacCalman, A. and Parnell, G. (2016). Multiobjective Decision Analysis with Probability Management for Systems Engineering Trade-off Analysis. Hawaii International Conference on System Science - 49.
- Madni, A.M. (2013) Generating novel options during systems architecting: psychological principles, systems thinking, and computer-based aiding. Systems Engineering, 16 (4), 1–9.
- Madni, A.M. (2015) Expanding stakeholder participation in upfront system engineering through storytelling in virtual worlds. Systems Engineering, 18 (1), 16–27.
- Madni, A. M., Brenner, M. A., Mac Gregor, D., and Meshkinpour, F. (1985). Option Generation: Problems, Principles, and Computer-Based Aiding. Proceedings of 1985 IEEE International Conference on Systems, Man, and Cybernetics, (pp. 757–760). Tucson, AZ.
- Madni, A. M. and Freedy, A. (1981). Decision Aids for Airborne Intercept Operations in Advanced Aircrafts. Proceedings of the International Conference on Cybernetics and Society (pp. 224–234). Sponsored by IEEE Systems, Man, and Cybernetics Society.
- Madni, A.M., Samet, M.G., and Freedy, A. (1982) A trainable on-line model of the human operator in information acquisition tasks. IEEE Transactions of Systems, Man, and Cybernetics, 12 (4), 504–511.
- Madni, A.M. and Sievers, M. (2013) System of systems integration: key considerations and challenges. Systems Engineering, 17 (2), 330–347.
- Madni, A.M. and Sievers, M.N. (2016). Model based systems engineering: motivation, current status and needed advances. Systems Engineering, accepted for publication, 2016.
- Parnell, G.S., Bresnick, T.A., Tani, S.N., and Johnson, E.R. (2013) Handbook of Decision Analysis, Wiley & Sons.
- Parnell, G., Cilli, M., and Buede, D. (2014). Tradeoff Study Cascading Mistakes of Omission and Commission. International Council on Systems Engineering (INCOSE) International Symposium. Las Vegas: INCOSE.
- Parnell, G.S., Driscoll, P.J., and Henderson, D.L. (eds) (2011) Decision Making for Systems Engineering and Management, 2nd edn, Wiley & Sons.
- Ross, A. M. and Hastings, D. E. (2005). 11.4. 3 The Tradespace Exploration Paradigm. INCOSE International Symposium, 15.
- Ross, D. H., Rhodes, D. H., and Fitzgerald, M. E. (2015). Interactive Value Model Trading for Resilient Systems Decisions. 13th Conference on Systems Engineering Research. Hoboken, NJ.
- von Neuman, J. and Morganstern, O. (1953) Theory of Games and Economic Behavior, Princeton University Press, Princeton, NJ.