
Chapter 10
Exploring Concept Trade-Offs
Azad M. Madni
Systems Architecting and Engineering and Astronautical Engineering, Viterbi School of Engineering, University of Southern California, Los Angeles, CA, USA
Adam M. Ross
Systems Engineering Advancement Research Initiative (SEAri), Massachusetts Institute of Technology (MIT), Cambridge, MA, USA
There is nothing worse than a sharp image of a fuzzy concept.
Ansel Adams
10.1 Introduction
Systems engineering is undergoing a transformation motivated by both challenges and opportunities. The challenges are posed by increasing system scale and complexity. The opportunities are afforded by advances in computing and communication and social media (Madni, 2015d). Specifically, a major shift is underway that requires systems engineering to go beyond the “how” to the “why.” In particular, systems engineering is going beyond traditional process prescriptions, with checkbox steps, to the creation of a framework that supports decision space definition, expansion, exploration, and explanation. This is a major shift in that today's SE process-driven approach comes with implied assumptions and “shallow” thinking. When things go awry, the process is invariably blamed. In sharp contrast, an “explore and explain” approach seeks to formalize systems engineering while grounding it in theoretical foundations. At the heart of today's thinking about systems engineering is identification of the opportunity space (Chapter 6), definition and expansion of the decision space, and exploration of the tradespace. The intent is on gaining insights, uncovering previously unknown interactions, uncovering constraints, and discussing regions of “good” and “bad” possibilities. This approach develops an appreciation of epistemic and aleatoric (i.e., known and unknown) uncertainties, as well as contingencies and conditions. The explanation aspect communicates insights and articulates the rationale behind decisions. Example insights include determining context-dependence of stakeholder needs; value-driving design decisions; value-limiting constraints and sensitivities to their removal; important risks, impact of multiple stakeholder preferences on cost, performance, and schedule of potential concept solution. Concept trade-off analysis is an essential activity in this transformation.
Concept trade-off analysis is a key activity in the conceptual design phase of systems engineering and is part of the overall systems engineering trade-off analysis process (Madni et al. 2014c). It consists of a set of concepts that need to be traded off against each other to find the best balance among them. The conceptual design phase is characterized by a high degree of uncertainty as customer needs are understood and then incrementally translated into requirements, which are then transformed into system design concepts and associated concepts of operation (CONOPS). Trade-offs performed in this phase are critical to conceptual design decisions. The quality of conceptual design is determined in large part by the importance of the opportunity space, having concept alternatives that span the decision space, the completeness of the concept design variables, and the effective and full exploration of the conceptual design tradespace.
Figure 10.1 illustrates the layered hierarchy relationship between concept, architecture, design, and system representations. Depending on the nature of the system being developed, there may be more than one instance of lower levels of the hierarchy. For example, the concept of an iPhone has more than one set with it over time (e.g., iPhone 3G, 4, 5, and 6). Associated with each architecture are particular design specifications that adhere to that architecture (e.g., the iPhone 4, Black, 16GB), which may allow for multiple design variants within the same architecture. Many individual systems may be manufactured for each specified design. For low production or unique systems, there may be only one architecture, or one design specified (e.g., USS Ronald Reagan aircraft carrier), or even one system developed (e.g., the International Space Station). The specification of the concept constrains the possible architectures, designs, and ultimately the systems that may be produced.

Figure 10.1 Concept, architecture, design, and system abstraction layer examples
Conceptual design is where the mapping of function to form occurs. The resulting allocated architecture, in large part, determines most of the performance, cost, and schedule of subsequent development. The decisions made at this stage are the key determinants of the achievable performance of a system, the costs to produce and operate a system, and the time needed to produce deliver an operational system. The output of conceptual design is a design concept and high-level system specification that are used by preliminary design. The design concept is created and selected from the design tradespace with the intent of minimizing risks of costly downstream changes while simultaneously maximizing value for stakeholders. In this stage, it is important to not prematurely eliminate design alternatives because doing so, intentionally or inadvertently, can result in loss of valuable information that reduces the odds of realizing high-value, robust systems.
Trade-off Space (or Tradespace, for short) is defined by an enumerated set of design variables. When these design variables are assigned different levels, candidate design options are generated. Thus, it can be said that the tradespace is the space defined by the set of alternative designs that can be generated by all of combinations of the levels that are contained in the enumerated set of design variables. A tradespace can be expanded through novel combinations of existing design variables or generation of new design variables. Through the use of modeling and simulation, the entire tradespace (i.e., the total set of design alternatives) can be evaluated in terms of their benefits and costs to stakeholders. Here the benefits include all of the factors that particular decision-maker desires from the system (typically performance- or outcome-oriented), and costs include all of the resources the decision-maker cares about in order to achieve the desired benefits (typically these include monetary costs, but could also include schedule).The benefit–cost scatterplot is referred to as the tradespace because it offers an actionable representation for making “best” value trade-off decisions for the system (see Figure 10.2, for example).

Figure 10.2 Example tradespace reflecting designer-controlled parameterized concepts in terms of stakeholder value metrics (Source: Ross, Massachusetts Institute of Technology, 2006. Reproduced with permission of Ross)
The concept of value in this chapter is defined as the benefit for cost realized by a particular decision-maker, taking into account the importance and scarcity of the outcome. Because of the nature of systems engineering decision-making and the desire to help make explicit cost versus benefit trade-offs during early stage design, the representation of value in this chapter intentionally keeps the costs and benefits distinct (i.e., not aggregated together into a single function). It is often the case for complex systems that those who benefit and those who pay are different entities (e.g., government-funded science missions for scientist users and Air Force acquisition office for military end users) Keeping the cost and benefit functions separate is useful to foster more explicit conversations about benefits achievable for different levels of resources. This chapter will use “utility” as a functional representation of perceived benefit under uncertainty of an outcome derived from a particular system alternative.
This chapter is organized as follows. First key terms such as concept trade-offs and concept exploration are defined. Then key considerations that come into play in exploring the concept space are discussed. The ongoing transformation in systems engineering is discussed as the field is beginning to emphasize the “why,” beyond its traditional focus on the “how.” (Madni, 2015d) Systems engineering decisions and potential outcomes are discussed, and it is emphasized that a good decision does not guarantee a good outcome because of the element of uncertainty and unpredictability that characterizes the behavior of complex systems. Then trade-off analysis frameworks are discussed and contextualized within the broader context of systems engineering frameworks. The importance of conceptual trade-offs is discussed from a life cycle perspective. Then value-based multiattribute tradespace analysis methods are presented in terms of their key features and limitations. Thereafter, conceptual tradespace analysis is discussed in terms of tradespace exploration, sensitivity analysis, and system quality attributes (e.g., reliability, agility) that comprise the tradespace. Tradespace exploration is also presented within the context of spiral development and compared to traditional optimization and decision analysis. Finally, the dynamic nature of concept design tradespace is discussed with storytelling-based simulations advanced as an effective way to uncover previously unknown interactions that lead to an expansion of the design variables that contribute to conceptual trade-offs (Madni et al., 2014a). Storytelling is also shown to be a viable approach for dynamic trade-offs analysis (Madni, 2015a,b). The chapter concludes with a summary of key points made and a brief discussion of the outlook for the future.
10.1.1 Key Concepts, Concept Trade-Offs, and Concept Exploration
Systems engineering trade-offs tend to be poorly defined and not well understood (Chapter 1). Not surprisingly, they are underemphasized in technical project management and often become a significant source of conflict among stakeholders as the project progresses. The inevitable outcome of ignoring trade-off analysis is selection of a concept that has low probability of meeting the needs and has high probability of cost overruns that sometimes lead to outright program failures.
At its core, trade-off analysis (or tradespace analysis as it is often referred to in systems engineering) is an analytical method for evaluating and comparing system designs based on stakeholder-defined criteria. Trade-off analysis requires measurable system attributes (also called measures of performance (MOPs) and measures of effectiveness (MOEs)). An example of MOP is “speed in engineering units,” while an example of MOE is “probability of mission accomplishments” in terms that directly reflect stakeholder value. These are quantifiable criteria that are useful in characterizing how a stakeholder values important system attributes (e.g., performance, cost, and ilities). “Ilities” are quality attributes or properties of an engineered system that contribute to system value once the system is put into use. Examples of ilities are resilience, interoperability, and flexibility. Ilities are nonfunctional system requirements that are concerned with broader system impacts with respect to time and stakeholders. While system attributes and decision-makers' utility functions capture the system need to a large extent, there are other sources of unarticulated or poorly characterized value. These tend to be quality attributes such as flexibility, extensibility, and resilience. Attributes such as flexibility and resilience are not easily defined, quantified, or costed. Flexibility offers the ability to respond to expected change. Adaptability provides the ability to respond to unexpected change. Resilience is the ability to respond to disruptions (both expected and unexpected). Therefore, flexibility and adaptability are enablers of resilience. In this regard, tradespace exploration techniques are likely to provide insights by affording the system designer a larger system view that includes relationships between architectural and design choices. The tradespace shifts as a result of changes in stakeholder preferences. This shift can potentially produce a change in the ranking of candidate design options. Comparing the relative shift in the ranking of candidate designs along an isocost can provide insights into how a candidate design may or may not be susceptible to such changes.
Figure 10.3 is a depiction of the tradespace for a Space-Based Radar (Spaulding, 2003). This tradespace is analyzed to determine the best design (Roberts, 2003; Shah, 2004). Typical analysis methods choose from among candidate designs that lie on the Pareto Frontier. The choice is invariably based on the option that has the lowest cost. However, when we consider other attributes, this may not always be the case.

Figure 10.3 Concept of flexibility in tradespaces (Source: Ross 2005. Reproduced with permission of John Wiley & Sons)
With respect to Figure 10.3, a closer examination tells a somewhat different story if flexibility is deemed an important consideration. Flexibility implies that a system can be readily transformed into a different but related system at a modest cost. If flexibility is desirable, then Pareto Frontier solutions may not be the best. Roberts (2003) and Shah (2004) argue that these points in a sense are optimized for best value at a point in time and do not account for changes that might occur in the future. The latter, in fact, is the key motivation for wanting flexibility. While it may be appealing to incorporate flexibility into the utility model, one can potentially run into mathematical challenges (McManus et al., 2007). Therefore, treating quality attributes as separate criteria to be considered in addition to benefit and cost may provide more decision insights. Of course, all quality attributes including flexibility tend to come at a cost (Neches & Madni, 2013). So, the question that needs to be answered is whether or not the solutions on the Pareto Frontier are sufficiently flexible and, if so, what does flexibility cost. With respect to Figure 10.3, candidate designs A, B, C, D, and E all lie on the Pareto Front. However, close examination reveals that they are somewhat rigid in that they are not easily transitioned to other solutions on the Pareto Front. However, candidate option C, which has the same utility as option A but costs more than option A, can be “transitioned” to solution points B, D, or E more easily than option A. In this case, the cost differential between option C (the dominated point) and option A can be considered the cost of flexibility to move up the Pareto frontier. The generalized qualification of path dependence in transitioning between candidate solution options in a tradespace is an area of ongoing research (Ross, 2006; Ross & Hastings, 2006; Fitzgerald et al., 2012). It is intended to explicate the costs and benefits of including system quality attributes such as flexibility into an architecture or design. The rigid designs are those that have fewer design options to transition to than flexible designs do.
In the context of trade-off studies, measurable system attributes are used to determine how to balance stakeholder preferences (e.g., functions, objectives, measures, and requirements) to identify the system design that most closely satisfies stakeholders' objectives.
With respect to systems engineering trade-off analysis, a trade-off hyperspace is created to address the multiple trade-off factors (i.e., system attributes) for a system. Figure 10.4 presents a partial trade-off hyperspace for an unmanned vehicle. In other words, the trade-off hyperspace (i.e., tradespace) shown in this figure is meant to be a representative, not exhaustive. Different potential unmanned vehicles will display different trade-offs among these and other factors. Design features are represented in the design tradespace, while performance factors such as system performance, mission effectiveness, cost, schedule, and risk are represented in the performance tradespace.

Figure 10.4 A trade-off hyperspace for an unmanned vehicle
As can be expected, systems engineering trade-off analysis is complicated by several factors. These include the following: multiple stakeholders with conflicting objectives and differing preferences for system functions and attribute level; uncertainty surrounding technology maturity and the future actions of adversaries/competitors, interactions among hardware, software, and human elements in the system; and the need to address trade-offs at multiple levels of abstraction and spanning multiple domains (conceptual, physical, social). It is important to note that Trade-off analysis in the concept space needs to be employed in several systems engineering contexts:
- When creating an unprecedented system
- When integrating legacy components into a new system
- When developing and establishing feasibility of system design and CONOPS
Trade-off analysis is further complicated by the number of system attributes in the tradespace, number of stakeholders, percentage of nonengineer stakeholders, presence of uncertainty in key attributes and the future environment, and whether or not the trade-offs vary with context. The concept space is typically explored in the conceptual design stage (also called upfront engineering). During conceptual design, the mapping from function to form occurs. As noted earlier, the physical form (i.e., implementation) determines most of the performance potential, cost, and schedule of subsequent development in the life cycle. A suboptimal decision in conceptual design can potentially result in cost and schedule overruns, as changes become increasingly more difficult to make later in the system development life cycle. The design concept and high-level specification are the outputs of this stage. These outputs serve as inputs to the preliminary design stage. The design trade-offs space (or tradespace, for short) is the space that is spanned by the fully enumerated set of design variables. Given a set of design variables, the tradespace is the space of possible design options. It is from this space that the initial system design concept is created/selected. The system design concept that is selected from the conceptual design tradespace is one that mitigates the likelihood of costly change later in the system life cycle and that maximizes stakeholder value. In this stage, intentional or inadvertent premature reduction of the design space can result in loss of potential future value (Chapter 1). Such premature pruning of the design options tradespace can preclude the realization of high value, risk-mitigated system.
A fundamentally important activity is the linking of the concept trade-offs to specific systems engineering life cycle phases and appropriate stakeholders. These links ensure that the right factors and considerations are addressed in the early stages of systems engineering, that is, conceptual design or preliminary design. These links serve to inform stakeholders about the applicable trade-offs that address variables of interest to them. This timely communication of trade-offs and subsequent decisions are essential for stakeholder understanding and, ultimately, stakeholder buy-in.
The creation of this link can be aided by defining a system ontology that spans system life cycle phases, tradespace attributes/variables, stakeholders and their interests in specific attributes, the weights assigned to the various attributes, and the supporting rationale.
Concept trade-offs apply to both system design and operation. Concept trade-offs during operation are often dynamic and can vary with changes in context (Madni & Madni, 2004). In the spirit of true concurrent design, system CONOPS need to be defined at the same time that the system is specified. This is key to assessing the feasibility of the design and CONOPS that result from a systematized analysis of the tradespace and sensitivity analysis of key design variables and their impact on key MOPs and MOEs. It is important to realize that at this stage, there is a high degree of uncertainty and ambiguity that is gradually reduced through modeling and simulation-based analysis. At this stage, great care needs to be exercised to resist premature elimination of options through untimely imposition of constraints during conceptual trade-offs analysis.
The outcome of conceptual trade-off analysis is an assessment in terms of feasibility, short-term impact, and long-term viability including affordability (Chapter 4). A variety of trade-off analysis techniques can be employed as the system moves through a series of architectural abstractions, that is, concept, function, form, and fit. Finally, it is imperative to go beyond the obvious technical and programmatic trade-offs to include the enterprise, social, and human cognitive dimensions and their impact on technical and programmatic trade-offs.
10.2 Defining the Concept Space and System Concept of Operations
As systems continue to grow in scale and complexity, upfront engineering becomes a critical activity with significant downstream impact. Specifically, initial specification of the system concept becomes a key driver of system performance and effectiveness.
Tradespace typically defines the region within which an optimum balance needs to be struck among factors such as performance, cost, and schedule. However, the tradespace defined solely by considering these three variables may not be sufficiently encompassing to strike an ideal balance among system attributes. This is where the system concept of operations (CONOPS) comes in. In fact, CONOPS needs to be a key variable in the tradespace (Mekdeci et al., 2011). For a CONOPS to be part of the tradespace, the CONOPS must perform its intended role in the development process and abide by the specific constraints that govern the system. Context comprising distinct but related elements serves to bound the CONOPS tradespace. These elements are the mission, system capability, and operational scenarios. These relationships can be captured within an ontology that encompasses the key concepts and relationships associated with a system CONOPS (Figure 10.5).

Figure 10.5 System CONOPS ontology (Adapted from Madni 2015c,d)
10.3 Exploring the Concept Space
Systematic exploration of the concept tradespace is essential to identifying superior and novel options (Madni et al., 1985; Madni, 2014). Key considerations during exploration are the success criteria, constraints, and system attributes. There are other factors that also bear on concept exploration, including functions, objectives, information availability, expertise availability, data availability, ambiguity and uncertainty in these factors, imposed inheritance and constraints, schedule and budget pressures, as well as cultural and organizational factors. Exploration can be aided by systematically applying and relaxing different constraints at the right time to assess the impact of these actions on the tradespace and to determine viable options and their sensitivities to constraints.
10.3.1 Storytelling-Enabled Tradespace Exploration
Storytelling is a powerful instrument for uncovering variables that should become part of the tradespace and for performing dynamic trade-offs (Madni, 2015a). Storytelling brings the benefit of illuminating changing contexts over time. Stories are created from a combination of mission description, use cases, and domain expert knowledge elicitation (Madni et al., 2014a). Interactive stories, that is, stories that allow users to interact with the system and thereby shape story evolution, are especially useful in uncovering previously unknown interactions as well as “hotspots.” Stories allow simplification (e.g., through abstraction and selective timeline compression) and thereby allow the user to uncover interesting interactions and “surprises” (both good and bad outcomes) with fewer runs than possible with traditional simulation (Madni et al., 2014b). The challenge is to ensure that the story is rich enough (i.e., complicated enough) to be interesting and insightful and simple enough to find short-term answers of interest to the different stakeholders. Because of these properties, stories add temporal, spatial, and human dimensions to the tradespace.
10.3.2 Decisions and Outcomes
Ward Edwards said that “a good decision cannot guarantee a good outcome” (Edwards, 1962). Real decisions invariably involve uncertainty. A decision is, therefore, a bet, and evaluating whether it is good or bad depends on the stakes and the odds, not on the outcome. Also, the goodness of a decision is with respect to the criteria one defines. The possible results from the resolution of an uncertain event are called outcomes. With some uncertain events, there are only a few possible outcomes. In other cases, the outcome is a value within a specified range. The outcome of an uncertain event comes from a range of possible values and may fall anywhere within that range. Multiple uncertain events can potentially be considered in a decision situation. However, only a subset might be relevant. For an uncertain event to be deemed relevant, it must have some impact on at least one of the objectives. An example of an uncertain event in systems engineering is the time for a technology to mature from TRL3 to TRL7. This uncertain event has an impact on system objectives such as system performance, system affordability, system scalability, and possibly other system quality attributes (also called ilities). The complexity of a decision situation depends on the number of relevant uncertain events. The larger the number of uncertain relevant events in a particular context, the more complex the decision. Early in the system life cycle, such as conceptual design, the number of uncertain events is at its largest; some of these events will resolve themselves before the system enters operations (e.g., system test results, while others will resolve during operations (e.g., adversary/competitor actions). Also, some relevant uncertain events may depend on other such events. This dependence further adds to the complexity of the decision. Decisions made during the concept stage then are not only far-reaching, but also made complex by the sheer number and variety of uncertain events.
10.3.3 Contingent Decision-Making
In systems engineering, proactively managing the impact of uncertainty is critical. This capability is especially crucial when exploring the concept space and performing conceptual trade-offs analysis. One method of managing uncertainty is to create flexible opportunities that allow for deferring some decisions until uncertainties are resolved. Exploring the concept space and performing conceptual trade-offs analysis provide mechanisms to identify opportunities for deferring decisions and to define what have been described as “real options” (Myers, 1977)
Figure 10.6 illustrates some of the key concepts of a real option, including implementation of the option (real option enabled), the period during which the option enables the “right but not obligation” to execute a decision (at some cost), followed by the end of the option (real option expires).

Figure 10.6 Anatomy of a real option (Source: Mikaelian et al. 2008. Reproduced with permission of Donna H. Rhodes)
In systems engineering, real options have been exploited to hedge against downside risk while promoting upside opportunity. However, such flexibility, similarly to all quality attributes, comes at a cost. The cost in this case is increased system complexity, additional financial outlay, and potential delay in schedule. The challenge is where to embed the real options to derive maximum leverage and enable the ability to satisfy the appropriate objectives at the appropriate time. Maximum leverage is derived by having key options available when they are needed (often as late as possible in the system life cycle, when cost of change is at its highest). During the option-enabled period, there may be associated carrying costs (e.g., storage costs for spare satellites, which enable the option to launch replacements to an existing constellation). Having such options allows for contingent decision-making where decisions can be deferred and executed contingent on emergent information. The challenge for designers is determining which options to embed in the system in order to respond to both anticipated and unanticipated uncertainties (Ricci et al., 2013).
10.4 Trade-off Analysis Frameworks
The purpose of a trade-off analysis framework is to identify and organize the key components comprising the trade-off hyperspace (i.e., tradespace for short) to facilitate subsequent analysis. Frameworks provide a formal construct for: (i) analyzing trade-offs associated with designing a new system or modifying an existing one using stakeholders' values; (ii) optimizing system design and operation in light of stakeholders' values; and (iii) analyzing sensitivities of stakeholders' values and system outputs to system perturbations introduced as “what-if” changes. Frameworks need to be generalizable and capable of supporting the analysis of tradespaces for both system design and system operation.
In systems engineering, the trade-off analysis framework is an essential part of the system engineering framework. The systems engineering framework informs and guides system design and incorporates feedback from system operation. Systems engineering frameworks tend to be process-oriented in the sense that they implicitly adopt a life cycle (i.e., beginning to end) perspective of a system. They also tend to be holistic in the sense that they focus on the key activities involved in developing, manufacturing, testing, deploying, and operating a system, rather than on specific methods for executing the steps in the systems engineering process. The V-model is an example of a traditional systems engineering framework. A trade-off analysis framework would have to fit within such a framework.
There are several trade-off analysis frameworks in use today. These frameworks have several features in common: (i) multiple criteria (i.e., trade-off dimensions); (ii) multiple stakeholders, some with conflicting preferences; and (iii) system-specific or general-purpose use. Examples of trade-off analysis frameworks are provided in Table 10.1. (Chapter 8 provides an expanded list and assessment of trade-off frameworks for developing and evaluation alternatives.)
Table 10.1 Example Trade-Off Analysis Frameworks
| Name | Key Characteristics |
| Decision-based design (DBD) (Hazelrigg, 1996) | Evaluates systems/products that have a market, and associated demand and supply such that revenues are generated from selling the product at a particular price; implicitly considers trade-offs based on the rationale that design with the highest expected utility (EU) is the preferred candidate; alternatives are ranked using expected utility |
| Multiattribute tradespace exploration (MATE) (Ross et al., 2004) | Explores design/configuration options and then evaluate them in a benefit–cost space; iteratively utility aggregates benefit attributes (or trade-off dimensions) of interest for a given design that benefit relevant stakeholders and positions the design options relative to cost(s) of design, thereby capturing dominance of the designs in terms of benefit-to-cost trade-offs designs with most efficient trade-offs being preferred |
| Change propagation analysis | Tracks changes in complex systems with goal of evaluating the potential impact of specific changes on the system. Impact may implicitly contain multiattribute trade-offs based on stakeholder input (similarly to decision-based design and MATE); relies on design structure matrices (DSM) to characterize system and system interdependencies (Eppinger & Tyson, 2012) Changes in system can be identified, tracked, and quantified and form the basis for deriving measures of change type and magnitude in a system; change in DSM density is a proxy for magnitude of change in a system; change propagation index (CPI) metric is for determining the level of change in a system (Bartolomei et al., 2012) |
| Hazard and risk analysis | Addresses how hazards lead to risks in the deployed system by evaluating how design decisions affect reliability issues or risk posed by a system; used to analyze a system to mitigate residual risk in a system before it is fielded; for example, failure mode, effects, and critically analysis (FMECA) and systems-theoretic accident modeling and processes (STAMP); Marais framework, an improvement on STAMP (Marais, 2005, Macharis et al., 2009) |
| Multiactor, Multicriteria Analysis (MAMCA) (Macharis et al., 2009) | Analyzes trade-off hyperspaces associated with design and operation of a system while accommodating needs and preferences of multiple stakeholders; broadest, most generally applicable for analyzing a system; often not overly specific to a particular system or method |
| Negotiations | Facilitate consensus among stakeholders when there are competing preferences; many formal approaches exist to facilitate alignment (e.g., Game Theory) |
There are multiple sources of uncertainty in systems engineering trade-offs analysis: (i) system-related; (ii) external-environment-related; (iii) valuation-method-related; and (iv) model-related.
System-related uncertainty arises from partial observability of system behavior. External-environment-related uncertainty stems from a lack of perfect information about various entities in the environment. These include the characteristics of an adaptive, asymmetric adversary, the time frame for an immature (e.g., TRL 3) but promising technology to mature, pending new policies and regulations, new standards that developers have to comply with, and potential competitors working on similar products. Valuation-method-related uncertainty arises from the inability of stakeholders to accurately convey preferences. The latter includes differences in the manifestations of preferences and time-dependent or context-dependent assumptions used in the valuation methods. Model-related uncertainty originates from approximations and abstractions made to simplify the model. All these uncertainties have to be accounted for when conducting systems engineering trade-offs analysis.
There is also a multistakeholder alignment challenge. The diversity of stakeholder preferences grows with increase in number of stakeholders causing a preference alignment challenge. There are several methods proposed in the decision analysis literature to deal with the stakeholder alignment challenge. These include the following: supraobjective function, negotiations, analytical methods, and minimum acceptable threshold.
10.5 Tradespace and System Design Life Cycle
Design efforts have typically focused on generating design options and evaluating their feasibility for various missions. Practically speaking, despite impressive advances in computing, evaluating design alternatives exhaustively remains time-consuming and expensive. This is why some engineers begin a design with a preferred, previously developed baseline concept and then systematically perturb the baseline to generate alternatives. Occasionally, concept trade-offs are performed on a larger scale using lower fidelity models. Chapter 8 discusses holistic techniques to develop a creative set of alternatives that span the concept space. The system design life cycle begins with collaborative and iterative specification of requirements and concept development and concludes with system operation, periodic upgrades, and ultimately disposal.
Keeping the tradespace of potential design options open as late as possible is essential for ultimately identifying an effective candidate solution. Unfortunately, the tradespace is often prematurely and inadvertently reduced when customers specify requirements in a manner that implicitly implies a solution direction (e.g., choice of a particular technology or legacy component). In such cases, design creativity is stifled and design options are limited to a subset of potential options.
The process of design can be viewed simply as a series of system designer decisions, where each decision effectively prunes the set of available alternatives before arriving at the final preferred alternative (Madni, 2014). While narrowing the tradespace is both useful and desirable at the proper time, premature elimination of potential options can limit the value delivered to stakeholders (Madni, 2014).
10.6 From Point Trade-offs to Tradespace Exploration
Ross and Hastings (2005) present four types of trade-offs that represent increasing scope and effort: local point solution; Pareto frontier subset solution points; Pareto frontier solution sets; and full tradespace exploration. Figure 10.7 illustrates these four. A local point solution represents the least effort and value because of incomplete knowledge of the bigger picture needed to arrive at higher value solutions. The Pareto frontier subset solution begins to acknowledge key value trade-offs that exist in the tradespace. Multiple design options are considered with no “best” solution clearly identified. The complete Pareto frontier explicitly identifies the key cost–benefit trade-offs for each design option. New candidate design options can be rapidly assessed in terms of their distance from the “optimal” trade-off curve. Full tradespace exploration takes into account both dominated solutions and the Pareto Front. The inclusion of dominated solutions in the analysis acknowledges the possible existence of uncaptured value metrics (i.e., the requirements may be incomplete or wrong), recognizes that uncertainty may exist in the location of particular points (e.g., external-environment-related or model-related uncertainty), and allows for more detailed, dynamic analysis of the tradespace boundary.
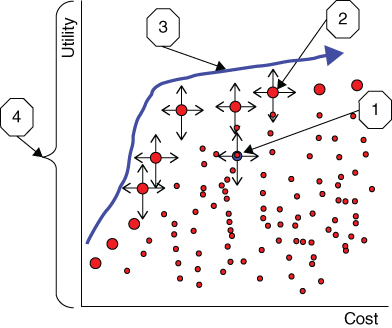
Figure 10.7 Four types of trade-offs: 1) local points, 2) frontier points, 3) frontier sets, and 4) full tradespace exploration (Source: Ross 2005. Reproduced with permission of John Wiley & Sons)
10.7 Value-based Multiattribute TRADESPACE ANALYSIS
Chapter 2 presents the decision analysis underpinnings for trade-off analysis. Attributes are the key system performance/quality metrics of importance to stakeholders and decision-makers. They reflect how well the objectives specified by stakeholders/decision-makers are met. A system is characterized by multiple attributes. The attribute set needs to be complete, minimal, nonredundant, measurable, decomposable, and independent. Practically speaking, an attribute set, at a given level of a goal hierarchy, should be limited to seven or fewer attributes (Keeney & Raiffa, 1993). This reflects individual cognitive limitations for perceiving value (i.e., an individual has difficulty thinking about more than seven items simultaneously, typically closer to three or five).
Value functions aggregate attributes into a single metric that reflects the collective preferences of decision-makers/stakeholders. The value function is used to compare candidate system designs to arrive at the “best” solution. In principle, there are a variety of value functions that have been used in evaluating candidate system designs (Table 10.2).
Table 10.2 Example Value Functions
| Value Function Name | Function Type | Value Representation |
| Requirement | Binary | Yes/No |
| Functionality measure | Continuous | Amount of benefit provided |
| Single-attribute value (SAV) | Discrete or continuous | Desirability of a given level of a particular attribute |
| Single-attribute utility (SAU) | Discrete or continuous | Perceived SAV under uncertainty |
| Multiattribute value (MAV) | Discrete or continuous | Aggregate value of independent attributes |
| Multiattribute utility (MAU) | Discrete or continuous | Perceived MAV under uncertainty |
These value functions (Table 10.2) range from least difficult to most difficult to generate. The more difficult to generate, the more useful is the function in tradespace exploration because it captures the key preferences of decision-makers/stakeholders in greater detail, thereby allowing system developers to assess an expanded tradespace. Value function attributes can range from “least desirable” to “most desirable.” In the limit, when the value function acceptability range converges to a point, it becomes a requirement (Ross & Hastings, 2005).
While some debate exists in the academic community about the role of uncertainty (vs ambiguity) in early phase design, this chapter will focus on using utility functions, rather than the more general value functions. This is done in order to reflect both the role of uncertainty in the mind of the decision-maker (and the ability to accurately predict the outcomes of particular designs) and the desire to have the concept of value reflect explicit trade-offs between benefit and cost. Utility will be constrained to represent only the benefit criteria under uncertainty, while cost will represent the resource criteria. The concept of “value” will be determined as an interpretation of desirable utility for cost and will vary from decision-maker to decision-maker.
10.7.1 Tradespace Exploration and Sensitivity Analysis
Tradespaces can be represented using a variety of visualization formats, including Kiviat Charts, bar charts, and utility–cost scatterplots. The utility–cost plot representation of the tradespace is a concise representation that highlights two critical decision metrics. The value-oriented focus of the tradespace plot is that utility, a key decision metric, is defined by the decision-maker who ultimately chooses from among the available alternatives. It is important to recognize that with designer-specified metrics such as speed or power; utility has to be inferred because these engineering characteristics used by designers do not directly measure the value or benefit that accrues to owners of the system when it is operated to achieve mission objectives.
The value-centric representation of a tradespace allows for the comparison of different concepts on the same basis (e.g., utility and cost). Figure 10.8 illustrates a tradespace for an operationally responsive disaster surveillance system, with different concepts dominating different regions for the Owner stakeholder. In this case, the satellite concept delivers less benefit and more cost than many of the alternatives. Surprisingly, the sensor swarm concept appears most promising at low cost and high benefit (however, further inspection reveals that the swarm is difficult to deploy in various potential mission areas, making the concept infeasible. This example illustrates the importance of iterative exploration of tradespaces, especially when utilizing low fidelity models for evaluating costs and benefits. Assumptions made during concept development may not be compatible with new information discovered later in the life cycle; therefore, it is essential to explore the uncertainties and sensitivities in tradespace results.

Figure 10.8 Multiconcept tradespace with sensor swarms, aircraft, satellites, and systems of systems (SoS) composed of pairs of assets (Source: Chattopadhyay, Massachusetts Institute of Technology, 2009. Reproduced with permission of Ross)
When a requirement or a stakeholder's preference changes, the impact of that change on the tradespace can be rapidly assessed. Ross & Hastings (2005) show a representative tradespace impact of a change in the utility function for a system after the decision-maker reviewed the initially proposed design (Figure 10.9). Another use of the tradespace plot is to compare point designs in a macro-tradespace sense, that is, in terms of high-level alternatives. Designs that are dominated (i.e., inferior to the Pareto front) can be readily identified and examined.

Figure 10.9 Preference change by stakeholder shifts tradespace (Source: Ross 2005. Reproduced with permission of John Wiley & Sons)
10.7.2 Tradespace Exploration and Uncertainty
Uncertainty complicates tradespace exploration and alternative selection (Chapter 9). Various approaches have been pursued to include uncertainty in tradespace representation and exploration. Walton (2002), Walton & Hastings (2004) employs Monte Carlo simulations to generate probability distributions associated with each point in the tradespace. In this case, uncertainty is quantified as the variance of the value metric. Once uncertainty is quantified, system designers can exploit both the upside and downside of uncertainty (Walton & Hastings, 2001). For example, portfolio of system designs that combine options with anticorrelated uncertainties will have lower uncertainty than the uncertainty in individual designs (Walton, 2002; Walton & Hastings, 2004). Figure 10.10 presents an example of uncertainty-value space from which portfolios are constructed.

Figure 10.10 Example tradespace: uncertainty mitigation through system portfolios (Source: Walton 2002. Reproduced with permission of the Massachusetts Institute of Technology)
Each point in the figure is a point in the tradespace. As with financial portfolio theory, the efficient frontier of maximum value for a given level of uncertainty represents various combinations (or portfolios) of options. For financial instruments such as stocks and bonds, the uncertainty, or variance, is equated with “risk” and the expected value is called “return.” Portfolios with best risk–return ratios are constructed based on the risk tolerance of the portfolio holder (Howard & Abbas, 2015, pp. 622–624). In Figure 10.10, three types of decision-makers are shown: highly risk-averse, moderately risk-averse, and minimally risk-averse. The optimal investment strategy for each type of decision-maker is determined by the intersection of the isovalue contours of the decision-maker with the efficient frontier. The analogy is made between partial ownership of financial instruments (i.e., stocks, bonds) and the partial investment in the development of physical systems. As uncertainties are resolved with further development of the system, the portfolio is modified accordingly (Walton, 2002). The key idea behind the uncertainty-oriented view of the tradespace is to develop an understanding of high leverage points for technology insertion or investment. Technology development that results in more anticorrelated design options can potentially mitigate uncertainty and help system engineers and program managers protect against program failure that is more likely with correlated technology development.
One high payoff application of the uncertainty-focused interpretation of the tradespace is in understanding high leverage points for technology insertion or investment. Technology development that results in more anticorrelated design options has the potential of reducing uncertainty and helping the system developer hedge against the risk of program failure due to correlated technology development. Of course, this hypothesis provides the basis for a whole new area of research.
10.7.3 Tradespace Exploration with Spiral Development
With spiral development, successive generations of system architecture and design result from each iteration of the spiral. Each iteration produces a learning opportunity that results in the refinement of the system architecture and design. A possible way to understand designs resulting from each spiral is through understanding the tradespace associated with each spiral (Derleth, 2003). Each spiral pass has a Pareto frontier, with some changes occurring in the Pareto Front with each spiral as new needs impact expectations around new capabilities. Thus, alternatives that were on the Pareto Front of the first spiral may not all be in the Pareto Front of the second spiral. In other words, some designs continue to offer the highest utility for a given cost, whereas others move to lower utility. This finding implies that designs are best chosen within the dynamic context of spirals. Sensitivities to hypothesized learning from one spiral to the next can be investigated in the tradespace context, resulting in superior architecture choices, especially where prior spiral decisions can limit future achievable capabilities.
10.7.4 Tradespace Exploration in Relation to Optimization and Decision Theory
For complex systems, value-driven tradespace exploration paradigm recognizes that concept design is a dynamic and complex process, and exploration is key to developing solutions that offer greater value to stakeholders. There are several reasons why system tradespace exploration is a preferred approach to optimization methods and decision-theory-only-based approaches such as utility functions (Table 10.3). While tradespace exploration can leverage both optimization and decision theory, the exploration paradigm encourages investigation of changing problem formulations and potential solutions and engagement with soft factors in order to iterate toward deeper understanding around the potential value of different alternatives.
Table 10.3 Comparison of Tradespace Exploration with Optimization and Decision-Theoretic Approaches
 |
Tradespace Exploration | Optimization | Decision Theory |
| Objective function | Can handle changing, poorly defined objectives; can leverage decision theory and optimization | Require well-defined objectives | Employ utility functions to account for uncertainty in outcomes |
| Decision-maker preferences | Can handle changing preferences | Reflected in well-defined objective function | Can handle decision-maker preferences; changing preferences require revisiting decisions |
| Handling of “Soft” issues | Policy issues; system quality attributes such as flexibility and resilience | Not equipped to handle soft issues | Limited handling of soft issues |
| Uncertainty management and mitigation | Uncertainty–cost tradespace; uncertainty, mitigation through real options and decision rules (engineering view) | Limited uncertainty handling (stochastic optimization) | Uncertainty handling through real options (normative view) and expected value of perfect and imperfect information; use of expected utility; Bayesian networks |
| Visualization | Risk presentations; Kiviat charts; utility–cost functions; uncertainty cost functions; Pareto Front representation and change | Traditional visualization formats used by optimization methods | Utility curves; risk–benefit curves; sensitivity curves |
Source: Adapted from Madni 2015c,d.
Trade-offs between design choices, perceived utility, and costs of alternatives are conveniently performed today using tradespace exploration. Tradespace exploration and visualization can support a variety of analysis and can be a source of much needed insights during the conceptual stage of system design. Tradespace analysis is complicated by changing needs and contexts over time. Today, tradespace exploration is being exploited: to identify promising designs; understand strengths and weaknesses of each design alternative across the tradespace; identify requirements and constraints that limit the ability to uncover less expensive solution; understand design sensitivities to changes in needs and context; and assess differential impacts of uncertainty on different alternative designs with opportunities for risk mitigation.
System architects and designers have the daunting challenge of evaluating multiple candidate design options, in terms of satisfying the needs of multiple stakeholders with potentially conflicting objectives while also contending with changes in stakeholders needs, emergence of new, relevant promising technologies, and uncertain geopolitical futures (Madni, 2015a). Fortunately, increases in computing power and decreasing cost of computing resources and wide availability of flexible tools have made it possible to more extensively explore the tradespace, generate more design options and CONOPS, and assess their feasibility.
In light of the forgoing, the first step is generating a tradespace for exploration. Figure 10.11 provides the overall concept for tradespace generation and exploration.

Figure 10.11 Tradespace generation and exploration
Figure 10.11 presents the tradespace generation and exploration system concept and functional architecture of a future system. As this figure shows, in the database generation phase, tradespace analysis is used to generate a large, representative number of candidates designs, concepts of operations, and their preanalyzed performance. The design and CONOPS are parameterized and expressed as parametric curves. System performance is expressed in terms of attributes and metrics of interest to the stakeholders. Computational and graphical tools allow the system engineers to query the database. Tradespace analysis employs utility–cost curves to concisely portray cost–benefit for each candidate design and CONOPS. Some of the key benefits of using this approach are as follows:
- Visualizing the immediate effects of changing needs
- Comparing candidate design alternatives (point designs) in a tradespace under a variety of contexts and conditions
- Readily identifying both functional and performance constraints on feasible solution set
- Visualizing different impacts of uncertainty across alternatives from tradespace
- Discerning alternatives in terms of their ability to change state (flexibility)
- Informing spiral acquisition
- Assessing policy robustness of alternative solutions
Tradespace exploration, a concept borrowed from decision analysis, is domain-independent. It explicitly links value propositions to alternatives, which may be obscured by politics, time, and misrepresentation. Tradespaces are constructed using concept-independent criteria (i.e., perceived benefits and costs) that allow comparison of distinct concepts based on the same tradespace.
Tradespaces can change over time. Therefore, tradespace exploration approaches need to be able to handle a dynamic tradespace. To this end, methods are needed that relax assumptions about static performance and constraints while adding the ability to take into account changing contexts and needs (epochs) over the short and long run (eras) using, for example, Epoch-Era Analysis (Ross, 2006; Ross & Rhodes, 2008; Roberts et al., 2009). In addition, there is a need to quantify the ability of the system to change (“changeability”) in the tradespace (Ross et al., 2008). This capability allows for the evaluation of a system's ability to reconfigure or be altered to respond to changing definitions of utility and cost over time. Several metrics have been defined to identify “good” designs in a time-varying context. These metrics fall into specific categories to achieve system value robustness, that is, maintain system value despite changing contexts and needs. These include highly changeable designs (filtered outdegree) and highly versatile or passively value robust designs (Pareto Trace, normalized Pareto trace, fuzzy normalized Pareto trace) (Ross et al., 2009a, 2009b). Temporal system properties that can be considered in tradespace exploration include system vulnerability and resilience (Ross et al., 2014).
10.8 Illustrative Example
We use the Multiattribute Tradespace Exploration (MATE) approach to illustrate key concepts associated with concept trade-offs analysis. At a high level, MATE can be implemented using the following seven steps:
- Determine Key Decision-Makers
- Scope and Bound the Mission
- Elicit Attributes and Utilities (preference capture)
- Define Design Vector Elements (concept generation)
- Develop Model(s) (evaluation)
- Generate the Tradespace (computation)
- Explore the Tradespace (analysis and synthesis)
In this example, MATE is used to identify a high-value design for a maritime security system of systems.
10.8.1 Step 1: Determine Key Decision-Makers
The key decision-maker for this example was a representative of the government agency requesting the study. This representative provided the high-level operational needs statement for the system:
Provide maritime security for a particular littoral Area of Interest (AOI).
Additionally, the decision-maker expressed that stakeholders want a system that detects, identifies, and boards suspicious boats and that is capable of carrying out search and rescue missions.
10.8.2 Step 2: Scope and Bound the Mission
The goal of the MATE study is to determine what will be the “best” system when considering performance, ilities, and cost in this context. The decision-maker provided bounding constraints that said that the system must leverage inherited ground radar towers and existing manned patrol boats. It was suggested that the study consider UAVs as well. Additionally, the study was to consider the impact of loss of assets during the mission and means for mitigating the impact of such a loss.
10.8.3 Step 3: Elicit Attributes and Utilities (Preference Capture)
Discussions with the decision-maker elicited the function–objective–attribute decomposition shown in Figure 10.12.

Figure 10.12 Decision-maker to attribute mapping for a maritime security system
For this study, the government agency acted as the actual decision-maker, desiring that both the security force and coast guard stakeholders be treated as separate “missions” to be satisfied. The goal for the government agency was to understand whether and what potential systems could satisfy each mission, as well as the overall cost objectives. Table 10.4 has an example list of attributes considered.
Table 10.4 List of Attributes for Maritime Security Case
| Attribute | Comment |
| Probability of detection | 0% to 100% |
| Probability of identification | 0% to 100% |
| Probability of intercept | 0% to 100%, same as successful boarding |
| Probability of rescue | Contingent on time to locate and time to rescue |
| Acquisition cost | In $10M |
| Operations and workforce cost | In $10M/year |
Through (lottery-based) interviews with the stakeholders, the following preferences were elicited:
- Security Force
Attribute Name Weight Min Acceptable (%) Max Desired (%) Probability of detection 0.2 90 100 Probability of identification 0.2 25 100 Probability of intercept 0.6 10 100 Figure 10.13 illustrates the single-attribute utility (SAU) curves for the Security Force mission showing increasing utility with increases in attribute. Of note in these curves is the “N=” at the top, which shows how constraining that SAU curve is on the tradespace, effectively showing the resulting fraction of the tradespace still feasible after application of that SAU curve. The asymmetry of the SAU curve is that designs are unacceptable (i.e., infeasible) if they score below U = 0, while they are not any more valuable, but are still feasible when scoring at or above U = 1. For this case, it is not possible to score higher than 100% probability, but in general, a design could conceivably score higher than the maximally desirable level of a particular attribute.

Figure 10.13 Single-attribute utility (SAU) curves for the security mission
- Coast Guard
Attribute Name Weight Min Acceptable (%) Max Desired (%) Probability of rescue 0.4 20 100 Probability of detection 0.3 90 100 Probability of identification 0.2 25 100 Probability of intercept 0.1 10 100 This example will focus on the Security Force mission stakeholder, so Coast Guard SAU curves are not included for brevity.
The weights on the SAUs were elicited and determined to add to one, which coincides with a linear weighted sum multiattribute utility aggregation function:
10.1
where Xi is the value for attribute i, SAUi is the single-attribute utility curve for attribute i, and ki is the swing weight for attribute i.
Note: the cost attributes were not rolled up into a utility function in order to help the decision-maker make explicit trades on cost versus benefit. This paradigm enables the decision-maker to explore and update his value model based on discoveries of what is possible and affordable.
10.8.4 Step 4: Define Design Vector Elements (Concept Generation)
Various brainstorming techniques were used to generate seven concepts for the system. These are summarized in Table 10.5.
Table 10.5 System Concepts
| Concept 1 | Use a heterogeneous set of unmanned aerial vehicles (UAVs) to perform maritime surveillance (i.e., detection, identification, and interception) |
| Concept 2 | Use satellite for communication relay and UAVs for identification and interception |
| Concept 3 | Use radar tower for detection and UAVs for identification and interception |
| Concept 4 | Use mixed manned and unmanned vehicles for performing surveillance, with manned vehicles (preferably boats) used for boarding and interception |
| Concept 5 | Use UAVs (or satellite or radar tower) for detection, unmanned boats for identification, and manned boats for boarding |
| Concept 6 | Use UAVs for detection and identification and manned boats for boarding |
| Concept 7 | All-inclusive SoS, with UAVs, unmanned boats, radar towers, and satellites for surveillance |
These concepts were then deconstructed into a number of design variables that parameterize aspects of the system's form and CONOPs, described in Table 10.6.
Table 10.6 Design Variables Parametrizing System's Form and CONOPs
| Name | Definition Range | Comment | |
| Form | Hermes UAV | 2–6 | |
| Shadow UAV | 2–6 | ||
| Manned patrol aircraft | 0–4 | ||
| Helicopters | 0–3 | ||
| Manned patrol boats | 4–12 | ||
| Satellite relay | Yes/No | For now fixed at no due to cost | |
| Ground radar towers | Yes/No | For now fixed at yes due to cost | |
| CONOPs | Authority | Central/distributed | |
| Operators/UAV | 2:1/1:4 | Many to one, or one to many | |
| Tasking type | Dedicated/multirole | Each vehicle dedicated or not | |
| Number of geographic zones | 1/2 | ||
| Workforce buffer | 0–33% | ||
| Decoys | 0–3 |
The expectation is that not only does the form of the system matter (i.e., the number of each type of equipment), but also how it is operated (i.e., the CONOPs, including how tasks are assigned to vehicles).
10.8.5 Step 5: Develop Model(s) (Evaluation)
Once the attributes (outputs) and design variables (inputs) have been defined, the next step is to develop the evaluation model that will determine the attributes from each uniquely defined input concept design specified by enumerated design variable levels. For this study, the performance model was an agent-based discrete event simulator (Figure 10.14), which was developed to allow for analysis of emergent behaviors arising from the interaction of constituent systems and operational choices. Additionally, cost models and utility function evaluation models were used. The models were validated using input–output correlations as well as subject matter experts.

Figure 10.14 GUI screenshot for the maritime security agent-based discrete event simulator
10.8.6 Step 6: Generate the Tradespace (Computation)
In this step, the design space is sampled, with continuous design variables sampled at discrete levels. This resulted in 10,368 unique design concepts to be evaluated in the model. The model then evaluates each point across the mission timeline. The particular mission being evaluated had a number of uncertain elements, including the exact timing and location of boats entering and leaving the AOI. These uncertain elements were treated as stochastic, with values for particular mission timelines determined via sampling of probability distributions. The repeated sampling of the stochastic variables resulted in a large number of different potential mission starting conditions. All design alternatives were exposed to the same set of potential missions. To keep this illustration simple, the results of the simulation are presented as the means of the output scores. This is a simplification for brevity and clarity. In practice, one could consider the full distributions and apply the uncertainty management techniques described earlier in the chapter (e.g., portfolio optimization or real options).
The reason for generating tradespace data rather than just a few point designs is because rich data sets can be explored to reveal complex relationships between design space and value space for generating intuition into a problem. This is especially important for systems that display emergence, have complex/conflicting stakeholder expectations, and are subject to changing contexts where previous experience may bias predictions.
10.8.7 Step 7: Explore the Tradespace (Analysis and Synthesis)
Exploration of the tradespace can take many forms, including using predefined workflows, such as question-driven exploration, or can be more freeform using various interactive visualization tools. For now we will investigate the attractive designs for the Security Force stakeholder, first starting with a point design, moving on to a set of points, and then on to full tradespaces.
As mentioned earlier, when interpreting these figures, the “N=” at the top indicates how many designs are considered currently feasible, based on constraints, including preferences (i.e., if a design point does not meet minimum acceptable utility, then it is rejected from the tradespace). The yield, which is the fraction of the originally evaluated tradespace that remains after constraints, is indicated as 82.81% of the original 10,368 evaluated alternatives.
Figure 10.15 illustrates a point design for the maritime security system, with indicated design variable values. In the absence of a tradespace, this design point appears reasonable, with an acquisition cost around $40M and delivering a utility of 0.56. Further investigation reveals that this design has a probability of detection of 100%, probability of identification of 89.5%, and a probability of intercept of 59.5%. It is unclear from looking at the point alone what the trade-offs might be in terms of performance versus cost, for example.

Figure 10.15 Example point design for a maritime security system (N = 1)
Moving on to identifying an efficient set of points, Figure 10.16 illustrates a set of Pareto frontier points (efficient in terms of Security MAU and Acquisition Cost). All of these designs have in common a central command authority and two operators per UAV. Table 10.7 illustrates the attribute scores, acquisition cost, and MAU for these points. The general trend is that the increased cost moving from A to F gets you more performance in terms of probability of intercept. This coincides with having additional Hermes UAVs, as well as manned patrol boats.

Figure 10.16 Example Pareto frontier points for a maritime security system (N = 6)
Table 10.7 Attributes, Cost, and MAU for Selected Pareto Points
| Metric | A | B | C | D | E | F |
| Probability of detection | 97.5% | 99.8% | 100.0% | 99.9% | 100.0% | 100.0% |
| Probability of identification | 80.5% | 85.2% | 89.3% | 89.4% | 89.8% | 90.5% |
| Probability of intercept | 51.7% | 56.3% | 65.0% | 69.1% | 75.7% | 80.0% |
| Probability of rescue | 40.0% | 70.0% | 100.0% | 50.0% | 85.0% | 100.0% |
| Acquisition cost ($10M) | 2.5 | 2.7 | 3.8 | 4.9 | 5.2 | 8.3 |
| Security MAU | 0.38 | 0.52 | 0.59 | 0.62 | 0.68 | 0.73 |
Taking the exploration further results in the tradespace shown in Figure 10.17, with all 10,384 evaluated points considered, of which 82.81% are feasible. Highlighted is the full evaluated Pareto frontier set, expanding the alternatives for consideration in terms of most efficient MAU for Acquisition Cost. Using color-by-design variable, we can investigate design choice impacts on MAU and cost, expanding the scope of insight beyond the handful of Pareto points considered previously.

Figure 10.17 Example full tradespace and Pareto frontier set for maritime security system (N = 8586)
Figure 10.18 shows the tradespace colored by the number of Hermes and number of Shadows, respectively. The pattern of increases in the number of Hermes in the Pareto points is here again repeated, with three apparent groupings of increases in cost and utility for increases in Hermes. The utility increase from the increase in the number of Shadows is not as clear.

Figure 10.18 Tradespaces colored by number of Hermes and Shadows
Figure 10.19 shows the tradespace colored by the number of manned patrol boats and type of command authority, respectively. The three groupings in the tradespace are clearly driven by the number of manned patrol boats. This corresponds to their role in boarding suspicious boats, strongly driving MAU (and cost) with increases in number. Central command authority mostly dominates distributed authority in the tradespace.

Figure 10.19 Tradespaces colored by number of manned patrol boats and type of command authority
Figure 10.20 shows the tradespace colored by number of operators per UAV and the number of geographic zones. The apparent general increase in MAU with the two operators over the 0.25 operators per UAV appears counterintuitive (i.e., having each operator control more than one UAV seems as a force multiplier and therefore increases the performance of the system). Upon deeper inspection, we found that cognitive overloading leads to decreased operator performance when each operator must control multiple UAVs. This emerged in the performance model as each operator manages his own queue of tasking during the mission. Task backlogs accumulate as the operators switch between UAVs, operating at a constrained pace. As for number of geographic zones, this reflects the CONOPs trade of whether to allow the vehicles to travel the entire AOI or to constrain them to a fixed zone. In the lower cost region of the tradespace (where designs have fewer vehicles), the highest utility points tend to have one zone, whereas the higher cost region (and larger number of vehicles) the highest utility points tend to have two zones. These reflect the general need to have vehicles evenly distributed to increase the chances that they can respond quickly to a target of interest before it moves away.

Figure 10.20 Tradespaces colored by operators per UAV and number of geographic zones
Investigating a larger tradespace both confirms and expands upon the insights generated through investigation of a handful of design points. At some point, however, additional insights gained can be expected to diminish with increases in the size of the tradespace. The most appropriate size for a particular study should be determined on a case-by-case basis, with the view that tradespaces should scale up, rather than down. As noted previously in this book, the insights gained are only as good as the model developed and the quality of inputs. Through iterative exploration of the tradespace, model goodness can be determined. Tradespace exploration encourages broad sensitivity analysis of both models and preference inputs to better generate insights into trend relationships between what is desired (value proposition) and what is possible (evaluated design alternatives).
10.9 Conclusions
Exploration of the concept space is a key aspect of concept trade-offs analysis. Concept trade-offs analysis is a key activity in the conceptual design phase of systems engineering and is part of the overall systems engineering trade-offs analysis process. Similarly, systems engineering trade-off analysis is an integral part of the systems engineering process. The conceptual design phase is characterized by a high degree of uncertainty as customer needs are understood and then incrementally translated into requirements, which are then transformed into system design CONOPS. Trade-offs, performed in this phase, are critical to conceptual design decisions, which determine most of the cost and schedule of the system under development. The quality of conceptual design is determined in large part by the complete specification of the concept design variables and the effective and full exploration of the conceptual design tradespace.
In this chapter, we first defined key terms such as concept trade-offs and concept exploration. Then we discussed key considerations that come into play in exploring the concept space. We also briefly discussed the ongoing transformation in systems engineering as the field is beginning to emphasize the “why,” beyond its traditional focus on the “how.” Systems engineering decisions and outcomes were discussed. It was emphasized that a good decision does not guarantee a good outcome because of the element of uncertainty and unpredictability that characterizes the behavior of complex systems (Madni and Allen 2011). Then trade-off analysis frameworks were discussed and contextualized within the broader context of systems engineering frameworks. The importance of conceptual trade-offs was discussed from a life cycle perspective. Then, value-based multiattribute tradespace analysis methods were presented in terms of their key features and limitations. Then conceptual tradespace analysis was discussed in terms of tradespace exploration, sensitivity analysis, and system quality attributes that comprise the tradespace. Tradespace exploration was then presented within the context of spiral development and compared to traditional optimization and decision analysis. Finally, the dynamic nature of concept design tradespace was discussed with storytelling-based simulations advanced as an effective way to uncover previously unknown interactions that lead to an expansion of the design variables that contribute to conceptual trade-offs. Storytelling was shown to be a viable and effective approach for dynamic trade-offs analysis (Madni 2015e). We concluded the chapter with an illustrative example using the MATE software tool. This chapter has presented the state-of-the art in conceptual trade-off analysis with the growing convergence among disciplines (Madni, 2015c). Conceptual trade-off analysis can be expected to benefit from new insights offered by these disciplines.
10.10 Key Terms
- Tradespace: Multivariable mathematical space (trade-off + playspace) used for identifying the optimal boundary space (Pareto frontier).
- Storytelling: Conveying of event sequences using words, sounds, images with the objective of informing, educating, and persuading stakeholders about a point of view.
- Uncertainty: The state of being unsure about the existence of a state or value about a variable.
- Value: Importance, worth, or usefulness of an outcome, feature, or solution alternative.
- CONOPS: A user-oriented electronic or paper document that describes system characteristics for a proposed system from the user's viewpoint. Communicated to all stakeholders.
- Quality Attributes: Overall factors that affect operational behavior, system design, and user experience.
- Optimization: Process of finding greatest/least value of a function for some constraint, which must be true regardless of the solution; find most suitable value for a function within a given domain.
- Framework: A layered support structure (potentially comprising concepts, software, hardware, interfaces) or system that allows all elements of a system to be interrelated to each other and be manipulated as needed to support needs of the users.
10.11 Exercises
- 10.1 Give an example that will illustrate the relationship between concept, architecture, design, and system representation. (No credit for the examples discussed in this chapter)
- 10.2 For an electric vehicle
- a. Identify eight key system attributes.
- b. Identify stakeholders associated with each system attribute.
- c. Identify the uncertainty associated with each system attribute. Do all system attributes include uncertainty?
- 10.3 What are the key concepts and relationships associated with system CONOPS?
- 10.4 For the same electric vehicle in question #2, choose 4 key system attributes and discuss how changing one parameter can affect others. Categorize impacts in terms of high, medium, and low. Provide rationale for your categorization.
- 10.5 For a network of autonomous electric vehicles
- a. Identify key decision-makers.
- b. Identify key system and network attributes. Do all vehicles need to have same characteristics (attributes)?
- c. Map each decision-maker to system attribute(s).
- d. Identify types of uncertainties that exist in the system and environment, and discuss how they impact tradespace.
- 10.6 Using the concepts described in this chapter, perform a trade-off analysis for a system concept using the following steps:
- a. Determine key decision-makers.
- b. Scope and bound the mission.
- c. Elicit attributes and utilities (preference capture).
- d. Define design vector elements (concept generation).
- e. Develop model(s) (evaluation).
- f. Generate the tradespace (computation).
- g. Explore the tradespace (analysis and synthesis)
References
- Bartolomei, J., Hastings, D., de Neufville, R., and Rhodes, D. (2012) Engineering systems matrix: an organizing framework for modeling large scale complex systems. Systems Engineering, 15 (1), 41–61.
- Chattopadhyay, D., Ross, A.M., and Rhodes, D.H. (2009) Demonstration of System of Systems Multi-Attribute Tradespace Exploration on a Multi-Concept Surveillance Architecture. 7th Conference on Systems Engineering Research, Loughborough University, UK.
- Derleth, J.E. (2003) Multi-Attribute Tradespace Exploration and Its Application to Evolutionary Acquisition, Massachusetts Institute of Technology.
- Edwards, W. (1962) Dynamic decision theory and probabilistic information processing. Human Factors: The Journal of the Human Factors and Ergonomics Society, 4 (2), 59–74.
- Eppinger, S.D. and Tyson, R.B. (2012) Design Structure Matrix Methods and Applications, MIT Press.
- Fitzgerald, M.E., Ross, A.M., and Rhodes, D.H. (2012) Assessing Uncertain Benefits: A Valuation Approach for Strategic Changeability (VASC). INCOSE International Symposium. July 2012, Rome, Italy.
- Hazelrigg, G.A. (1996) Systems Engineering: An Approach to Information-Based Design, Prentice Hall, Upper Saddle River, NJ.
- Howard, R.A. and Abbas, A.E. (2015) Foundations of Decision Analysis, Prentice Hall.
- Keeney, R.L. and Raiffa, H. (1993) Decisions with Multiple Objectives--Preferences and Value Tradeoffs, 2nd edn, Cambridge University Press, Cambridge.
- Macharis, C., De Witte, A., and Ampe, J. (2009) The multi-actor, multi-criteria analysis methodology (MAMCA) for the evaluation of transport projects: theory and practice. Journal of Advanced Transportation, 43 (2), 183–202.
- Madni, A.M. (2014) Generating novel options during systems architecting: psychological principles, systems thinking, and computer-based aiding. Systems Engineering, 17 (1), 1–9.
- Madni, A.M. (2015a) Expanding stakeholder participation in upfront system engineering through storytelling in virtual worlds. Systems Engineering, 18 (1), 16–27.
- Madni, A.M. (2015b) Systems Engineering Tradeoffs Analysis: Challenges and Promising Themes. IIE Annual Conference and Expo, May 30–June 2, 2015, ISERC (accepted for publication).
- Madni, A.M. (2015c) Systems Engineering Transformation: From Process Recipes to Explainable Decisions. NSF Workshop on Decision Engineering: From Engineering Phenomenon to Value, October 29–30, 2015, Washington, DC.
- Madni, A.M. (2015d) Systems Architecting (SAE 549) Lecture Viterbi School of Engineering, University of Southern California.
- Madni, A.M. (2015e) Systems Engineering Transformation: From Process Recipes to Explainable Decisions. Invited Talk, National Science Foundation Workshop on “Decision Engineering: From Engineering Phenomena to Value”, October 29–30, 2015, Washington DC.
- Madni, A.M. and Allen, K. (2011) Options Reasoning for Large-Scale Systems Engineering, Program Management, and Organization Design. Conference on System Engineering Research (CSER), April 15–16, 2011, Redondo Beach, CA.
- Madni, A.M., Brenner, M.A., Costea, I., MacGregor, D., and Meshkinpour, F. (1985) Option Generation: Problems, Principles, and Computer-Based Aiding. Proceedings of 1985 IEEE International Conference on Systems, Man, and Cybernetics, November, 1985, Tucson, Arizona, pp 757–760.
- Madni, A.M. and Madni, C.C. (2004) Context-driven Collaboration During Mobile C2 Operations. Proceedings of The Society for Modeling and Simulation International Western Simulation Multiconference, January 18–22, 2004, San Diego, CA.
- Madni, A.M., Spraragen, M., and Madni, C.C. (2014a) Exploring and Assessing Complex System Behavior through Model-Driven Storytelling. IEEE Systems, Man and Cybernetics International Conference, invited special session “Frontiers of Model Based Systems Engineering”, October 5–8, 2014, San Diego, CA.
- Madni, A.M. et al. (2014b) Toward an experiential design language: augmenting model-based systems engineering with technical storytelling in virtual worlds. Procedia Computer Science, 28, 848–856.
- Madni, A.M. et al (2014c) Visual AnalytixTM SBIR Phase I Report, Intelligent Systems Technology Inc.
- Marais, K. (2005) A new approach to risk analysis with a focus on organizational risk factors. Dissertations. Massachusetts Institute of Technology.
- McManus, H., Richards, M., Ross, A., and Hastings, D. (2007) A Framework for Incorporating “ilities” in Tradespace Studies. AIAA SPACE Conference & Exposition, September 2007, AIAA Paper 2007-6100.
- Mekdeci, B., Ross, A.M., Rhodes, D.H., and Hastings, D.E. (2011) System Architecture Pliability and Trading Operations in Tradespace Exploration. 5th Annual IEEE Systems Conference, April 2011, Montreal, Canada.
- Mikaelian, T., Rhodes, D.H., Nightingale, D.J., and Hastings, D.E. (2008) Managing Uncertainty in Socio-Technical Enterprises using a Real Options Framework. 6th Conference on Systems Engineering Research, April 2008, Los Angeles, CA.
- Myers, S. (1977) Determinants of corporate borrowing. Journal of Financial Economics, 5, 147–175.
- Neches, R. and Madni, A.M. (2013) Towards affordably adaptable and effective systems. Systems Engineering, 16 (2), 224–234.
- Ricci, N., Ross, A.M., and Rhodes, D.H. (2013) A Generalized Options-based Approach to Mitigate Perturbations in a Maritime Security Systems-of-Systems. 11th Conference on Systems Engineering Research, March 2013, Atlanta, GA.
- Roberts, C.J. (2003) Architecting Strategies Using Spiral Development for Space Based Radar, Massachusetts Institute of Technology.
- Roberts, C.J., Richards, M.G., Ross, A.M., Rhodes, D.H., and Hastings, D.E. (2009) Scenario Planning in Dynamic Multi-Attribute Tradespace Exploration. 3rd Annual IEEE Systems Conference, March 2009, Vancouver, Canada.
- Ross, A.M. (2006) Managing unarticulated value: changeability in multi-attribute tradespace exploration. Doctor of Philosophy Dissertation, Engineering Systems Division, MIT, June 2006, Cambridge, MA.
- Ross, A.M. and Hastings, D.E. (2005) The Tradespace Exploration Paradigm. INCOSE International Symposium. July 2005, Rochester, NY.
- Ross, A.M. and Hastings, D.E. (2006) Assessing Changeability in Aerospace Systems Architecting and Design Using Dynamic Multi-Attribute Tradespace Exploration. AIAA Space AIAA 2006-7255, September 2006, San Jose, CA.
- Ross, A., Hastings, D., Warmkessel, J., and Diller, N. (2004) Multi-attribute tradespace exploration as front end for effective space system design. Journal of Spacecraft and Rockets, 41 (1), 20–28.
- Ross, A., McManus, H., Rhodes, D., Hastings, D., and Long, A. (2009a) Responsive Systems Comparison Method: Dynamic Insights into Design a Satellite Radar System. AIAA SPACE Conference & Exposition, September 2009, AIAA Paper 2009-6542.
- Ross, A.M., McManus, H.L., Rhodes, D.H., Hastings, D.E., and Long, A.M. (2009b) Responsive Systems Comparison Method: Dynamic Insights into Designing a Satellite Radar System. AIAA Space, September 2009, Pasadena, CA.
- Ross, A.M. and Rhodes, D.H. (2008) Using Natural Value-centric Time Scales for Conceptualizing System Timelines through Epoch-Era Analysis. INCOSE International Symposium. June 2008, Utrecht, the Netherlands.
- Ross, A.M., Rhodes, D.H., and Hastings, D.E. (2008) Defining changeability: reconciling flexibility, adaptability, scalability, modifiability, and robustness for maintaining lifecycle value. Systems Engineering, 11 (3), 246–262.
- Ross, A.M., Stein, D.B., and Hastings, D.E. (2014) Multi-attribute tradespace exploration for survivability. Journal of Spacecraft and Rockets, 51 (5), 1735–1752. doi: 10.2514/1.A32789.
- Shah, N.B. (2004) Modularity as an Enabler for Evolutionary Acquisition, SM, Massachusetts Institute of Technology.
- Spaulding, T.J. (2003) Tools for Evolutionary Acquisition: A Study of Multi-Attribute Tradespace Exploration (MATE) Applied to the Space Based Radar (SBR), Massachusetts Institute of Technology.
- Walton, M. (2002) Managing uncertainty in space systems conceptual design using portfolio theory. PhD. Massachusetts Institute of Technology.
- Walton, M. and Hastings, D. (2001) Quantifying Embedded Uncertainty of Space Systems Architectures in Conceptual Design. AIAA Space, August 2001, Albuquerque, NM.
- Walton, M. and Hastings, D. (2004) Applications of uncertainty analysis to architecture selection of satellite systems. Journal of Spacecraft and Rockets, 41 (1), 75–84.