
CHAPTER 21
Configuration Manager Reporting
IN THIS CHAPTER
![]() Overview of SSRS and Configuration Manager Reporting
Overview of SSRS and Configuration Manager Reporting
Reporting is often an overlooked feature in System Center Configuration Manager (ConfigMgr). Many ConfigMgr administrators focus on deploying operating systems, software updates, or applications. It is not until management asks questions such as “Who has Office 2010 installed?” or “What was the success rate for Office 2016 deployment?” that ConfigMgr’s reporting capabilities are considered. ConfigMgr reporting then becomes important, and this is also where ConfigMgr shines. If you had to manually inventory and report on several thousand computers by walking to each computer and collecting its inventory, it would take days if not weeks to collect and report this information. However, performing this same task using ConfigMgr could take only several hours.
Configuration Manager allows you to collect vast amounts of information about your servers, computers, mobile devices, and users. However, displaying the information contained within the ConfigMgr database would not be possible without both SQL Server Reporting Services (SSRS) and the ConfigMgr Reporting Point (RP) role. While both SSRS and RP are optional components for a ConfigMgr environment, the authors strongly recommend that you install and configure them to leverage the built-in reports in ConfigMgr. After installing these components, you can also create custom reports to meet your organization’s business needs.
Overview of SSRS and Configuration Manager Reporting
With the ConfigMgr RP installed, you have access to more than 400 built-in reports. These reports provide information regarding computer hardware, ConfigMgr site details, software licensing, and much more. The best part is that you do not need to access these reports with the ConfigMgr console; you can use a standard web browser.
Although many reports are available out of the box, at some point you will need additional information, either within an existing report or in a completely new one. This is when you will want to create your own reports to leverage the information collected by ConfigMgr. The next sections introduce you to SSRS, the ConfigMgr RP, and the optional features that are installed to enable ConfigMgr reporting.
Using SQL Server Reporting Services
SSRS is a server-based reporting platform that allows for comprehensive reports to be created and displayed to end users. In addition, SSRS allows you to schedule reports, enabling them to be saved to a file share or emailed to end users. The SSRS feature is typically installed on the SQL Server at the same time SQL Server is installed for ConfigMgr. For details about installing SSRS, access the SQL online books at https://docs.microsoft.com/sql/reporting-services/install-windows/install-reporting-services or see Chapter 1 of System Center Configuration Manager Reporting Unleashed (Sams Publishing, 2016).
Using the ConfigMgr Reporting Point Role
For ConfigMgr to leverage SSRS, you must install the ConfigMgr RP on the SSRS server. Prior to this, you must create an SSRS execution account, which SSRS uses to access the ConfigMgr database and schedule reports. The authors recommend that this account be used for SSRS only and that it be a low-rights user within Active Directory (AD). As part of the RP setup, the execution account is granted the appropriate permissions within both ConfigMgr and SSRS. Settings for the reporting point should look similar to Figure 21.1.
As part of the RP installation, the default ConfigMgr SSRS reports are created on the SSRS website. Because the appropriate security permissions are applied to each report during this time, this process can take several minutes to complete.

Notable Reporting Point Information
As a single chapter could not possibly cover all options for reporting point and report creation, the authors call attention to the following items:
![]() For performance reasons, the authors recommend that reports be accessed via the SSRS website rather than the ConfigMgr console. This reduces the workload on your ConfigMgr Site server and RP server. It also has an added benefit: You no longer need to install the ConfigMgr console for end users to only view reports.
For performance reasons, the authors recommend that reports be accessed via the SSRS website rather than the ConfigMgr console. This reduces the workload on your ConfigMgr Site server and RP server. It also has an added benefit: You no longer need to install the ConfigMgr console for end users to only view reports.
![]() To help with troubleshooting report errors, enable Remote Errors on your SSRS website to gather more details about errors. For more information, see http://www.enhansoft.com/blog/turn-on-remote-error-reporting.
To help with troubleshooting report errors, enable Remote Errors on your SSRS website to gather more details about errors. For more information, see http://www.enhansoft.com/blog/turn-on-remote-error-reporting.
Understanding Configuration Manager Data
Before you can start writing reports for Confirmation Manager, you should understand where and how the information is stored within the ConfigMgr site database. The next sections introduce you to the locations of various types of information stored in the ConfigMgr database. They discuss how each SQL view relates to the ConfigMgr client and cover the most common SQL view classes. Following is where you can find Microsoft documentation on SQL schemas for the various versions of Configuration Manager:
![]() ConfigMgr Current Branch: At the time this book was published, Configuration Manager Current Branch version 1710, Microsoft had not released official SQL schemas. However, you can use the ConfigMgr 2012 and ConfigMgr 2007 schemas as a reference.
ConfigMgr Current Branch: At the time this book was published, Configuration Manager Current Branch version 1710, Microsoft had not released official SQL schemas. However, you can use the ConfigMgr 2012 and ConfigMgr 2007 schemas as a reference.
![]() ConfigMgr 2012: The ConfigMgr 2012 SQL schema can be referenced at http://technet.microsoft.com/library/dn581954.aspx.
ConfigMgr 2012: The ConfigMgr 2012 SQL schema can be referenced at http://technet.microsoft.com/library/dn581954.aspx.
![]() ConfigMgr 2007: Information on the ConfigMgr 2007 SQL schema is available at http://technet.microsoft.com/library/dd334611.aspx.
ConfigMgr 2007: Information on the ConfigMgr 2007 SQL schema is available at http://technet.microsoft.com/library/dd334611.aspx.
NOTE: MICROSOFT QUERY SUPPORT
Microsoft supports querying only from the SQL views. Directly querying the base SQL tables is unsupported, as the underlying table structure may change between versions of Configuration Manager.
Using Discovery Classes
The following ConfigMgr discovery tasks populate the SQL views that start with either v_R_* or v_RA_* (see Table 21.1):
![]() Active Directory System Discovery
Active Directory System Discovery
![]() Active Directory User Discovery
Active Directory User Discovery
![]() Heartbeat Discovery
Heartbeat Discovery
![]() Network Discovery
Network Discovery
For more information about ConfigMgr discovery, see Chapter 9, “Client Management.”
TABLE 21.1 Discovery Data Views
SQL View |
Description |
|
Lists all systems discovered by ConfigMgr. |
|
Lists all users discovered by ConfigMgr. |
|
Lists all active clients within ConfigMgr. This is a subset of |
Using Hardware Inventory Classes
You would think, based on the name alone, that hardware inventory classes would provide only details about the physical computer. This actually is not the case, as hardware inventory classes collect information from Windows Management Instrumentation (WMI) and the Windows Registry, as well as the actual hardware details for each ConfigMgr client. This class is therefore used within most queries, as it provides the widest range of information available about individual computers, from software installed to free disk space. ConfigMgr asset intelligence information falls into this class as well.
These inventory classes also maintain history data that you can use in your reports. No other inventory classes maintain history data. As a general rule, there are two SQL view name identifiers for these items:
![]() The SQL view names starting with
The SQL view names starting with v_GS_* identify the latest and current hardware inventory data.
![]() The
The v_HS_* views identify history data for the hardware inventory.
Table 21.2 and Table 21.3 provide listings of hardware data views.
TABLE 21.2 Current Hardware Data Views
SQL View |
Description |
|
Lists basic details about a computer, such as manufacturer, model, and username. |
|
Provides details about hard drives attached to a computer. |
|
Provides details about 32-bit Add/Remove Programs data for computers. |
|
Provides details about 64-bit Add/Remove Programs data for computers. |
TABLE 21.3 History Hardware Data Views
SQL View |
Description |
|
Provides history data for the basic details of a computer. |
|
Provides history data for the hard drives attached to a computer. |
|
Provides history data for the 32-bit Add/Remove Programs data for computers. |
|
Provides history data for the 64-bit Add/Remove Programs data for computers. |
In addition to these SQL views, there is one very important SQL view that does not follow the naming rules in this section: the v_ADD_REMOVE_PROGRAMS SQL view. This SQL view provides the combined details of the v_GS_ADD_REMOVE_PROGRAMS and v_GS_ADD_REMOVE_PROGRAMS_64 views. This view is extremely helpful for viewing both 32-bit and 64-bit Add/Remove Programs entries.
ConfigMgr Software Inventory Classes
The software inventory class SQL views are mislabeled, as they do not provide a software inventory; they are actually file inventories. The software inventory provides header details about the files inventoried. This feature is not enabled by default, and even after being enabled, it must be configured in order for those files and locations to be inventoried. Unlike the other inventory methods, the authors generally do not recommend that this inventory method be enabled, due to its overhead and the limitations imposed. Limitations include the following:
![]() A four-hour runtime limit on the software inventory cycle before the inventory is terminated (without an error message returned to ConfigMgr)
A four-hour runtime limit on the software inventory cycle before the inventory is terminated (without an error message returned to ConfigMgr)
![]() Incomplete inventory (Although it is not obvious, not all folders would be inventoried on a client due to file encryption, file security, deliberate exclusions by the ConfigMgr client, and so on.)
Incomplete inventory (Although it is not obvious, not all folders would be inventoried on a client due to file encryption, file security, deliberate exclusions by the ConfigMgr client, and so on.)
Table 21.4 lists the two SQL views where most information is located when this inventory collection method is enabled and configured correctly.
TABLE 21.4 Current Software Data Views
SQL View |
Description |
|
Provides status details about the last software scan cycle. |
|
Provides details about all inventory files. |
Using Software Update Inventory Classes
Software update details for a computer are found in the two SQL views listed in Table 21.5. It can be difficult to write software update SQL queries and correctly report the software update details. Care should be taken to confirm the results prior to creating a report.
TABLE 21.5 Software Update Data Views
SQL View |
Description |
|
Provides compliance status details for each PC’s software update. |
|
Provides details about software update categories. |
About Software Metering Inventory Classes
Software metering is an optional component in ConfigMgr. Once enabled and configured, the ConfigMgr client can collect software usage information for the rules you configure. Software metering can help you understand the software being used in your environment. Table 21.6 lists the software metering data views.
TABLE 21.6 Software Metering Data Views
SQL View |
Description |
|
Lists all gathered software metering data. |
|
Lists all software metering rules. |
About Status Message Classes
Status messages provide details about the status of ConfigMgr client/server actions. For example, when a deployment is sent to a ConfigMgr client, the client sends a status message to the ConfigMgr server, saying that it has received the deployment notice. When the ConfigMgr client starts to download an application, it sends a status message indicating that the download has started. Table 21.7 lists the common status message classes.
TABLE 21.7 Status Message Data Views
SQL View |
Description |
|
Provides status messages. This view is generally used in conjunction with |
|
Lists the attributes for a status message. |
|
Lists status messages. |
About State Messages Classes
Similar to status messages, state messages provide the state of items such as client health, configuration items, and software updates. State messages are broken into topic types that identify the client component, and the StateID, which identifies a specific status for the component. Each topic type contains multiple state IDs. The v_StateName SQL view maps topic types and their respective state IDs to a descriptive state name. Table 21.8 lists the state message views.
TABLE 21.8 State Message Views
SQL View |
Description |
|
Maps topic types and their state IDs to descriptive names. |
|
Provides the last client health state reported by ConfigMgr clients. |
|
Provides the evaluation state messages for assigned configuration items (CIs). |
|
Provides the compliance state for software updates scanned by ConfigMgr clients. |
Using Collection Data Classes
Table 21.9 lists the collection data classes, which are popular SQL views because most objects (users, computers, mobile device, and AD security groups) in ConfigMgr are listed within collections. These SQL views are generally used to limit the results to a particular collection.
TABLE 21.9 Collection Data Views
SQL View |
Description |
|
Lists all collections and the |
|
Lists the membership of each collection (user account/computer/security group). |
Introducing Transact-SQL
SQL Server uses Transact-SQL, also referred to as SQL or T-SQL, to query SQL databases. The language will be familiar to many ConfigMgr administrators, as it is the parent language to WMI Query Language (WQL), which is used to create collections in ConfigMgr.
It is important to have a good understanding of how to create T-SQL queries, as a poorly designed query can be a significant impact on a SQL database. This section provides basic information about T-SQL and discusses how to execute a T-SQL query prior to using the query in a report. This section only covers the basics needed for creating reports; be aware that there is significantly more to T-SQL than what is discussed in this chapter.
Introducing SQL Server Management Studio
A number of tools are available for executing T-SQL queries against a SQL database; the most popular one is SQL Server Management Studio, introduced in Chapter 3, “Looking Inside Configuration Manager.” This GUI tool allows you to interface with SQL Server and execute queries against the ConfigMgr database. As a best practice, you should not execute T-SQL queries against a production database; use a copy of the ConfigMgr database or execute queries in your development environment. Avoiding running against production helps prevent any issues that might arise from poorly written T-SQL queries. The authors also recommend that SQL Server Management Studio be installed locally on ConfigMgr administrators’ workstations when they need to create reports, as Microsoft does not recommend building or creating queries and reports on your ConfigMgr site server. This allows the ConfigMgr administrator the option of using a copy of the database on his or her local computer or connecting to the development environment.
To get started with SQL Server Management Studio, launch the tool, log on to your ConfigMgr SQL Server, and then change the database to the ConfigMgr database.
![]()
SELECT
![]()
FROM
![]()
WHERE
![]()
ORDER BY
These sections form the basic core of a SQL query. Not all these sections are mandatory to obtain results from a query; however, they are recommended to produce clear and easy-to-read results.
To help better explain each section, Listing 21.1 shows the breakdown of these sections.
LISTING 21.1 SQL Query to Locate All Computers Within the Odyssey Domain
SELECT
  RV.Netbios_Name0,
  RV.Operating_System_Name_and0,
  RV.AD_Site_Name0
FROM
  dbo.v_R_System RV
WHERE
  RV.Resource_Domain_OR_Workgr0 = 'Odyssey'
ORDER BY
  RV.Netbios_Name0,
  RV.Operating_System_Name_and0,
  RV.AD_Site_Name0
Using the SELECT Statement
A T-SQL query starts with the SELECT section. This section indicates the columns within a SQL view(s) that will be included in the results of your query.
Listing 21.2 shows the lines comprising the SELECT section. The Netbios_Name0, Operating_System_Name_and0, and AD_Site_Name0 columns are identified in Listing 21.2. Notice that they are separated by commas.
LISTING 21.2 SELECT Section of a T-SQL Query
SELECT
  RV.Netbios_Name0,
  RV.Operating_System_Name_and0,
  RV.AD_Site_Name0
About the FROM Statement
The FROM section tells SQL Server Management Studio where in the ConfigMgr database to find the information used within the query, as shown in Listing 21.3. It is also in the FROM section that you can join multiple SQL views together by defining a common column between the SQL views.
LISTING 21.3 FROM Section of a T-SQL Query
FROM
  dbo.v_R_System RV
The WHERE Statement
The WHERE section is an optional section in a T-SQL query that T-SQL uses to limit the results of the query. This is useful when you want to see just a small portion of the information. The sample query in Listing 21.4 limits the results to displaying only computers with the computer domain 'Odyssey' instead of all computers.
LISTING 21.4 WHERE Section of a T-SQL Query
WHERE
  RV.Resource_Domain_OR_Workgr0 = 'Odyssey'
Using ORDER BY
The T-SQL section shown in Listing 21.5 allows for the column results to be sorted; the default sort order is alphabetical. Sorting the results makes them easier to read. Very much like the WHERE statement, this is an optional component. For performance reasons, the authors recommend that sorting be done within T-SQL on the server rather than within reports.
LISTING 21.5 ORDER BY Section of a T-SQL Query
ORDER BY
  RV.Netbios_Name0,
  RV.Operating_System_Name_and0,
  RV.AD_Site_Name0
Using Operators
With any computer language, there are a number of operators that allow you to perform operations on SQL data. T-SQL is no exception; Table 21.10 lists the common SQL operators.
TABLE 21.10 Common SQL Operators
Operator |
Description |
|
Addition |
|
Subtraction |
|
Multiplication |
Division |
|
|
Equals |
|
Greater than |
|
Less than |
|
String wildcard, used in |
|
Logical |
|
Logical |
|
Logical |
|
Logical |
|
Logical |
TIP: COMPLETE LIST OF OPERATORS
For a complete list of available operators, see the “Operators (T-SQL)” section in the T-SQL online help, available at https://docs.microsoft.com/sql/t-sql/language-elements/operators-transact-sql.
Building a Report Design
This section discusses the importance of report design, styles, and consistency throughout your reports. These concepts are important as following them can help you project a professional look and feel for all your reports. If your reports lack a consistent look and feel, they appear disjointed and, therefore, unprofessional.
The key to ensuring a useful report or dashboard is to ensure that you are consistent with report styles and appearance. When you take time to ensure that you are consistent—with your T-SQL query, the report style, with colors and fonts, and even with report titles—your reports can’t help but look and feel professional.
About Report Series
As a general rule, there is a flow to reports and dashboards:
![]() You start by creating a summary report or dashboard that shows the overall status of what it is you are reporting.
You start by creating a summary report or dashboard that shows the overall status of what it is you are reporting.
![]() You then allow the users to drill though to a list report that provides more details about the computers or objects.
You then allow the users to drill though to a list report that provides more details about the computers or objects.
![]() Finally, you drill through to the details about the specific computer or object.
Finally, you drill through to the details about the specific computer or object.
This flow provides a natural progression from summary information to full details for a computer. In report terminology, this would be the Dashboard/Count, List, and Details report types.
Following is an example of a sample report series:
![]() Overall Software Update Status: This count report (dashboard) shows the overall software update status for a company.
Overall Software Update Status: This count report (dashboard) shows the overall software update status for a company.
![]() List of PCs by Missing Software Updates: This report provides a list of computers missing one or more software updates.
List of PCs by Missing Software Updates: This report provides a list of computers missing one or more software updates.
![]() Software Update Details for a Computer: This report shows a detailed list of all software updates for a specific computer.
Software Update Details for a Computer: This report shows a detailed list of all software updates for a specific computer.
Incorporating a general report series design provides value for everyone from your chief technology officer (CTO) to your help desk staff. Here’s how:
![]() The CTO can see high-level information needed to make upgrade/purchase decisions about the environment.
The CTO can see high-level information needed to make upgrade/purchase decisions about the environment.
![]() The service desk manager can drill down to see additional details such as the computers or users that will be affected.
The service desk manager can drill down to see additional details such as the computers or users that will be affected.
![]() A frontline service desk technologist can view what software products are installed on a specific computer he or she is troubleshooting or upgrading.
A frontline service desk technologist can view what software products are installed on a specific computer he or she is troubleshooting or upgrading.
Creating Consistent Reports
Designing consistent-appearing reports ensures that your dashboards and reports look professional. While it might seem like a lot of work initially to make sure all your reports look similar, the payback comes when users actually use your reports. Figure 21.2 shows the areas where you should be consistent with your reports. Table 21.11 provides details about the options to use for your reports to appear consistent, with the numbers in the table corresponding to the numbers in Figure 21.2.

FIGURE 21.2 Report style locations.
TABLE 21.11 Consistent Report Options
Item |
Object |
Elements |
1 |
Header |
Text Color, Font, Size, Background Color |
2 |
Sub-Header |
Text Color, Font, Size, Background Color |
3 |
Table Header |
Text Color, Font, Size, Background Color |
4 |
Row |
Text Color, Font, Size, Alternating Row Colors |
5 |
Logo |
Image Type, Size, URL |
6 |
Footer |
What should be included in the footer, including Page Number, Logo, Date & Time, Background Color, and so on. |
The authors suggest that when you define style guides for your reports, you should start with your company’s graphic designer or webmaster. These individuals should be able to provide you with your organization’s style guide. If your company does not have a graphic designer or webmaster, use Table 21.11 to define your own report style guide.
Building a Basic Report
This section discusses a number of items, from report design to creating a basic report. It begins by discussing report creation tools and then moves on to report design and then finally to creating a report.
Understanding how to build a basic report is important, as this report type is the foundation on which all reports are created. It does not matter if the report is a simple report or a very complex dashboard with multiple distinct areas. Much as you need a strong foundation for a house, you need to have a good understanding of how to create a basic report, or you will have difficulty creating complex reports.
Tools for Creating Reports
Two primary tools exist to create SSRS reports for ConfigMgr:
![]() SQL Server Data Tools-Business Intelligence (SSDT-BI) for Visual Studio 2013
SQL Server Data Tools-Business Intelligence (SSDT-BI) for Visual Studio 2013
![]() Report Builder
Report Builder
These tools are also used to design SSRS reports for other System Center products, such as Operations Manager and Service Manager. All examples in this chapter use SSDT-BI 2014 for Visual Studio 2013, which the authors suggest you use for creating reports. Table 21.12 lists some of the reasons for this recommendation.
TABLE 21.12 Comparing SSDT and Report Builder
SSDT |
Report Builder |
Can open and work on multiple reports at one time. |
Only able to work on a single report at once. |
Can cut/copy and paste between reports. |
Because only one report can be open at once, copy and paste is not available. |
Can easily create drill-down links in reports. |
Although it is possible to create drill-down links, it is very cumbersome. |
Can control every feature and setting within the report. |
Some features are missing and cannot be modified or controlled in Report Builder. |
Note that there are multiple versions of report authoring tools available, including several versions of SSDT and Business Intelligence Development Studio (BIDS), as well as multiple versions of the Report Builder tool. It can be challenging to understand report compatibility for the different versions of Reporting Services. Table 21.13 identifies the different SSRS versions and their compatible Report Definition Language (RDL), generated from the various tools. It is important to create reports using a tool that generates files supporting the installed SSRS version in your environment.
TABLE 21.13 SSRS-Compatible Reports
SSRS Version |
SSDT and BIDS Versions |
Report Builder Versions |
SQL Server 2016 |
SSDT-BI 2016 for Visual Studio 2015 SSDT-BI 2014 for Visual Studio 2013 SSDT-BI 2012 for Visual Studio 2012 BIDS 2008 R2 or BIDS 2008 or BIDS 2005 |
Report Builder 1.0, 2.0, 3.0 |
SQL Server 2014 |
SSDT-BI 2014 for Visual Studio 2013 SSDT-BI 2012 for Visual Studio 2012 BIDS 2008 R2 or BIDS 2008 or BIDS 2005 |
Report Builder 1.0, 2.0, 3.0 |
SQL Server 2012 |
SSDT-BI 2014 for Visual Studio 2013 SSDT-BI 2012 for Visual Studio 2012 BIDS 2008 R2 BIDS 2008 BIDS 2005 |
Report Builder 1.0, 2.0, 3.0 |
SQL Server 2008 R2 |
SSDT-BI 2014 for Visual Studio 2013 SSDT-BI 2012 for Visual Studio 2012 BIDS 2008 R2 BIDS 2008 BIDS 2005 |
Report Builder 1.0, 2.0, 3.0 |
SQL Server 2008 |
BIDS 2008 BIDS 2005 |
Report Builder 1.0, 2.0 |
Getting Started with SSDT-BI
Before creating your first SSRS report, you need to create a project (or a project within a solution) in SSDT-BI. Perform the following steps to create a new project for a fictional company named Odyssey:
1. From the Windows Start menu, navigate to Microsoft SQL Server 2014 -> SQL Server Data Tools for Visual Studio 2013.
2. At the Microsoft Visual Studio start page, click File -> New -> Project to create a new project.
3. In the New Project window, shown in Figure 21.3, select Report Server Project from the Business Intelligence node under Templates. At the bottom of the window, enter a name for the project—which automatically populates the Solution name field—and specify a location to store the project.
Notice that the Create directory for solution check box is checked by default. This option creates a folder under the location you have specified to contain the project files, configuration, and reports. Click OK to create the project.

FIGURE 21.3 Creating a report project.
TIP: RECOMMENDED PROJECT LOCATION
The authors recommend storing your project on a network share where all ConfigMgr administrators and report creators can access the project. This enables all report creators to share already created reports as well as report templates.
The authors also suggest including this network share in any backup solution to ensure that it is recoverable if the data is lost or corrupt.
4. Once the project is created, add a new shared data source. Under the Solution Explorer window, on the top-right side of the Visual Studio window, right-click Shared Data Sources and select Add New Data Source.
5. On the Shared Data Source Properties window, specify a name for the shared data source and click Edit to configure a connection string.
6. In the Connection Properties window, specify the server name of the server containing the ConfigMgr database and then use the dropdown to specify the ConfigMgr database name under the Select or enter a database name field.
7. Click Test Connection to ensure that the connection is successful and then click OK to close the Connection Properties window.
8. Confirm that the settings for the shared data source properties are correct and click OK.
After the solution/project and share data source have been created, they can be used by multiple reports moving forward. This is where SSDT-BI shines: It allows you to work on multiple reports at the same time or just copy and paste between reports to reduce duplication of effort.
Creating a Basic Report
With the prerequisites in place, you can create reports and dashboards based on your needs. Use the following steps to create a report:
1. From the Solutions Explorer window, on the far right side of SSDT, right-click the Reports folder and select Add -> New Item.
2. In the Add New Item window, select Report from the list of items, specify a name for the report, such as System Details, and click Add.
The center window of SSDT now contains a new blank report that is ready to be populated.
Creating a Data Source
In order for a report to query the ConfigMgr database, the report must know which shared data source to use. You identify this by linking the project shared data source to the report itself. Follow these steps to create a data source within the report:
1. In the Report Data window, on the left side of SSDT, right-click the Data Sources folder and select Add Data Source (see Figure 21.4).

2. In the Data Source Properties window, specify a name for the data source and select Use shared data source reference. From the dropdown, select the shared data source added in the Getting Started with SSDT-BI section (OdysseyReportDS) and click OK.
Creating a Dataset
After the data source is linked to the shared data source, you need to create a dataset. The dataset is where you insert the T-SQL query that you created for this report. A report can have more than one dataset; for example, you might have one dataset to populate a prompt and another dataset for the report itself. Follow these steps to create a dataset:
1. In the Report Data window, on the left side of SSDT, right-click the Datasets folder and select Add Dataset (see Figure 21.5).

FIGURE 21.5 Adding a dataset.
2. In the Dataset Properties window, specify a name for the dataset and then select Use a dataset embedded in my report. From the Data source dropdown, select the data source you created in the “Creating a Data Source” section of this chapter. In the Query field, paste the query previously created in SQL Server Management Studio. (This example uses the query in Listing 21.1, 21list01_System Details.sql, which is included in the online content for this book. For additional information, see Appendix D, “Available Online.”) Click OK to create the dataset.
Accessing the Toolbox
On the far left side of SSDT is the Toolbox menu, which includes items such as tables, charts, and text boxes. By default, the Toolbox menu is automatically hidden when not in use, and it is displayed only when you click the tab shown in Figure 21.6. You can use the pin feature to pin open the toolbox while working on a report.
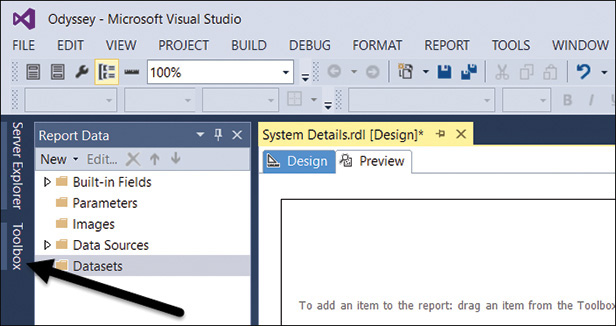
FIGURE 21.6 Opening the Toolbox menu to display report items.
Many report items are available to add to your reports:
![]() Pointer: The pointer is the default selected item when using SSDT. This is the simple mouse pointer that allows you to select items within a report.
Pointer: The pointer is the default selected item when using SSDT. This is the simple mouse pointer that allows you to select items within a report.
![]() Textbox: This item allows you to enter simple text for your report, such as a label, or specify expressions to be populated when the report is executed, such as the current date or page number.
Textbox: This item allows you to enter simple text for your report, such as a label, or specify expressions to be populated when the report is executed, such as the current date or page number.
![]() Line: The line item adds a simple line to your report for visual effect. It can be used to separate sections or information.
Line: The line item adds a simple line to your report for visual effect. It can be used to separate sections or information.
![]() Table: The table item is similar to the properties of an Excel spreadsheet. In an SSDT table, you can group data together, identify header columns and rows, and more. Tables are some of the most popular items used in reporting.
Table: The table item is similar to the properties of an Excel spreadsheet. In an SSDT table, you can group data together, identify header columns and rows, and more. Tables are some of the most popular items used in reporting.
![]() Matrix: A matrix is a special type of table similar to a pivot table in Microsoft Excel. Data in a matrix can be grouped together and can grow both by columns and rows.
Matrix: A matrix is a special type of table similar to a pivot table in Microsoft Excel. Data in a matrix can be grouped together and can grow both by columns and rows.
![]() Rectangle: The rectangle item allows you to group other report objects together and treat them as a single object within a report.
Rectangle: The rectangle item allows you to group other report objects together and treat them as a single object within a report.
![]() List: A list is a grouping of report items. It allows you to add items from other reports in the list and display them in free form instead of within a grid.
List: A list is a grouping of report items. It allows you to add items from other reports in the list and display them in free form instead of within a grid.
![]() Image: The image item allows you to import images or pictures into a report. This item is commonly used to display a company logo in the header or footer sections of a report.
Image: The image item allows you to import images or pictures into a report. This item is commonly used to display a company logo in the header or footer sections of a report.
![]() Subreport: This item allows you to embed another report within the current report. The body section of the targeted report will be displayed within this item when the report is executed.
Subreport: This item allows you to embed another report within the current report. The body section of the targeted report will be displayed within this item when the report is executed.
![]() Chart: This item creates a chart within the report to represent your data. Various kinds of charts that can be selected, such as a bar, line, pie, or pyramid charts.
Chart: This item creates a chart within the report to represent your data. Various kinds of charts that can be selected, such as a bar, line, pie, or pyramid charts.
![]() Gauge: The gauge item can display a value, an expression, or a field in either a radial or linear type of gauge. Gauges are similar to charts; however, they are intended to display summary data.
Gauge: The gauge item can display a value, an expression, or a field in either a radial or linear type of gauge. Gauges are similar to charts; however, they are intended to display summary data.
![]() Map: This item allows you to display data against a map. There are two types of map charts:
Map: This item allows you to display data against a map. There are two types of map charts:
![]() Marker Map: This type of map allows you to pinpoint a location.
Marker Map: This type of map allows you to pinpoint a location.
![]() Bubble Map: A bubble map shows the number of items for a given area.
Bubble Map: A bubble map shows the number of items for a given area.
![]() Data Bar: This item displays a visual indicator of a value. It tends to be used within a table item.
Data Bar: This item displays a visual indicator of a value. It tends to be used within a table item.
![]() Sparkline: Similar to a data bar, a sparkline is often used within a table. This is a miniature line chart without any labels.
Sparkline: Similar to a data bar, a sparkline is often used within a table. This is a miniature line chart without any labels.
![]() Indicator: An indicator is similar to a gauge; it displays minimal information so that at a quick glance, a user can determine the value that is represented. In most cases, indicators are used within tables.
Indicator: An indicator is similar to a gauge; it displays minimal information so that at a quick glance, a user can determine the value that is represented. In most cases, indicators are used within tables.
Adding a Table to a Report
In most cases, the results of a report query (dataset) are displayed as either a table or chart within a report. This section shows you how to add a table to a report.
Tables can be used to display the results of a query (dataset) in a report. Within the table, you can add the individual columns you want to display. When the report is executed, the query results populate the table item. Follow these steps to add a table and populate the query columns to the report:
1. From the toolbox, drag the table item to the blank report. Notice that, by default, the table item creates three columns, as displayed in Figure 21.7.

2. Now add the dataset to the table. In the Report Data window, expand the Datasets folder and expand the dataset you created (in this case, SystemDetailsDS). Drag each column from the dataset into the corresponding column in the table. When this is complete, your table will be similar to the one shown in Figure 21.8.

FIGURE 21.8 Dataset columns added to a table item in a report.
3. With the dataset added to the table item, you can properly format the table. To do so, make the following changes to the table:
![]() Modify the labels of the headers in the first row to appropriate titles that represent the data. Accomplish this by double-clicking each header cell and replacing the text
Modify the labels of the headers in the first row to appropriate titles that represent the data. Accomplish this by double-clicking each header cell and replacing the text Netbios Name0, Operating System Name and0, and AD Site Name0.
![]() Set the font style of the header row to bold.
Set the font style of the header row to bold.
![]() Adjust the widths of the table columns to an appropriate size for the data to be displayed. Avoid cutting off information or having the row expand vertically to fit the data output.
Adjust the widths of the table columns to an appropriate size for the data to be displayed. Avoid cutting off information or having the row expand vertically to fit the data output.
![]() Adjust the table size to have it stretch the width of the entire page—but ensure that it does not affect the width of the page. The page width should not exceed 8 inches.
Adjust the table size to have it stretch the width of the entire page—but ensure that it does not affect the width of the page. The page width should not exceed 8 inches.
Previewing a Report
SSDT-BI lets you preview a report to see how it will look on your SSRS server. To preview a report, perform the following steps:
1. Click Preview (see Figure 21.9) at the top of the report to view the end product. The preview action executes the query in the dataset and populates the report items with data.
2. Ensure that everything displays as intended and that the columns are appropriate widths, such that no information is cut off or missing. If additional changes are required, make any necessary adjustments and preview your report again to ensure that those items are resolved. To return to Design mode after previewing is complete, click Design at the top of the report.

FIGURE 21.9 Location of the Preview tab.
Publishing a Report
Once you have created a report, you can publish it to the ConfigMgr folder on your SSRS server. It takes approximately 10 minutes for ConfigMgr to evaluate the new report and make it available within the console. The authors recommend that reports be accessed from the website instead of the console for performance reasons, as discussed earlier in this chapter, in the “Notable Reporting Point Information” section. Using the SSRS website also allows non-ConfigMgr administrators to access a report without the need to access the ConfigMgr console.
There are two methods to publish a report: manually adding a report to SSRS and publishing a report from SSDT-BI to the SSRS website. These are discussed in the following sections.
Manually Adding a Report to SSRS
A simple method of adding a report to SSRS is to manually browse to the SSRS website and upload a report by browsing for the .rdl file. The downside of this method is that it allows you to upload only one report at a time. To manually add a report to the SSRS website, follow these steps:
1. Open a web browser and browse to your SSRS report website, http://armada/Reports.
2. On the SQL Server Reporting Services home page, click the ConfigMgr Reporting Services Point folder (ConfigMgr_CAS). You now see a list of ConfigMgr folders, which were created during the installation of the reporting services point in ConfigMgr. These contain the out-of-box reports.
3. Create a new folder to store your custom created reports by clicking New Folder.
4. Specify a name for the new folder and click OK. A description for the folder can also be specified, although it is not required.
5. From the list of folders, click the folder created in step 4.
6. In the new folder, click Upload File. In the Upload File page, click Browse next to the File to upload field. Browse to your SSDT project location, select a report RDL file to upload, and then click Open. The Name field for the report is populated by default with the name of the RDL file, and it can be changed if desired. Click OK to upload the selected report.
7. When you are redirected to the folder view where the report was uploaded, click the newly added report to execute it.
8. When you receive the error shown in Figure 21.10, indicating that the shared data source is not valid for use from the SSRS website, resolve this error by updating the report’s data source in the properties of the report on the website. To do this, go back to the folder view, hover the cursor over the report name, click the downward-pointing arrow that appears, and select Manage, as shown in Figure 21.11.

FIGURE 21.10 SSRS invalid source error.

9. In the report’s properties page, select the Data Sources tab from the left pane. Click Browse next to the Select a shared data source option. Under the location field, expand the ConfigMgr folder, scroll to the bottom of the list, and select the data source item (the last item identified by the long unique ID between curly braces), as shown in Figure 21.12. Click OK.
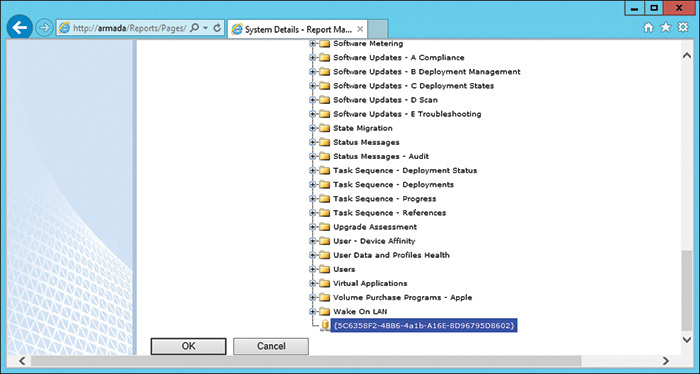
FIGURE 21.12 Selecting the data source item from the list and clicking OK.
10. Back in the Data Sources page, click Apply at the bottom of the page to save the changes.
11. To test the changes and run the report, click the report name at the top of the page or go back to the folder view and click the report. Confirm that the report now runs without errors and displays properly.
12. To add additional reports now that you have created a folder, repeat steps 6 through 11.
Publishing Reports from SSDT to the SSRS Website
Manually adding each individual report to the SSRS website may be acceptable when you have a small number of reports; however, it can be time-consuming when there are dozens of custom created reports. SSDT provides an option to publish reports directly to the SSRS website; it refers to this process as deploying. Perform the following steps to configure the required deployment options and publish reports from SSDT without having to manually upload each report:
1. In SSDT, open the SSRS project that contains your custom reports.
2. From the SSDT menu at the top, select PROJECT and click Properties, shown in Figure 21.13.

FIGURE 21.13 Selecting PROJECT from the SSDT menu and clicking Properties.
3. In the project’s properties page, click Configuration Manager at the top right of the page.
4. In the Configuration Manager page, in the Configuration column of the project row, use the dropdown list to change the value to Release, as shown in Figure 21.14. Ensure that the Build and Deploy column values are checked and click Close.

FIGURE 21.14 Setting the project configuration to Release.
5. In the properties page, under the Deployment section, enter the SSRS virtual directory URL under the TargetServerURL value. For this example, the value is http://armada/ReportServer. Optionally, to set the folder in SSRS to store your reports, set the folder path as the TargetReportFolder value. The value is set to ConfigMgr_CAS/Odyssey to store the reports under the same folder created in the “Manually Adding a Report to SSRS” section, earlier in this chapter. Click OK when complete as shown in Figure 21.15 to apply your changes, and then close the Property window.
TIP: TARGETSERVERURL VALUE
To get the proper TargetServerURL value, find the web service URL in the Reporting Services configuration on the SSRS server. By default, this path is http://<servername>/ReportServer.

FIGURE 21.15 Completed properties page for deploying reports.
6. Before publishing a report to SSRS, you must publish the shared data source created in SSDT. To publish the data source, expand the Shared Data Source folder in the Solution Explorer window, right-click the .rds object, and select Deploy.
7. When the shared data source is deployed to SSRS, right-click a report in the Solution Explorer window and select Deploy.
8. To confirm that the report is deployed, use a web browser to navigate to the SSRS website and browse to the folder identified in the TargetReportFolder value from step 5. Verify that the report is listed in the folder and runs successfully, without errors.
TIP: DEPLOYING AN ENTIRE PROJECT
Rather than deploying one report at a time, you can deploy an entire project to SSRS by right-clicking the project name in the Solution Explorer and selecting Deploy. All shared data sources and all reports will be published to SSRS. Once all reports are deployed, any actions set on objects to go to a report will function as they did in SSDT Preview mode.
NOTE: PUBLISHING REPORTS WITH SSDT
Using the deployment method described in this section means your custom reports are not using the default ConfigMgr data source. You must therefore update this data source any time the execution account username and password change. Alternatively, you could manually reset all reports to use the default ConfigMgr data source, as outlined in steps 6–10 in the “Manually Adding a Report to SSRS” section, earlier in this chapter.
Advanced Reporting Concepts
There are many aspects to creating reports for ConfigMgr SSRS; this chapter only touches on the basics of writing ConfigMgr SSRS reports. Considerably more could be discussed but, due to space limitations, could not be included in this book. The following are some Advanced Reporting topics you might want to explore:
![]() Installing SSRS
Installing SSRS
![]() Installing the ConfigMgr RP
Installing the ConfigMgr RP
![]() Additional SQL details:
Additional SQL details:
![]() Explaining More operators (
Explaining More operators (DISTINCT, GROUP BY, and so on)
![]() Explaining SQL functions (
Explaining SQL functions (COUNT, MAX, MIN, GETDATE, CASE, and so on)
![]() Explaining SQL joins (
Explaining SQL joins (LEFT OUTER JOIN, RIGHT OUTER JOIN, and so on)
![]() Providing Examples for the various configuration items
Providing Examples for the various configuration items
![]() Installing SSDT-BI and SQL Server Management Studio tools
Installing SSDT-BI and SQL Server Management Studio tools
![]() More in-depth discussion on report series
More in-depth discussion on report series
![]() Additional SSRS report features:
Additional SSRS report features:
![]() Adding prompts to a report
Adding prompts to a report
![]() Interactive sorting
Interactive sorting
![]() Report templates
Report templates
![]() Report drillthrough
Report drillthrough
![]() Custom color palettes
Custom color palettes
![]() Custom code in an SSRS report
Custom code in an SSRS report
![]() SSRS website features:
SSRS website features:
![]() Emailing reports
Emailing reports
![]() Exporting reports
Exporting reports
![]() Role-based administration (RBA) and reporting
Role-based administration (RBA) and reporting
![]() How to update an existing T-SQL query to become an RBA query
How to update an existing T-SQL query to become an RBA query
![]() Updating reports for RBA
Updating reports for RBA
![]() Creating RBA roles within ConfigMgr for reporting
Creating RBA roles within ConfigMgr for reporting
![]() Troubleshooting tips
Troubleshooting tips
All these topics and more are covered in the deep dive provided by System Center Configuration Manager Reporting Unleashed (Sams Publishing, 2016).
Following are some best practices when creating reports:
![]() Use only SQL views within your T-SQL queries.
Use only SQL views within your T-SQL queries.
![]() Use SSDT-BI to create reports and dashboards.
Use SSDT-BI to create reports and dashboards.
![]() Create a common look and feel for reports and dashboards.
Create a common look and feel for reports and dashboards.
Summary
ConfigMgr provides a number of reports; however, they never seem to answer the questions asked by management, service desk managers, and end users. Therefore, being able to create meaningful custom reports is truly beneficial to any company.
This chapter touched on where information can be found in the ConfigMgr database. It discussed the basic structure of a T-SQL query that can be used in ConfigMgr SSRS reports. It also discussed the importance of a report series and having a consistent report look and feel to provide more professional ConfigMgr reports. The chapter showed that by using SSDT-BI, you can create meaningful custom reports that will benefit your management, service desk managers, and end users. This chapter also showed how to publish reports to ConfigMgr.