
Chapter 21
Putting It All Together
IN THIS CHAPTER
![]() Watching the market’s direction
Watching the market’s direction
![]() Focusing on particular sectors
Focusing on particular sectors
![]() Using customized scans
Using customized scans
![]() Managing your portfolio of winners and losers
Managing your portfolio of winners and losers
In earlier parts of this book, you discover how to build stock charts and explore all the tools you can add to those charts. In this chapter, we take a closer look at how you can put all this information together to improve your stock trading decisions.
 To get started, you may want to take advantage of the 30-day free trial at
 StockCharts.com so you can try out all the advanced options we talk about in this book. To sign up, go to StockCharts.com and click the green button that says, “Free 1-Month Trial.” You can access the analysis tools we show you from the Members page. The Control Center resides on the left side of the Members tab. Some of the tools described here are for Extra members and PRO members. During the 30-day free trial, try to use the PRO-level tools. If you decide you don’t need them, you can start as a basic member. The advanced tools will be grayed out on the Control Center.
There is a lot of science around risk management and trading strategies. This book gives you a strong base to start your charting. For trading strategies and risk management ideas, consult other books in the For Dummies series. In particular, Trading For Dummies, 4th Edition, by Lita Epstein, MBA, and Grayson D. Roze (Wiley) also uses all StockCharts.com methodologies.
Gauging the Market’s Direction
To gauge the overall direction of the market, watch two indexes: the NASDAQ 100 and the S&P 500. The NASDAQ 100 ($NDX) is typically associated with high technology and rapid growth. The S&P 500 ($SPX) is a broad, stable index with massive companies that market products around the world. Understanding how these two indexes are performing will go a long way toward managing the upside opportunity and the downside risk in the market. Asking these four questions is a great start to analyzing the market direction:
- Is the market topping?
- What are the leading sectors?
- Is market breadth healthy?
- Are the two main indexes above the 40-week moving average?
In the following sections, we take a closer look at how to spot a market top, discover which sectors are leading, and determine the strength of the market.
With the massive market corrections in 2000–2002 and 2007–2009, you have some of the best training examples for researching how major markets top out and warning signs to watch for. Sudden, unknown world events can never be priced in.
 Nothing guarantees a stable market, but the market direction tools in this section can definitely help keep you aware of a strong investing backdrop when the market structure is largely supportive for going higher.
Market tops
One of the main issues to review as you gauge the market’s direction is how to avoid being invested in terrible stocks when a market correction occurs. You don’t want to put money to work only to lose money right away, so understanding what makes a good backdrop is important.
Market tops (introduced in Chapter 9) take time to develop. Some sector has to get crushed to start breaking down the market. Using stock charts, you have a better chance of finding that market top and getting out before the stock sector collapses. By avoiding weak sectors, your portfolio has time to adapt to changing market conditions.
Here’s an example: In 2000, the technology sector collapsed in March, which is the obvious one you hear about. However, the number of advancing stocks versus declining stocks on the New York Stock Exchange (NYSE) was falling for two years before suggesting a bubble in technology. In the early days of March 2000, only a few technology stocks were carrying the NASDAQ market higher.
Six months later in September 2000, the S&P 500 ($SPX) was very close to making new highs, but the NASDAQ was down by 50 percent. The chart in Figure 21-1 can be created by changing the chart type to cumulative from candlestick in the Chart Attributes area and using the ticker symbol $NYAD (the symbol for the NYSE) for the main chart. The cumulative chart forms a smooth curved line, called an advance/decline line, rather than a candlestick chart, which can look spiky and hard to read. This chart just gives you another way to look at the advances and declines of the market. Figure 21-1 shows you the advance/decline line from 1993 to 2017 for the S&P 500 Large Cap Index, the NYSE, and the NASDAQ 100.

Chart courtesy of StockCharts.com
FIGURE 21-1: Advance/decline lines.
Looking at advance/decline lines, you can quickly pick up some clues about stock market changes. Here are some examples of what you can see using an advance/decline line.
In 2005, the housing sector collapsed. It eventually spread into the construction materials. Then the financial sector came under pressure, with mortgages valued much higher than the property values in 2007. It took multiple years to take down the overall market. When banks are weak, there is usually some indication of a bigger problem as the bankers are the first to know who can’t pay their bills. Notice when the S&P 500 made its high in October 2007, the advance/decline line was already making lower highs and lower lows as well as breaking a long multiyear trend.
In 2011, raw materials topped out. The rare-earth metals, which had been great performers, collapsed. Precious metals topped out in 2011 as well. The energy sector collapsed in the second half of 2014. With both the raw materials and the energy sectors weak, the slowdown migrated eventually into railway stocks, trucking, steel, and finance. Once again, the advance/decline line was going lower, confirming the problem. When crude oil bottomed in 2016, it marked the lows for the market and the rally began. You can see the advance/decline line start to climb in 2016, showing the start of the rally.
When one industry group collapses, there will still be rallies in other sectors. The issue comes as more and more sectors start to break down. The goal of investing is to stay away from sectors that are weak and focus on strong sectors. By staying with the top three sectors, you can outperform the market and avoid being derailed. When all the sectors are breaking down, that is a major clue that the market is in trouble and you should move to safety. If you can’t find a sector that you watch in a strong position, move to cash and wait out the storm.
In 2017, for example, the entire retail sector was under pressure by Amazon and other online retailers. The retail industry weakness may eventually cause problems in shopping malls and spiral into something larger in 2018. Using this as an example, avoiding the retail space and being aware of the potential for related industries (mall owners) to suffer is a method of protecting a portfolio.
Being aware of which sectors are weak and watching for problems spreading into other industries is a high-level analysis of the overall market. If investors start to sell more and more industries, the charts will be making lower highs and lower lows. While that is happening, it is okay to be invested in the top-performing sectors. When more and more sectors start to break, the problem expands, pulling the overall markets down. The Industry Summary discussed in Chapter 20 can keep you aware of industries that have negative performance over different periods, but a three-month period is an important timeline to consider.
Leading sectors
Of the ten sectors, some are aligned with growth while others are aligned with defensive positioning:
- Consumer discretionary: Growth
- Information technology: Growth
- Telecommunications services: Growth
- Materials: Growth
- Energy: Growth
- Utilities: Defensive
- Consumer staples: Defensive
- Healthcare: Used to be defensive, but biotechs, medical equipment, healthcare providers and pharmaceuticals have been some of the most aggressive stocks in the last ten years
- Real estate: Defensive, typically associated with income stream investing
- Financials: Both defensive and growth
Because investors age over time, the income streams from utilities, real estate (especially real estate investment trusts, or REITs), and financials are important ballasts in a portfolio. While these defensive areas may perform in line with the S&P 500, they have a place in portfolios that need an income stream. Using the strongest stocks in those sectors can also help get capital gains as well as income. Avoiding weak stocks chosen for income stream investments is just as important as owning strong stocks in growth areas.
In the following sections, we describe two tools you can use to determine which sectors are leading the market.
Performance charts
A performance chart (also called a PerfChart on StockCharts.com) is used to compare multiple stocks on one chart; we introduce these charts in Chapter 12. Figure 21-2 shows a PerfChart in the middle of a big bull market, looking at performance from July to October 2016. Notice how the growth or aggressive sectors (like technology) are doing very well and the defensive sectors (like consumer staples and utilities) are not.

Chart courtesy of StockCharts.com
FIGURE 21-2: A bull market profile.
By selecting the Histogram button in the bottom left, you get histograms rather than line charts. You can switch back and forth as you like.
If consumer staples (XLP) and utilities (XLU) are becoming the top-performing areas of the market, the market is probably getting weaker and more research needs to be done. PerfCharts in Histogram mode can show you which sectors are leading. Figure 21-3 shows the defensive groups performing significantly better than the growth areas of the market. While utilities were positive and consumer staples flat, they are holding up better than the other sectors. This chart examines November 2015 through February 8, 2016, which was at the final low.

Chart courtesy of StockCharts.com
FIGURE 21-3: Defensive groups perform better during a market correction.
You can also use the PerfChart to compare sectors relative to the S&P 500 ($SPX). This makes the $SPX the zero level, and some sectors outperform while others underperform. To compare relative to the $SPX, click on $SPX on the top left. In Figure 21-4, the $SPX button is grayed out. This chart shows you how a sector is comparing relative to the broader market.

Chart courtesy of StockCharts.com
FIGURE 21-4: Sectors relative to the S&P 500 ($SPX).
RRG charts
A Relative Rotation Graph (RRG chart; see Chapter 12) is a visual model of sector rotation relative to a common reference point; these charts are accessible from the Control Center on the Members page on StockCharts.com. Figure 21-5 shows the XLP and XLU sectors advancing and the XLE energy sector plummeting shortly after the market top in 2015. The date is in the white space in the middle (July 24, 2015), and the shading on the small $SPX graph on the right shows you what time period is being shown. The market started to break down in August 2015.

Chart courtesy of StockCharts.com
FIGURE 21-5: RRG sector alignment.
While it may not always be this obvious, if these two defensive sectors are improving and other sectors are breaking down quickly, this can be a good clue for market weakness. If the defensive situation is starting to show up, you can do more investigative work and add some strong stocks in the defensive industries. Otherwise, you want to be looking for stocks in growth sectors that are pointing toward the top right corner. In this example, you would be looking for stocks in the defensive sectors of utilities and consumer staples, and selling stocks that are starting to weaken. Energy, technology, materials, and industrials are all pointing down to the left, which is not the direction you want your stocks to be going.
Market breadth
Market breadth can be a helpful indicator warning of weakness; we explain how to conduct breadth analysis in Chapter 15. You can check the bullish percent indexes and the percentage of stocks above the 200-day moving average indicators to understand how many stocks are participating in a positive way in the market. The NASDAQ 100 bullish percent index chart along with the percentage of stocks above the 200-day moving average is shown in Figure 21-6. The actual trend of the NASDAQ 100 is shown in the top panel.
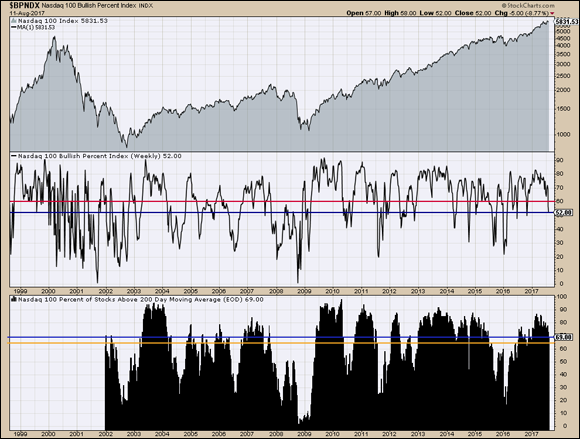
Chart courtesy of StockCharts.com
FIGURE 21-6: The price trend of the NASDAQ 100, the NASDAQ 100 bullish percent index, and the percentage of stocks above the 200-day moving average.
As long as more than 65 percent of the stocks are on buy signals, the market has enough breadth to move higher. The percentage of stocks above the 200 DMA should also be better than 65 percent. When they dip below these levels, watching to see whether they can bounce back to a strong market position again is important. If they fail to improve, the market is susceptible to falling lower after brief rallies.
Watching the NASDAQ 100 ($NDX) and the S&P 500 ($SPX) breadth charts is most important, but being aware where the NASDAQ Composite ($COMPQ) and the NYSE Composite ($NYA) levels are can alert you to early weakness. You can see weakness in the NASDAQ 100 bullish percent index chart in the middle of Figure 21-6, where the index falls between 60 percent and 52 percent.
Position of the indexes compared to the 40-week moving average
If the $SPX or the $NDX is below the 40-week moving average, the market could be sensitive to falling farther. (See Chapter 10 for an introduction to moving averages.) Investors should be aware of the weak condition. Great buying opportunities come from these extreme lows, so investors should continue to watch for strong stocks in growth sectors that can accelerate when the markets turn optimistic again. Figure 21-7 shows the benefit of being invested above that level and cautionary below that level. You can see on both the chart for the S&P 500 (at the top) and the chart for the NASDAQ 100 (at the bottom) that there were periods between 1996 and 2017 where the index fell below the moving average line. But starting in the middle of 2016 through 2017, both indexes are well above the line, and it’s been a good time to be in the market.

Chart courtesy of StockCharts.com
FIGURE 21-7: The $SPX & $NDX indexes.
The slope of the 40-week moving average is also helpful. If the slope is positive (pointing up), the market usually bounces back above the moving average. If the line is pointing down (negative slope), more caution is advised.
Narrowing Your Focus to Certain Sectors
In order for the $SPX to be average, some sectors have to be moving faster than the index and some slower. They can all be going up, but they move at different rates. The $SPX reflects the average. Figure 21-4 illustrates this point.
Focusing your investment activities on leading industries (with the help of this section) is one of the most important methods for beating the overall market. Strong stocks in the top three sectors can be your growth stocks. While you may also need income from dividends or REIT distributions, you can also find some strong stocks in these defensive sectors to help your income. Flip to Chapters 13 and 20 for more about sectors and industries.
Choosing your fishing holes: Sectors with promise
Drilling down through the sectors can help you find strong industries. Click on the Sector Summary tool in the Control Center on the Members tab of StockCharts.com to quickly access the top-performing sectors. Sorting the Sector ETFs by SCTR ranking shows the strongest sectors from the highest-ranked SCTR declining to the lowest-ranked sector. (ETFs are exchange-traded funds. SCTR stands for StockCharts technical ranking; see Chapter 12 for more information.)
Figure 21-8 shows the top three sectors as technology, healthcare, and utilities, sorted by SCTR ranking. While these may move around from week to week, your strong sectors should have SCTR rankings above 50. Choose the top three industries as discussed in Chapter 20, and continue to drill down to choose three or four stocks in each of the strong industries.

Chart courtesy of StockCharts.com
FIGURE 21-8: Sector ETFs sorted by SCTR ranking.
Use the SCTR peer group column to the right of the SCTR column (headed with a U) to focus your investments on the market-cap of stocks you like. Choose from large-cap, mid-cap, and small-cap. As an example, scroll down until you find strong-performing, large-cap stocks. If you don’t find any strong-performing, large-cap stocks, find a different industry group or go to a different sector and drill down into the industries and stocks.
Investing in different sectors for ballast
Having all your investments in the same area of the market can be treacherous to your investing health. If the three top industries are all in the materials sector, that can be too narrow. For diversification, take three stocks from strong industries in each of the three top sectors.
As an example, you might choose the software industry in the technology sector, healthcare providers in the healthcare sector, and gas utilities in the utilities sector. Then choose three strong stocks in each industry. You can also pick one strong stock from each of the top three industries in each leading sector. This would give you nine stocks in your portfolio. As you get sell signals in a stock, you should rotate into new stocks.
Using SCTR reports
One other method for quickly seeing where the strong stocks are can be using the SCTR reports for ETFs. SCTR reports are covered in Chapter 12. Go into the large-cap SCTR reports and click on the SCTR column header, then the Industry column header, and then the Sector column header. This sorts the entire report by sector, by industry, and then in descending order for the SCTR. See the report in Figure 21-9. Notice the drop-down at the top to select SCTRs for different groups, including ETFs. In this figure only stocks are near the top, which is common when the market is booming. ETFs tend to smooth out the trend because they include a basket of top-performing stocks and some that are not doing as well.

Chart courtesy of StockCharts.com
FIGURE 21-9: SCTR reports.
An extremely attractive way to find industries that may be performing well, even though the sector is not, is to look for entire industry groups pushing above 75. With 186 industry groups, hidden gems can lurk underneath the sector strength.
An example of a hidden gem may be healthcare providers. Humana and Aetna have outperformed Facebook from the lows on February 1, 2016, to September 1, 2017. While Facebook is all the rage, two healthcare stocks sit relatively unknown to the wider audience. Seeing this strength by scrolling through the stocks in a sort order can really help diversification.
This is one of the major strengths of the SCTR. It uses price action to determine the rating, not overall sector strength. Plotting the stock’s strength compared to its peer group is one of the most important indicators for a stock in our opinion.
Considering income stream investing
Not everyone invests for growth. Some investors prefer to focus on preserving capital and buying stocks and bonds that give them the highest income stream. This situation is very common when a person is approaching retirement or living in retirement.
If you need income from your investing, you can also search the market by dividend yield. Extremely high yields are usually available on terrible stocks. However, by scanning the market using some of the scan tools on StockCharts.com (see Chapter 14 for an introduction), you can pull up stocks that have a yield greater than 4 percent and an SCTR score higher than a level of 60. You can output the sort result by highest yield. Figure 21-11, later in this chapter, shows a scan table with the yield on the right-hand side. You would use this method of analysis for stocks to invest in to help meet your income goals. If the SCTR weakened, you would sell this stock and look for other high-yield stocks. You can use the Advanced Scan Workbench to do this.
Using Targeted Scans
After you’ve determined your portfolio’s goals, you can set up personal scans and alerts (introduced in Chapter 14) to help you monitor your portfolio hourly, daily, or less frequently; the frequency depends on your goals. If you’re actively trading each day or week, you’ll check this information much more frequently than if you’re managing a longer-term portfolio. Each time you log in to your StockCharts.com account, your scans and alerts will be waiting for you.
Scans are a way to look for a specific set of conditions. Rather than looking through thousands of stocks every day, you ask the computer, via lines of code, to go look for all the stocks with a specific set of conditions and give you a list. The Advanced Scan Workbench link in the Control Center takes you to the setup area shown in Figure 21-10.

Chart courtesy of StockCharts.com
FIGURE 21-10: Using the Advanced Scan Workbench.
As discussed in the earlier section on income stream investing, you may want to develop a model that will help you monitor the best assets to meet your income stream goals. Using the income stream investor model, you can use multiple individual components to create your scan. You want U.S. stocks with a strong SCTR and a dividend yield above 4 percent.
Start broadly by defining the country or the exchange, and work to smaller conditions. Define which exchanges you want to see and how much volume is a minimum volume for you. Investors in the United States would likely choose the New York Stock Exchange. Canadian investors would select the Toronto Stock Exchange, whereas British investors could choose the London Stock Exchange. Many investors deliberately choose an international mix for their portfolios to reduce the effect of poor economic conditions in one country. For example, if the economy is sluggish in Canada but doing better in the United States, a Canadian may mix his or her portfolio with both U.S. and Canadian assets.
You can select each coding line from drop-down menus on the lower half of the Advanced Scan Workbench page so you don’t actually have to write any computer code. Then just change the settings within the code box.
You want stocks that have a dividend, so add that from the Ticker Properties drop-down menu below the coding area. Select “Has Dividend” and click Add. The SCTR greater than 60 means the stock is behaving pretty well, and the Yield threshold can be set by you. Lastly, you can ask it to sort the results using the “rank by” command on the last line. Here’s the final coding:
- [type = stock] and [exchange is NYSE] or [exchange is NASDAQ]
- and [Daily SMA(20,Daily Volume) > 100000]
- and [has dividend is true]
- and [SCTR > 60]
- and [Yield > 4.00]
- rank by [yield]
Click Run Scan. A separate tab will appear with Scan Results. (Notice the tab header at the top of Figure 21-10.)
Figure 21-11 shows the scan results with the Rank by [Yield] information on the far right. You will want to put the scan results into one of your temporary ChartLists you created in Chapter 13. Use the drop-down menu above the scan results on the upper-left where it says Available Actions.

Chart courtesy of StockCharts.com
FIGURE 21-11: Scanning for yield.
The Dividend Yield column will disappear when you save this into one of the temporary scanning ChartLists, so check the “preserve the sort order” button as you move the scan you create to a ChartList. When you look at the results on a chart, click the full quote panel toggle in the Chart Attributes area. The dividend yield will show in the full quote panel above the chart. Click “apply style to all” at the bottom of the page under the chart to install the full quote panel on every chart in the temporary ChartList or add the full quote panel to your default view. You can see how to do this in Chapter 17.
Working with Price Displays, Overlays, and Indicators
Throughout this book we introduce you to price displays, overlays, and indicators. Now it’s time to start fine-tuning these tools to better match your personal trading or investing style.
Price displays
Chapters 4, 5, 6, and 7 discuss different price display styles, such as candlestick, bar, and line charts. Chapter 8 discusses time periods, such as daily or weekly. Each investor has a different style and level of detail she wants to see. It is very important to set up the chart with your personal preferences so you enjoy the experience of managing your stocks. For example:
- As a refresher, you can use candlesticks (see Chapter 4) on all time frames, but they have a lot of detail. Filled candles tend to highlight the negative. Typical candle patterns use one to three candles to form a pattern that plays out over the next five to ten candles.
- Price bars (see Chapter 5) have detail, but the charts look a little smoother. Use your choice of single-color, two-color, or Elder Impulse three-color bars. Open-high-low-close (OHLC) bars are the typical choice for price bars.
- Line charts (see Chapter 6) lose a lot of detail, but the trend is much cleaner. Area charts (mountain charts; see Chapter 7) amplify the line-chart information, and both of these displays work great for long-term charts of weekly or monthly data.
Chapter 9 discusses the analysis of a trend. Understanding what you want to see on the chart is the first step to successful investing. Support/resistance, trend lines, and price channels all play important roles. Depending on your style of investing, these tools enable you to monitor the price for higher highs and higher lows within your time frame.
Chapter 8 discusses time periods, such as monthly, weekly, daily, and 60-minute charts. Great investors usually trade in the same direction as the long runs shown by the monthly and weekly charts. When the momentum starts to wane on monthly and weekly charts, the daily charts may be more susceptible to breakdowns.
Watching the larger trends in momentum (see Chapter 11) on the monthly and weekly charts is a great tool to help you invest successfully.
Overlays and indicators
Chapter 10 discusses moving averages and overlays. Chapter 11 discusses indicators to help improve the timing of entries and exits. These tools have been built over time to help investors manage their trades.
Without question, choosing indicators you like is more difficult. Start with three or four and volume. Then if you would like to try a new indicator, add one and take one out. Charts with too many indicators make analysis impossible. By the time all the indicators line up, the trade is half over. If all indicators gave the same signal, you would need only one. Start with some of the indicators suggested and change one out to see whether it helps you make better decisions.
One recommendation is a relative strength indicator, a momentum indicator, and one other panel like Chaikin money flow or on-balance volume. You may like RSI or stochastics. Chapters 17, 18, and 19 present strategies for pairing overlays and indicators with different types of investing.
Coauthor Greg’s default daily chart has SCTR and relative strength to $SPX on top. The moving average convergence divergence (MACD) indicator and volume are plotted below. On a weekly time frame, the SCTR, RSI, full stochastics, and PPO are the chosen indicators.
SCTR and the relative strength rankings
As long as the SCTR on each chart is above 75, that’s a good indication that things are okay. Because of the way the SCTR is calculated, it doesn’t give a move below 75 quickly if the stock is a fast-rising stock. You may have to sell before the SCTR falls below a minimum level. Use the relative strength compared to the $SPX as an earlier indicator for exiting a stock than the SCTR.
Breaking trend lines on the relative strength compared to the $SPX chart are cautionary as the stock was really outperforming the $SPX before. If the relative strength chart starts to make two-month or three-month lows, you probably need to make some strategic decisions.
Use options to protect the position, sell part of the position to lock in gains, or sell all if the industry is starting to underperform as discussed in Chapter 12. Each investor has different sell points depending on his timeline. Some investors may sell as the price touches a top weekly Keltner channel. Other investors want to hold even if the stock is above the Keltner channel, but when it starts to come back inside the Keltner channel, they sell. Keltner channels are covered in Chapters 10 and 14.
Taking Away Lessons from Your Wins and Losses
You’ve heard the old adage “learn from your mistakes,” but you also want to learn from your successes. The only way you can do that is to keep a good history of your past successes and failures. As you begin to trade, keep a journal of all your trades and analyze all your winners and losers. Not only will you take time to figure out what went wrong or right, but you will also have a history to go back to if you want to review what happened with a gain or a loss.
Journaling about the market and your trading
When you buy a stock, annotate the chart to keep all the details on the display. Chapter 17 demonstrates the annotation tool. Enter the exact price, number of shares purchased, and date on the stock chart as a text box. Save that information. If you’re investing for dividends, select the Events overlay in the Overlays area. This will put a little vertical dashed line on the chart, marking your dividend dates. You may want to draw little lines or arrows where your stop is. You can also add notes under the charts by using the ChartBook View rather than 10 per page, CandleGlance, or Summary view. There is a small box for journaling about each stock chart as well as a place to journal about the overall ChartList.
You can either journal your trades on the StockCharts.com platform on each chart or use a separate Word document and just make a few notes whenever you get the chance about what you think. It’s your trading journal, so write it like a diary. Your notes may include descriptions like bullish, bearish, worried, happy, sad, or confused; market performance that day; what types of trades are working better; industry groups that are leading; or odd things in the market, such as a sudden plunge or surge in a sector or industry.
New trends in the market are interesting to keep track of. An example in 2018 may be keeping updated on crypto currencies like Bitcoin, new investment ideas like Autonomous Vehicle Technology, or social phenomena like marijuana stocks or social media.
Understanding how IPOs trade is important, and there’s usually a pullback or base-building process that allows you to get on board after the original IPO. Journal how these stocks behave to give you confidence in handling highly speculative stocks with no real trading history.
By journaling how you handled a trade, you can apply the knowledge you gain the next time.
Tracking and analyzing your winners and losers
After you own a basket of high-performing stocks, you can save them into your current stock ChartList to keep them all together. (Find out how to create ChartLists in Chapter 13.) You may want to make a bookmark on your browser to link to your current stocks ChartList. Instantly, you can see how they are performing through the day or the week.
Set up ChartLists to move your closed trades into and keep a spreadsheet of your wins and losses. Chapter 13 explains how to create ChartLists, numerically control the order of your ChartLists, and move charts into a ChartList.
To move a chart from one ChartList to another, click the Save As link on the top center of the chart. This is shown in Figure 21-12.

Chart courtesy of StockCharts.com
FIGURE 21-12: Moving charts to your closed trade ChartList.
When you close a position, click the Save As link and move the stock to your completed trades. Analyze the trade when you close it. You may want to write notes documenting events like those in the following example: Staying with Figure 21-12, say that when the SCTR moved above 75 on February 1, 2017, you bought the stock of Portola Pharmaceuticals (PTLA). The stock was breaking to new 11-month highs. Biotechs were starting to move as an industry group. Price continued to move right away, which was a good sign. On March 1, stock had a huge range day but closed near the high end of the range. The stock consolidated sideways for three months.
On May 26, the stock made new two-month lows in relative strength. The SCTR was still very strong, and this was the first pullback on the chart, making this a stock to watch closely. The stock rallied 10 percent off the lows to $39. It reversed and spent one day below support (June 16) but closed in the top third of the bar — definitely the weakest moment on the chart so far. The following Monday, the stock opened, tested lower, and closed higher with an outside day — bullish. Then it continued higher again. On June 23, the stock soared to $57.50. The stock continued higher and was consolidating in a wide range.
A wild stock to ride, but then a stop at $42 (former support/resistance) was a long way below, but that was the last support/resistance level. As long as the SCTR continues to be strong and the relative strength continues to hold up, keep owning the stock. If they break down, don’t wait until $42 to sell.
Stocks aren’t always this easy or this rewarding. But in this example, using simple technical tools in an improving industry group gave a great result. Now that the stock is above a double, there is a tendency to want to sell. The stock continues to outperform the $SPX, so try to resist the temptation to close the position. There would be nothing wrong with selling half, locking in a profit, and allowing the rest to ride until a technical condition hits to sell the stock.
Continuing to buy winners
Stocks in an uptrend that pull back can be very attractive. Using some form of channel trade (see Chapter 10) or stochastics (see Chapter 11) can help buy winning stocks. Here is a list of tools to help:
- Full stochastics: These help you pick out wide swings in stock price. Not every trade is guaranteed to work, but this is a lot better entry than buying the stock at previous all-time highs after a huge run.
- Keltner channels: These can help you find stocks at the low end of their uptrending channel. Playing the range between the bottom of a Keltner channel to the top can generate 25 percent trades because the channel continues to move up over time. Use the Advanced Scan Workbench to find these stocks.
- Stocks with SCTRs moving above 75: This movement suggests something is improving. Looking through the SCTR tables or using the drill-down tools in the Sector Summary can quickly help you identify strength. Use the Advanced Scan Workbench to search for stocks crossing above 75. (Flip to Chapter 12 for more about the SCTR.)
- Breakouts to new highs: Understand that no one who owns the stock wants to sell because owning the stock is comfortable now. If institutions start to hit the buy button, this can propel the stock. Use the Predefined Scans or the Advanced Scan Workbench to find these stocks.
- Pullbacks to horizontal support/resistance levels: In Figure 21-12, the two moves just below support were critical to test shareholders. Give a little room around the support level, but if it holds, you probably want to keep the trade.
- Pullbacks to moving averages: Stocks can pull back to common moving averages and then bounce. Use the Advanced Scan Workbench to find these stocks.
Refraining from holding losers
Losing stocks have two costs. One is the fact that your capital is disappearing, and the second is the lost opportunity of not being in something going up.
Have an exit strategy if the trade doesn’t work. Here is a chart where human emotion keeps you in the trade. Stops would have kicked you out. Figure 21-13 had all the setups. The purchase date was June 8, 2017. Notice the vertical line is just to the left so you can see the price action clearly. The stock was breaking out to new ten-month highs. After pausing at resistance at $5.80, the stock surged. The trade entry was $6.04. The MACD was positive, the SCTR was above 75, and the stock was making new six-month highs in relative strength compared to the $SPX. Volume was well below average as the stock consolidated. The stock was making higher highs and higher lows. It was well above the 200-day moving average. Another gold stock was bought the same day (the chart for that stock isn’t shown).

Chart courtesy of StockCharts.com
FIGURE 21-13: Trading without a stop.
The problem came when Kinross (K.TO) stock reversed in the next few days and $5.80 did not hold. Within a week, losses were 10 percent. The brief bounce suggested maybe the stock could resume the uptrend. It immediately dropped down to the 200-day moving average with 20 percent losses. The stock chart showed a strong rally back to resistance by September 1. There was a trend in higher lows from December 2016. The loss position got reduced to 10 percent, and the September 1 high was where the stop should have been put in June.
Wasting months in a losing position and depleting capital is not the best way to grow your portfolio. On September 1, the industry group was improving. Gold stocks accelerated at the end of August. The gold stock industry group was overbought at the end of August, so this may be the end of the run.
While another gold stock bought at the same time pulled back to horizontal support and held, Kinross did not. Each trade has to be managed separately. When the Kinross trade was put on, it was the better-looking opportunity. The influence of the other stock led to mismanagement of the Kinross trade.