
2.8. RELIABILITY OF A COMPONENT BY THE P-S-N CURVES APPROACH 45
1
16
R "
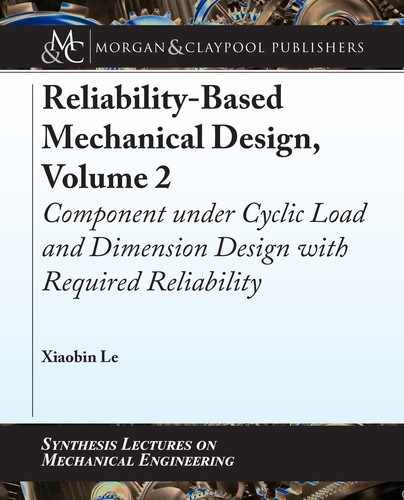
Ø 1.125±.005 Ø 1.375±.005
Figure 2.14: Schematic of the shoulder section of a shaft.
Per Equation (2.29), we can have the expression of the component fatigue strength S
cf
at the
fatigue life N D 3:5 10
5
:
S
cf
D
k
a
k
b
k
c
K
f
S
0
f
at N D 3:5 10
5
: (a)
Per Equations (2.14)–(2.16), the distribution parameters of the surface finish modification factor
k
a
for a machined component are:
k
a
D 2:7
.
S
ut
/
0:2653
D 2:7
.
61:5
/
0:2653
D 0:9053 (b)
k
a
D
k
a
k
a
D 0:06 0:9053 D 0:05432: (c)
Per Equation (2.17), the size modification factor is:
k
b
D
d
0:3
0:1133
D
1:125
0:3
0:1133
D 0:8609: (d)
Per Equations (2.18)–(2.20), the distribution parameters of the loading modification factor k
c
for cyclic bending stress, we have:
k
c
D 1 (e)
k
c
D 0: (f)
Per Equations (2.22)–(2.25), we can calculate the mean and standard deviation of the fatigue
stress concentration factor K
f
. In this example, K
t
D 2:01 and r D 0:0625
00
.
Per Equation (2.23), the Neuber constant
p
a is
p
a D
4
S
ut
D
4
61:5
D 0:06504: (g)

46 2. RELIABILITY OF A COMPONENT UNDER CYCLIC LOAD
Per Equation (2.22), the mean of K
f
is
K
f
D
K
t
1 C
2
p
r
K
t
1
K
t
p
a
D
2:01
1 C
2
p
0:0625
2:01 1
2:01
0:06504
D 1:5934: (h)
Per Equations (2.24) and (2.25), the standard deviation of K
f
is:
K
f
D
K
f
K
f
D 1:5934 0:08 D 0:1275: (i)
So, the component fatigue strength S
cf
for this example is
S
cf
D 0:8609
k
a
K
f
S
0
f
at N D 3:5 10
5
: (j)
e distribution parameters of every random variable in Equation (j) are all known, the compo-
nent fatigue strength S
cf
is fully specified.
(2) Calculate the reliability of the shaft.
e limit state function in this example per Equation (2.38) will be:
g
k
a
; K
f
; S
0
f
D 0:8609
k
a
K
f
S
0
f
10:67: (k)
e distribution parameters in the limit state function (k) are listed in Table 2.15.
e limit state function (k) contains three normally distributed random variable and is a
nonlinear function. We can follow the H-L method and the program flowchart in Appendix A.1
to create a MATLAB program. e iterative results are listed in Table 2.16. From the iterative
results, the reliability index ˇ and corresponding reliability R of the shaft in this example are:
ˇ D 1:56120 R D ˆ
.
1:5620
/
D 0:9409:
Table 2.15: e distribution parameters of random variables in Equation (k)
k
a
K
f
S
'
f
(ksi)
μ
k
a
σ
k
a
μ
K
f
σ
K
f
μ
S
'
f
σ
S
'
f
0.9053
0.05432 1.5932 0.1275 26.52 1.98
..................Content has been hidden....................
You can't read the all page of ebook, please click here login for view all page.