IDA Pro supports five graphing options, accessible from the buttons on the toolbar shown in Figure 5-7. Four of these graphing options utilize cross-references.
When you click one of these buttons on the toolbar, you will be presented with a graph via an application called WinGraph32. Unlike the graph view of the disassembly window, these graphs cannot be manipulated with IDA. (They are often referred to as legacy graphs.) The options on the graphing button toolbar are described in Table 5-1.
Table 5-1. Graphing Options
Button | Function | Description |
|---|---|---|
Creates a flow chart of the current function | Users will prefer to use the interactive graph mode of the disassembly window but may use this button at times to see an alternate graph view. (We’ll use this option to graph code in Chapter 6.) | |
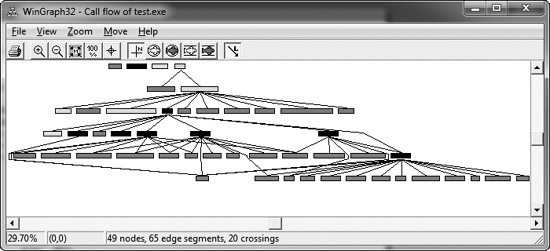
Graphs function calls for the entire program | Use this to gain a quick understanding of the hierarchy of function calls made within a program, as shown in Figure 5-8. To dig deeper, use WinGraph32’s zoom feature. You will find that graphs of large statically linked executables can become so cluttered that the graph is unusable. | |
Graphs the cross-references to get to a currently selected cross-reference | This is useful for seeing how to reach a certain identifier. It’s also useful for functions, because it can help you see the different paths that a program can take to reach a particular function. | |
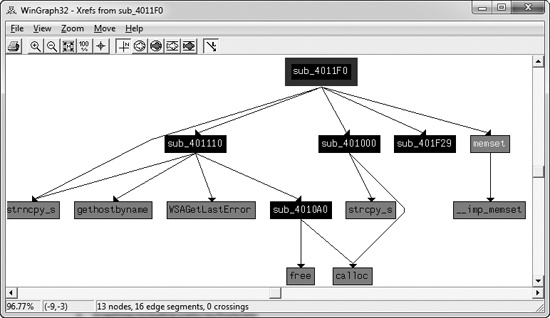
Graphs the cross-references from the currently selected symbol | This is a useful way to see a series of function calls. For example, Figure 5-9 displays this type of graph for a single
function. Notice how | |
Graphs a user-specified cross-reference graph | Use this option to build a custom graph. You can specify the graph’s recursive depth, the symbols used, the to or from symbol, and the types of nodes to exclude from the graph. This is the only way to modify graphs generated by IDA Pro for display in WinGraph32. |