
Chapter 7. Insert and Modify Diagrams
Chapter at a Glance

✓ | |
✓ | |
✓ | |
Diagrams are graphics that convey information. Business documents often include diagrams to clarify concepts, describe processes, and show hierarchical relationships. Microsoft Word 2010 comes with a powerful diagramming tool called SmartArt that you can use to create diagrams directly in your documents. By using ready-made diagram templates, you can produce sophisticated results tailored to your needs.
In this chapter, you’ll insert a diagram into a document and specify its size and position. Then you’ll change the diagram’s layout, visual style, and color theme. Finally, you’ll see how to use a diagram to arrange pictures in a document.
Practice Files
Before you can complete the exercises in this chapter, you need to copy the book’s practice files to your computer. The practice files you’ll use to complete the exercises in this chapter are in the Chapter07 practice file folder. A complete list of practice files is provided in Using the Practice Files at the beginning of this book.
Creating Diagrams
When you need your document to clearly illustrate a concept such as a process, cycle, hierarchy, or relationship, the powerful SmartArt Graphics tool is available to help you create a dynamic, visually appealing diagram. By using predefined sets of sophisticated formatting, you can almost effortlessly put together any of the following diagrams:
List. These diagrams visually represent lists of related or independent information—for example, a list of items needed to complete a task, including pictures of the items.
Process. These diagrams visually describe the ordered set of steps required to complete a task—for example, the steps for getting a project approved.
Cycle. These diagrams represent a circular sequence of steps, tasks, or events, or the relationship of a set of steps, tasks, or events to a central, core element—for example, the looping process for continually improving a product based on customer feedback.
Hierarchy. These diagrams illustrate the structure of an organization or entity—for example, the top-level management structure of a company.
Relationship. These diagrams show convergent, divergent, overlapping, merging, or containment elements—for example, how using similar methods to organize your e-mail, calendar, and contacts can improve your productivity.
Matrix. These diagrams show the relationship of components to a whole—for example, the product teams in a department.
Pyramid. These diagrams illustrate proportional or interconnected relationships—for example, the amount of time that should ideally be spent on different phases of a project.
Picture. These diagrams rely on pictures instead of text to create one of the other types of diagrams—for example, a process picture diagram with photographs showing the recession of glaciers in Glacier National Park.
You select the type of diagram you want to create from the Choose A SmartArt Graphic dialog box. The categories are not mutually exclusive, meaning that some diagrams appear in more than one category.

After creating the diagram, you insert text by typing either directly in its shapes or in the associated Text pane. Depending on the diagram type, the text appears in or adjacent to its shapes.
In this exercise, you’ll create a diagram, add text, adjust its size, and specify its position in relation to the document text and page margins.
Set Up
You need the ServiceA_start document located in the Chapter07 practice file folder to complete this exercise. Open the ServiceA_start document, and save it as ServiceA. Then follow the steps.
Click to the left of the Gather information heading, and then on the Insert tab, in the Illustrations group, click the SmartArt button.
Keyboard Shortcut
Press and release Alt, N, and then M to open the Choose A SmartArt Graphic dialog box.
See Also
For more information about keyboard shortcuts, see Appendix A at the end of this book.
The Choose A SmartArt Graphic dialog box opens, displaying all the available graphics.
In the left pane, click each diagram category in turn to display only the available layouts of that type in the center pane.
In the left pane, click Process. Then in the center pane, click each process diagram layout in turn to view an example, along with a description of what the diagram best conveys, in the right pane.
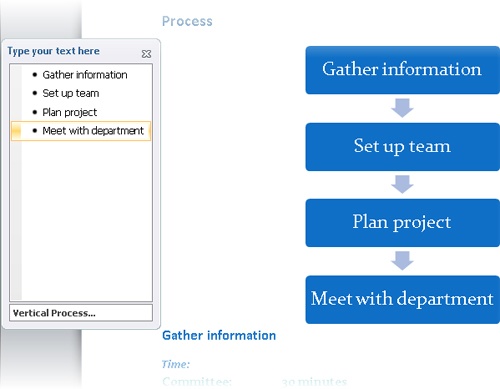
When you finish exploring, click the third thumbnail in the sixth row (Vertical Process), and then click OK.
The process diagram is inserted at the cursor, and the Design and Format contextual tabs are displayed on the ribbon.
Troubleshooting
The appearance of buttons and groups on the ribbon changes depending on the width of the program window. For information about changing the appearance of the ribbon to match our screen images, see Modifying the Display of the Ribbon at the beginning of this book.
Depending on your screen resolution, you might see a description of the Vertical Process diagram at the bottom of the Text pane. If your Text pane looks like the one in our graphic, you can click Vertical Process to display the description.
With the first bullet selected in the Text pane, type Gather information, and then press the Down Arrow key to move the cursor to the next placeholder.
Troubleshooting
Be sure to press the Down Arrow key. If you press the Enter key, you’ll start a new bullet, and if you press the Tab key, you’ll turn the current bullet into a level-two bullet below the one above it.
As you type in the Text pane, the words also appear in the corresponding shape in the diagram.
Repeat step 5 for the remaining two placeholders, entering Set up team and Plan project.
With the cursor at the end of the third bulleted item in the Text pane, press Enter to extend the bulleted list and add a new shape to the diagram. Then type Meet with department.
The widths of the shapes in the diagram adjust to accommodate the length of the bullet point you just typed.
In the Text pane, click the Close button.
On the left side of the diagram frame, point to the sizing handle (the four dots), and when the pointer changes to a double-headed arrow, drag to the right past the diagram and into the white space, until the frame is approximately as wide as the shapes within the diagram.
If you can’t see the diagram after you release the mouse button, scroll up in the document.
The diagram now sits at the left margin of the document, with the Gather information heading to its right.
On the Format contextual tab, in the Arrange group, click the Wrap Text button, and then in the gallery, click Square.
Troubleshooting
Depending on your window size and screen resolution, you might need to click the Arrange button to display the Arrange group.
See Also
For information about text wrapping, see Arranging Objects on the Page in Chapter 10.
In the Arrange group, click the Position button, and then at the bottom of the gallery, click More Layout Options.
The Layout dialog box opens with the Position page displayed. On this page are options for controlling where the diagram appears relative to other elements of the document.
In the Horizontal area, click Alignment. Then click the Alignment arrow, and in the list, click Right.
In the Vertical area, click Alignment. Leave the Alignment setting as Top, and then change the relative to setting to Line.
Click OK.
Instead of sitting at the left margin with text before and after it, the diagram now sits to the right of the text, without interrupting its flow.
In the lower-left corner of the diagram frame, point to the sizing handle. When the pointer changes to a diagonal double-headed arrow, drag up and to the right until the bottom of the diagram frame sits level with the last line of text in the Community Service Committee paragraph.
Click a blank area of the document.
The diagram now sits neatly to the right of the introductory text.


Modifying Diagrams
After you create a diagram, you can add and remove shapes and edit the text of the diagram by making changes in the Text pane. You can also customize the diagram by using the options on the SmartArt Tools contextual tabs.
You can make changes such as the following by using the commands on the Design contextual tab:
Switch to a different layout of the same type or of a different type.
Add shading and three-dimensional effects to all the shapes in a diagram.
Change the color scheme.
Add shapes and change their hierarchy.
You can customize individual shapes in the following ways by using the commands on the Format contextual tab:
You can use Live Preview to display the effects of these changes before you apply them. If you apply a change and then decide you preferred the original version, you can click the Reset Graphic button in the Reset group on the Design contextual tab.
In this exercise, you’ll change a diagram’s layout, style, and colors. Then you’ll change the shape and color of one of its elements, and customize copies of the diagram.
Set Up
You need the ServiceB_start document located in the Chapter07 practice file folder to complete this exercise. Open the ServiceB_start document, and save it as ServiceB. Then follow the steps.
If necessary, adjust your view of the document so that the entire diagram sits in the bottom half of your screen.
Click a blank area inside the diagram frame to activate the diagram as a whole.
On the Design contextual tab, in the Layouts group, click the More button.
The Layouts gallery appears, showing the other available Process diagram layouts.
In the Layouts gallery, point to each thumbnail to preview the diagram with that layout.
Because changing the layout does not change the width of the diagram frame, some of the horizontal layouts create a very small diagram.
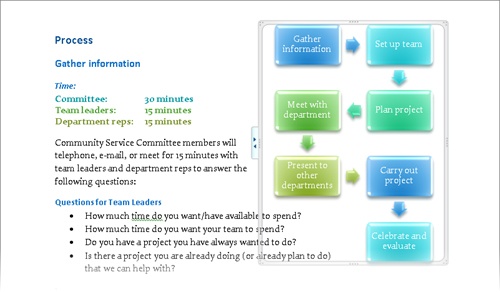
In the Layouts gallery, click the last thumbnail in the fourth row (Basic Bending Process).
The diagram changes to two columns with arrows indicating the process flow.
Point to the sizing handle on the left side of the diagram’s frame, and when the pointer changes to a two-headed arrow, drag the frame to the left until the diagram occupies a bit less than half the page width.
When you release the mouse button, the shapes in the diagram expand to fill the resized frame.
On the Design contextual tab, in the SmartArt Styles group, click the More button.
The SmartArt Styles gallery appears.
In the gallery, point to each style, noticing the changes to your diagram. Then under 3-D, click the first thumbnail in the first row (Polished).
In the SmartArt Styles group, click the Change Colors button.
The Colors gallery appears, offering sets of different colors or of different shades of the same color.
Preview a few color combinations, and then under Colorful, click the first thumbnail (Colorful – Accent Colors).
In the document, you can see that the new diagram colors coordinate with the text colors.
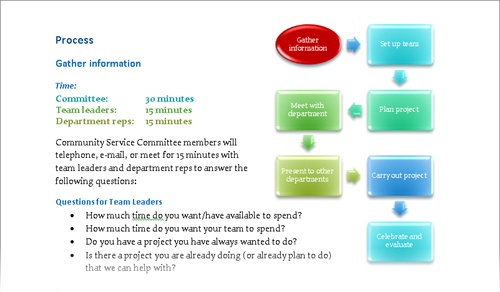
In the upper-left corner of the diagram, click the Gather information shape (not its text), and then on the Format contextual tab, in the Shapes group, click the Change Shape button.
The Shapes gallery appears, showing all the available built-in shapes.
Under Basic Shapes, click the first shape in the first row (Oval).
The selected shape changes from a rectangle to an oval.
Without changing the selection, in the Shape Styles group, click the Shape Fill button. Then under Standard Colors in the palette, click the first box (Dark Red).
Click away from the diagram.
You can now see the results.
Click a blank area within the diagram to select it. Then on the Home tab, in the Clipboard group, click the Copy button.
Scroll down the document, click to the left of the Set up team heading, and in the Clipboard group, click the Paste button to paste in a copy of the diagram.
On the Format tab, in the Arrange group, click the Position button, and then click More Layout Options to display the Layout dialog box. Ensure that the Horizontal setting is Alignment, Right relative to Column and the Vertical setting is Alignment, Top relative to Line. Then click OK.
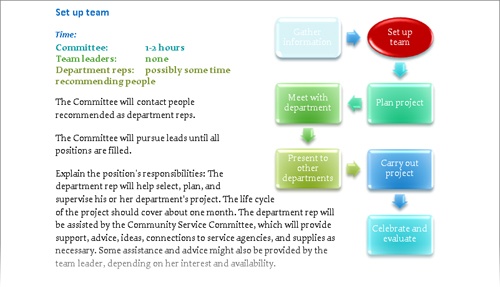
Click the Gather information shape (not its text). In the Shapes group, click the Change Shape button, and under Rectangles, click the second shape (Rounded Rectangle). Then in the Shape Styles group, click the Shape Fill button, and under Theme Colors in the palette, click the third box (Light Turquoise, Background 2).
The shape corresponding to the previous heading is now muted to show that it has already been discussed.
Click the Set up team shape (not its text), and change its shape to Oval. Then change its fill color to Dark Red.
The diagram now corresponds with the adjacent topic.
If you want, repeat steps 15 through 19 to insert a customized copy of the diagram adjacent to each of the remaining headings in the Process section.


Creating Picture Diagrams
The SmartArt Graphics tool that comes with Word 2010 includes a sophisticated new category of diagrams that are designed to hold pictures. You can use these diagrams for business uses such as creating organization charts with pictures as well as names and titles or for personal uses such as creating a page of family photographs.
In this exercise, you’ll create a page of photographs. You’ll size and position the photographs and then enter and format accompanying captions.
Set Up
You need the Garden, Park, Pond, and Woods pictures located in the Chapter07 practice file folder to complete this exercise. Create a blank document, and save it as Westbury in the folder where you usually save your practice files. Then follow the steps.
On the Page Layout tab, in the Page Setup group, set the orientation to Landscape, and set the margins to Narrow. Then if necessary, set the zoom percentage so that you can see the entire page on your screen.
At the top of the document, type Westbury, and press Enter. Select the text, and then on the Home tab, in the Font group, click the Text Effects button. Then in the gallery, click the second thumbnail in the last row (Gradient Fill - Orange, Accent 6, Inner Shadow). Finally, set the size to 72.
Press the Down Arrow key, and on the Insert tab, in the Illustrations group, click the SmartArt button. In the left pane of the Choose a SmartArt Graphic dialog box, click Picture. Then in the middle pane, double-click the first thumbnail in the first row (Accented Picture).
The template for the selected diagram is inserted at the cursor.
Click a blank area inside the diagram frame, and then on the Format contextual tab, in the Size group, change the Height setting to 5.75 and the Width setting to 9.
Click a blank area of the biggest shape, and then in the Size group, change the Height setting to 5 and the Width setting to 8. Then drag the shape down and to the left until it sits in the lower-left corner of the diagram frame.
Click a blank area of the top circle, and then in the Size group, use the up arrows in the Height and Width settings to increase the size to 1.7”. Repeat this step for the other two circles.
Drag the top circle to the upper-right corner of the diagram frame, drag the middle circle to the right to align with the frame, and drag the bottom circle to the lower-right corner of the frame.
The diagram now occupies most of the page.
In the biggest shape, click the Insert Picture icon.
The Insert Picture dialog box opens.
Navigate to your Chapter07 practice file folder, and then double-click Park.
Repeat step 9 to insert the Garden picture in the top circle, the Pond picture in the middle circle, and the Woods picture in the bottom circle.
Open the Text pane, and replace the placeholder bullet points with Park, Garden, Pond, and Woods.
The captions appear on the diagram in the position and format specified by the diagram template.
In the Text pane, double-click the Park bullet point, and then on the Home tab, in the Font group, apply the Gradient Fill – Orange, Accent 6, Inner Shadow text effect and set the size to 40. Repeat this step for the Garden, Pond, and Woods bullet points. Then close the Text pane.
To balance the page, on the Page Layout tab, in the Page Setup group, click the Margins button, and at the bottom of the gallery, click Custom Margins. Then in the Page Setup dialog box, increase the Left margin to 1.25, and click OK.
Make any additional adjustment to achieve a balanced page.
We indented the title by 1 inch and removed the space after it.


Key Points
You can easily create a sophisticated diagram to convey a process or the relationship between hierarchical elements.
Diagrams are dynamic illustrations that you can customize to produce precisely the effect you are looking for.
You can use a picture diagram to neatly lay out pictures on a page.