
Chapter 18: Monitoring and Managing Performance and Health
In this chapter, we look at the monitoring, performance, health, and management of Azure Virtual Desktop (AVD). Being able to monitor your AVD environment helps you spot issues and optimize the configurations for a good user experience (UX). In this section, we take a look at the three key areas of monitoring, performance, and health. The key topics we'll cover in this chapter are outlined here:
- Configuring Azure Monitor for AVD
- Using AVD Insights
- Setting up alerts using alert rules
- Introduction to Kusto
- Using Azure Advisor for AVD
Configuring Azure Monitor for AVD
Azure Monitor for AVD is essentially a built-in dashboard built using Azure Monitor workbooks. This helps an information technology (IT) administrator understand the current environment state and enables the troubleshooting of some of the issues that may occur within an AVD environment.
Before you can get started with Azure Monitor for AVD, you need to make sure of the following:
- One Log Analytics workspace is configured.
- You are using the Azure Resource Manager (ARM) version of AVD.
- You have enabled the data collection of your AVD environment.
Once you have met the criteria to proceed, we can move on to look at creating a Log Analytics workspace.
Creating a Log Analytics workspace
The first thing to do is deploy Log Analytics to configure it to collect data from AVD. To do this, you will first need to open the Log Analytics workspaces page using the Azure search bar, as shown in the following screenshot:
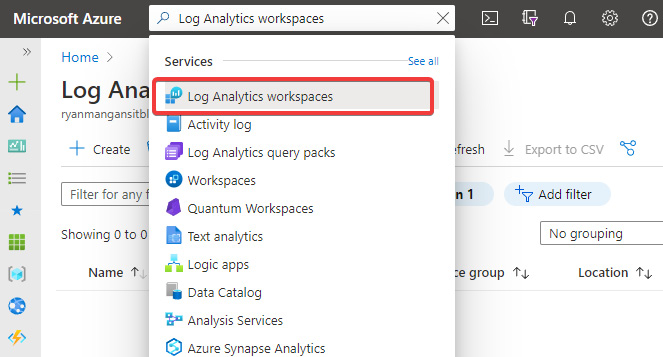
Figure 18.1 – Search bar and the Log Analytics workspaces service
Once we have opened the Log Analytics workspaces page, we can progress to creating a new Log Analytics workspace. Here are the steps to do this:
- Within the Log Analytics workspaces page, click Create.
- Select a Resource group type within the Create Log Analytics workspace page, enter a Name value for the instance, and choose an Azure Region type. Once complete, click Review + Create. The following screenshot provides an overview of this:
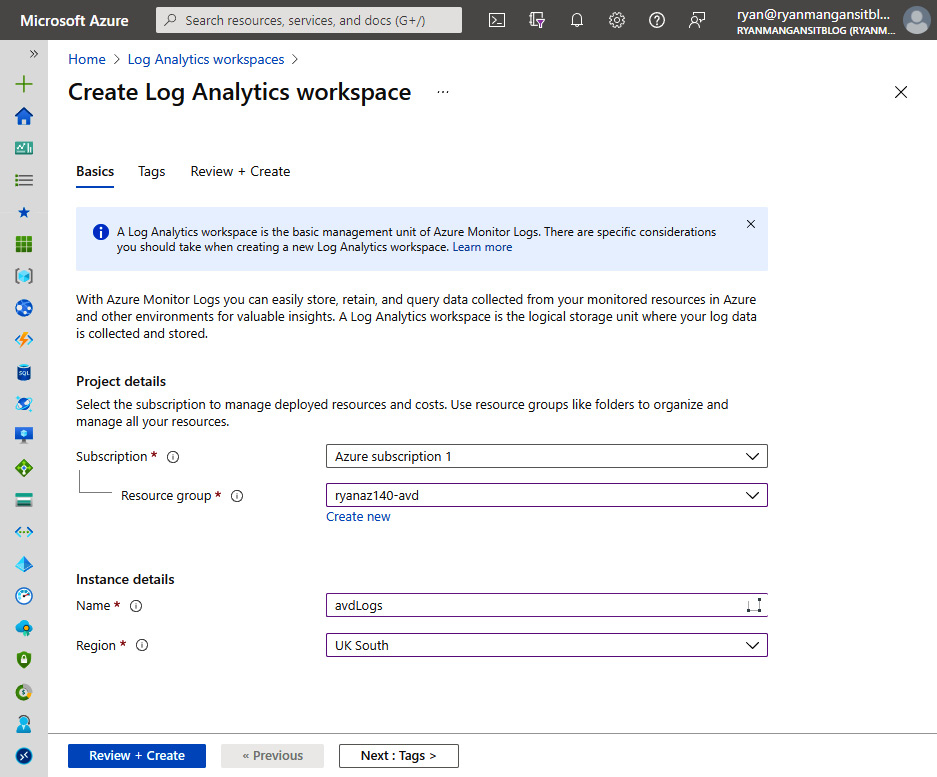
Figure 18.2 – Create Log Analytics workspace page
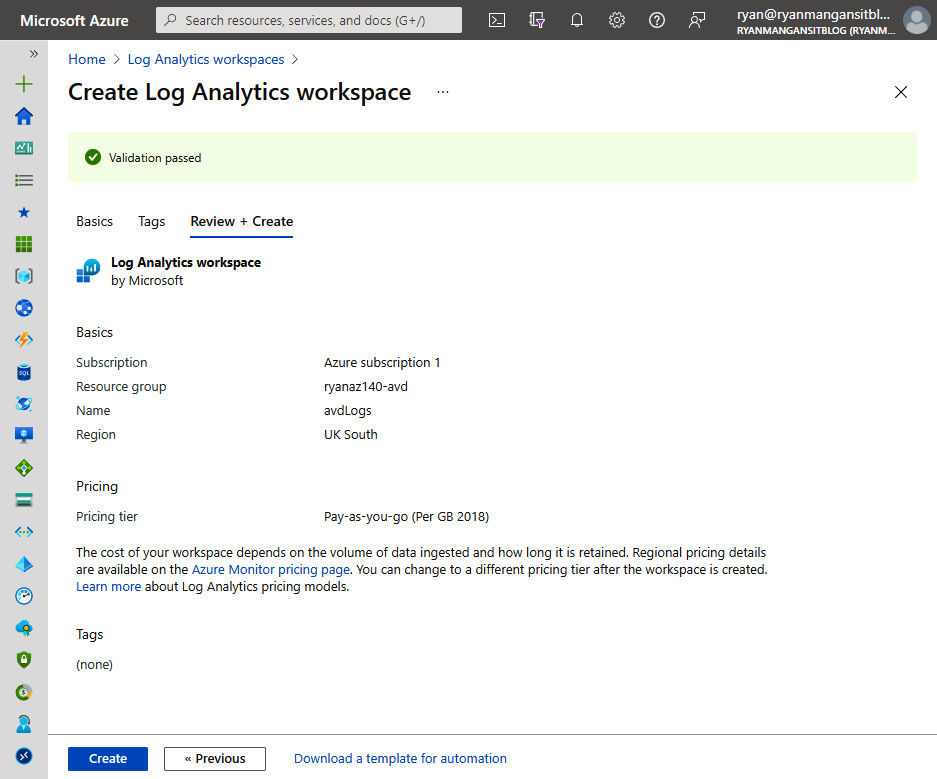
Figure 18.3 – Review + Create tab for the Create Log Analytics workspace page
Once the deployment has finished, you should see the Log Analytics workspace you created in the Log Analytics workspaces page, as shown in the following screenshot:
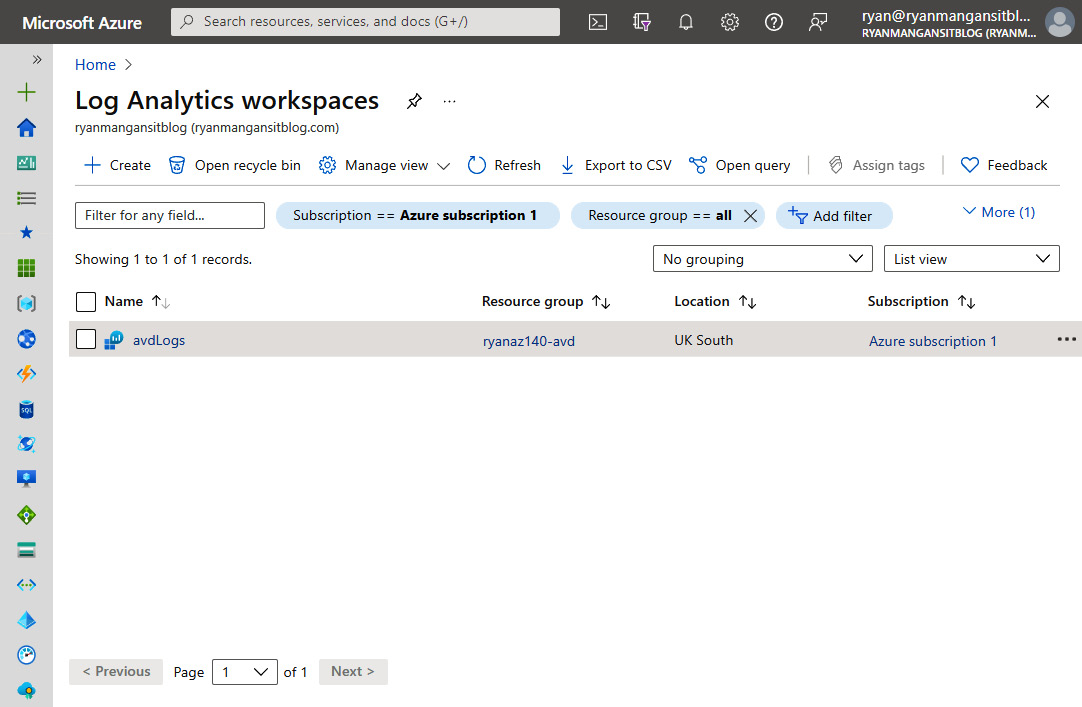
Figure 18.4 – Created Log Analytics workspace avdLogs
Important Note
The default pricing tier for Log Analytics will be configured, as shown in the preceding screenshot. You will not incur any charges until you collect sufficient amounts of data. You can cap data using the Daily cap feature located under Usage and estimated costs in the General menu section.
The following screenshot shows where the Daily cap button is located:
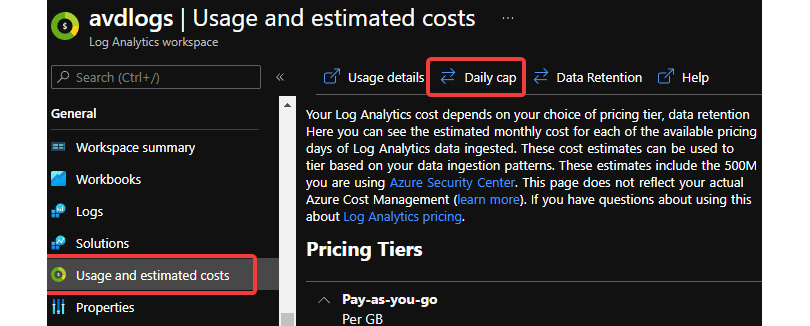
Figure 18.5 – Usage and estimated costs menu within a Log Analytics workspace
The following screenshot shows the Daily cap blade, which can be used to control the daily ingestion of data:
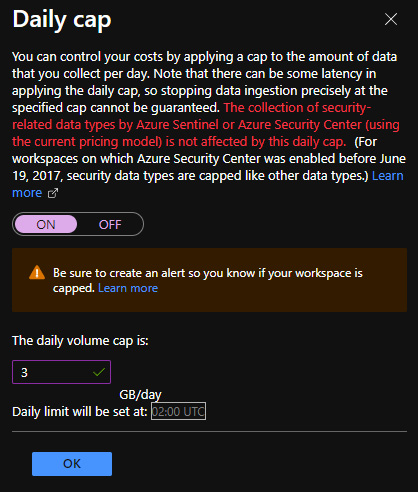
Figure 18.6 – Daily cap blade
Now that we have created our Log Analytics workspace, we can proceed with configuring monitoring in AVD.
Configuring the monitoring of AVD
In this section, we will take a look at setting up the required monitoring components for AVD. To do this, we will navigate to the Azure Virtual Desktop page and then click Insights under the Monitoring section.
There are multiple different ways to configure Azure Monitor for AVD. In this example, we will use Insights within the Azure Virtual Desktop page. However, we first need to configure the workbook for AVD, as follows:
- To get started, click Open Configuration Workbook, as highlighted in the following screenshot:
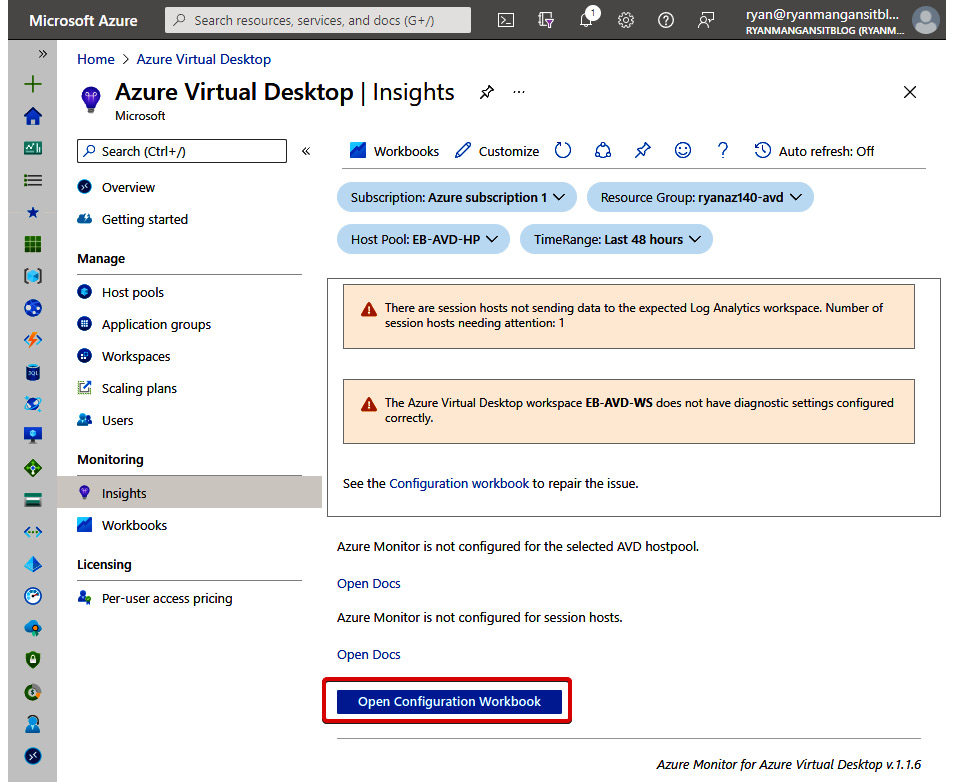
Figure 18.7 – AVD Insights workspace not configured
- You will now see the Check Configuration heading, which has three tabs— Resources diagnostic settings, Session host data settings, and Data Generated. You need to ensure that you have configured all the required components within Resources diagnostic settings and Session host data settings.
Let's get started.
- Select the required Log Analytics workspace and then click Configure host pool, as shown in the following screenshot:
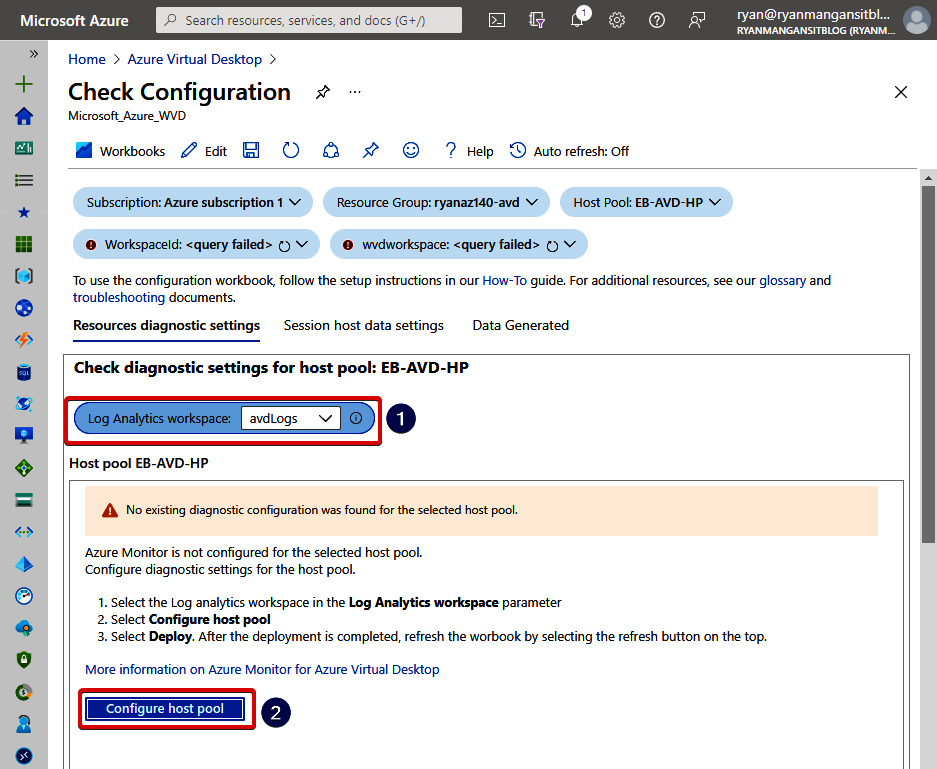
Figure 18.8 – Check Configuration workspace and the Configure host pool button highlighted
- Once you have clicked the Configure host pool button, you will see the Deploy Template page appear, which is used to configure the host pool diagnostic settings.
- Click Deploy, as shown in the following screenshot, and wait for the deployment to finish:
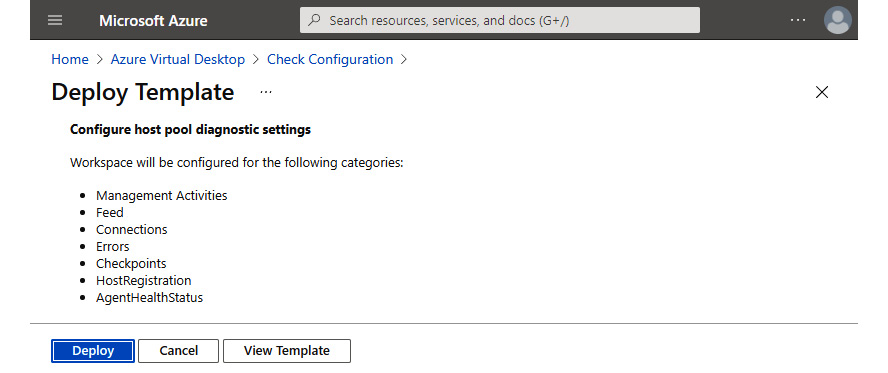
Figure 18.9 – Deploy Template page for configuring host pool diagnostic settings
- Once deployed, navigate to Azure Virtual Desktop | Workbooks, and under Public Templates, click Check Configuration, as highlighted in the following screenshot:
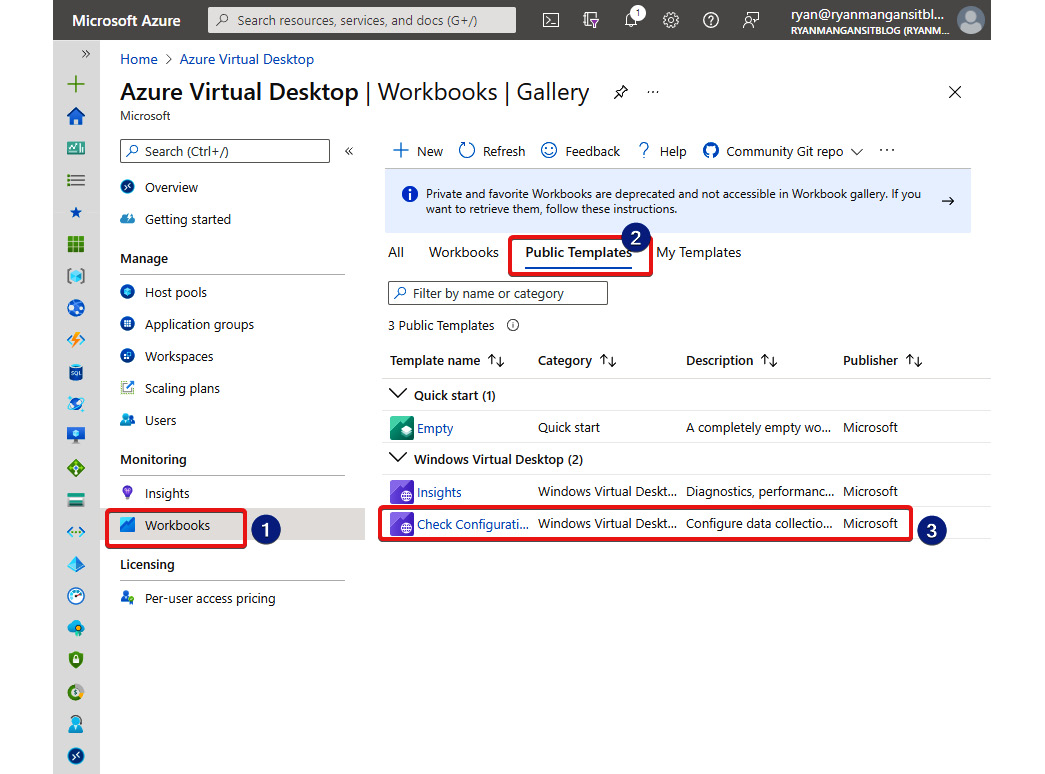
Figure 18.10 – Location of the Check Configuration workspace within Public Templates
- You should then see that the Check Configuration page has changed and the host pool diagnostic settings are now shown.
We now need to configure the workspace by deploying the Log Analytics settings for the AVD workspace. Follow these steps:
- Click Configure workspace to proceed, as illustrated in the following screenshot:
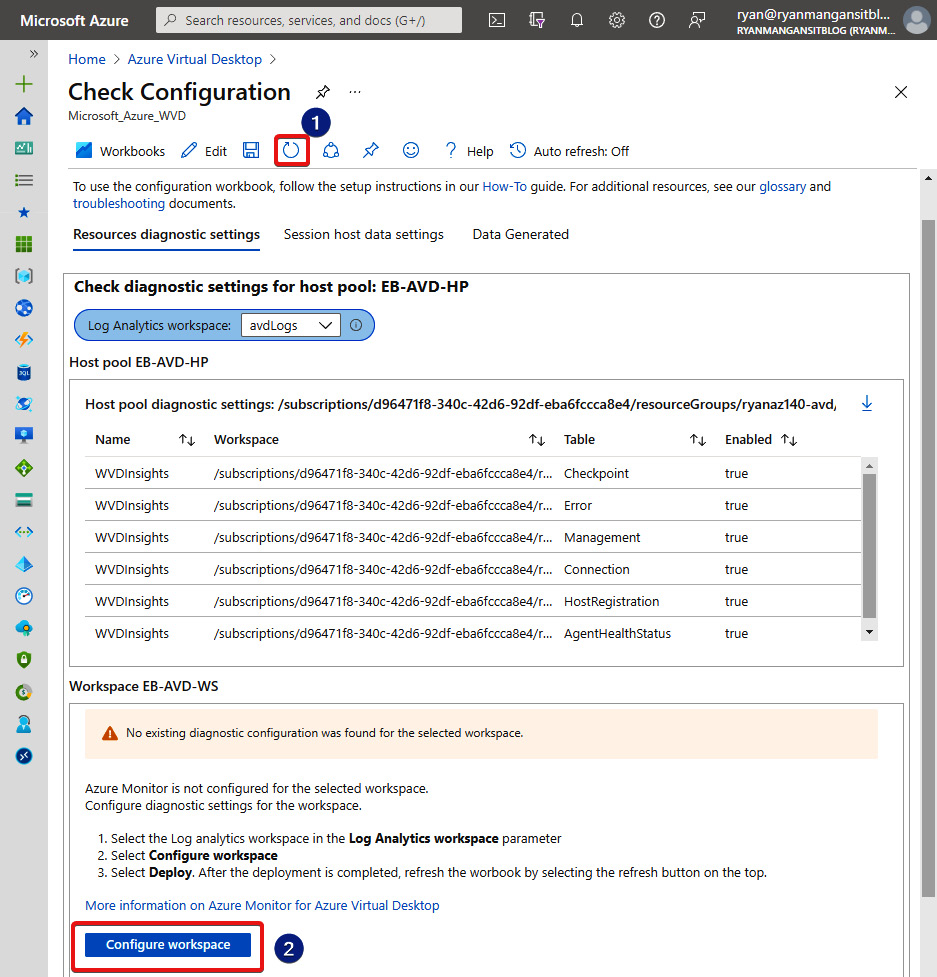
Figure 18.11 – Resources diagnostic settings page with the Configure workspace button highlighted
- You will then see the Deploy Template page appear for configuring the workspace diagnostic settings, as illustrated in the following screenshot. Click Deploy to proceed:
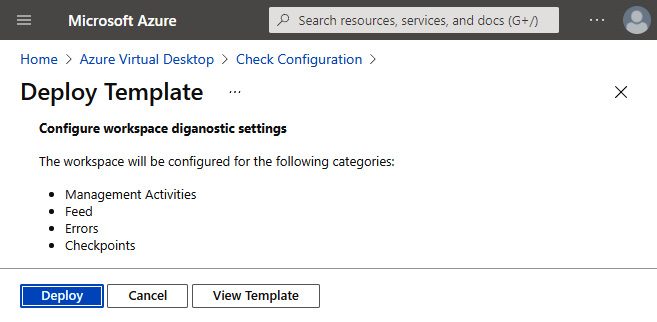
Figure 18.12 – Deploy Template page for configuring workspace diagnostic settings
- Once you have finished configuring the diagnostics for both host pools and the workspace, we can proceed with Session host data settings.
- Select Log Analytics Workspace within the Session host data settings page and click Add hosts to the workspace, as illustrated in the following screenshot. If you see an error in adding the session hosts, you may need to add them manually:
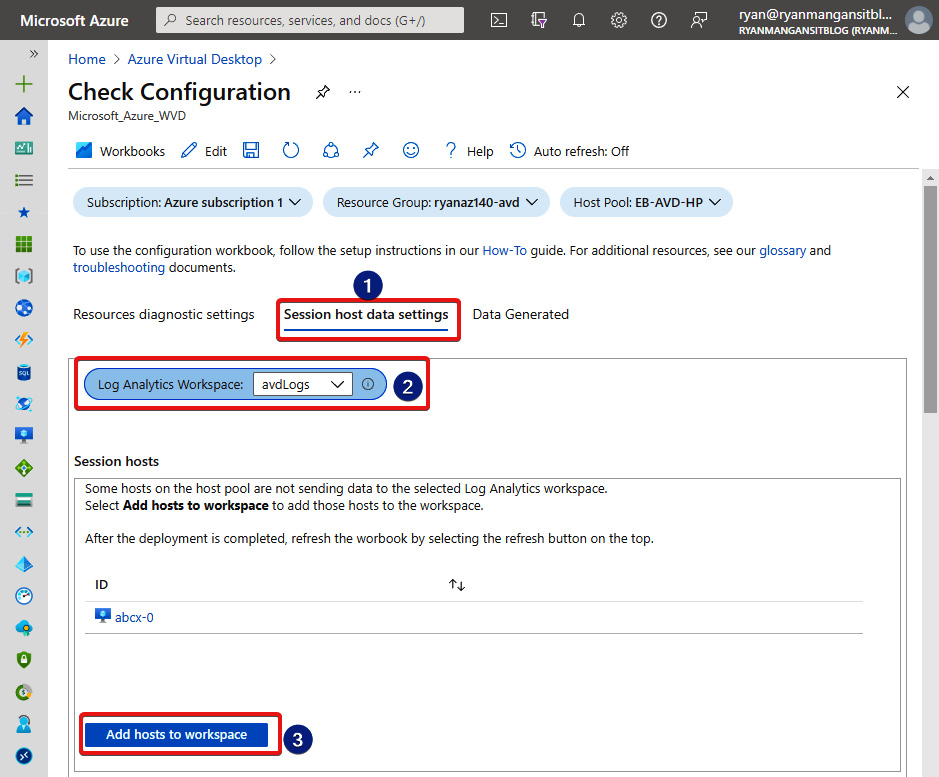
Figure 18.13 – Session host data settings within the Check Configuration workspace
- Once you have clicked Add hosts to workspace, you will see the Deploy Template page appear, which will detail the session hosts configured with the workspace. You can see this page in the following screenshot:
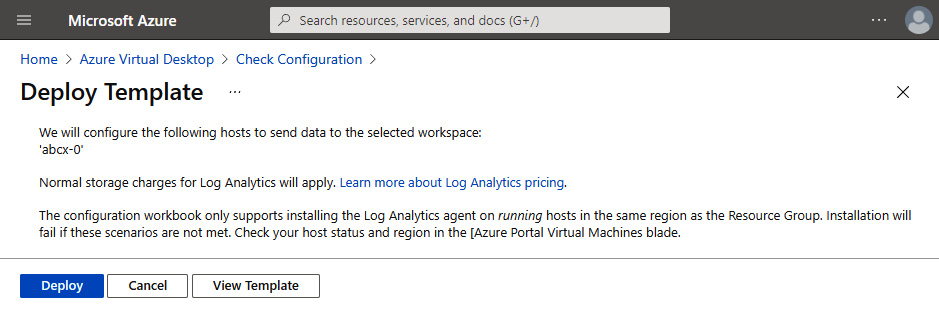
Figure 18.14 – Deploy Template page for configuring session hosts
Once the template is deployed, you can then progress with configuring performance counters.
Configuring performance counters
For the AVD dashboard to display the correct information, we need to ensure that all the correct counters are enabled for each session host. You can enable the counters using configurable performance counters within the Check Configuration workbook on the Session host data settings tab.
As shown in the previous steps, proceed as follows:
- Navigate to the Azure Virtual Desktop page first and then click Workbooks under Monitoring. Select Check Configuration and click the Session host data settings tab. Then, click Configure performance counters. The process is illustrated in the following screenshot:
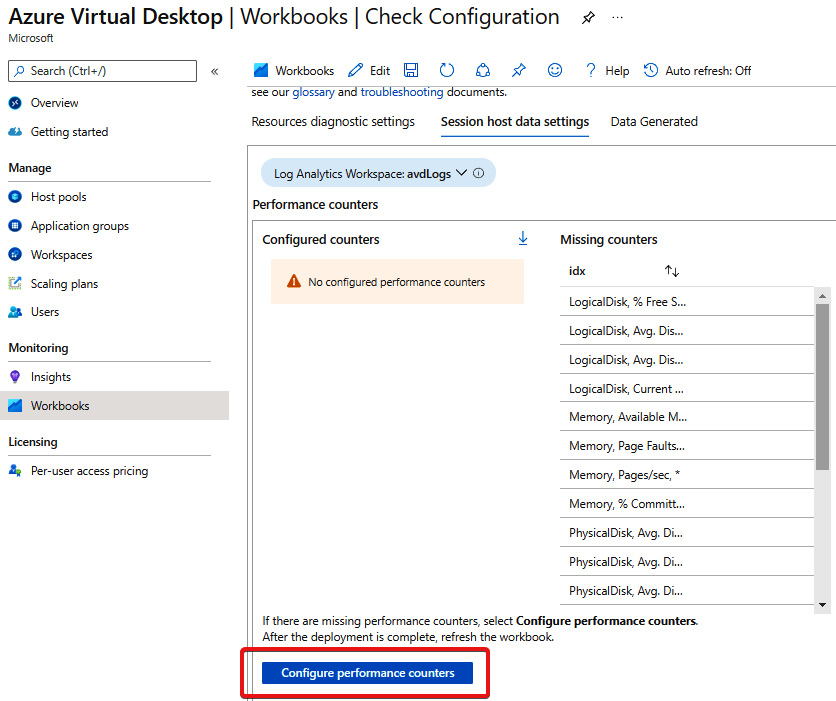
Figure 18.15 – Performance counters section within Session host data settings
- Similar to the previous Deploy Template pages, you will see the following screen. Click Apply Config to set the required performance counters:
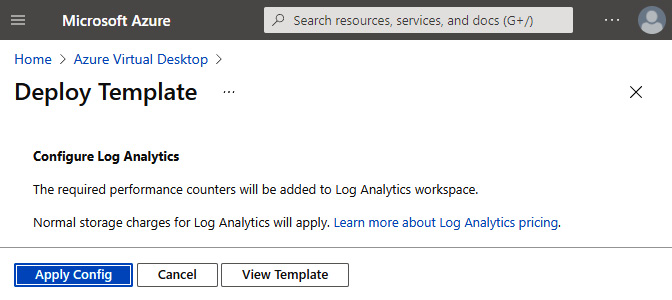
Figure 18.16 – Deploy Template page for configuring the required performance counters
- Once the deployment has been completed, you will see No missing performance counters within the Session host data settings tab, as highlighted in the following screenshot:
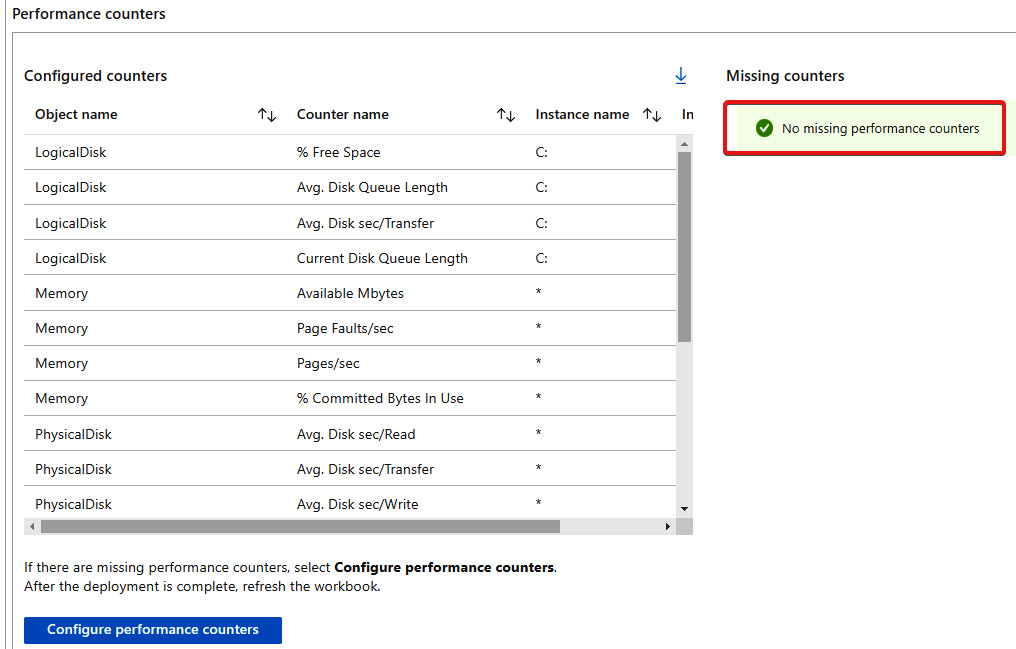
Figure 18.17 – Performance counters section configured correctly, as highlighted under Missing counters
Once you have finished configuring the performance counters, you can then proceed with configuring the event counters.
Configuring events
The final section of configuring Azure Monitor is to configure the event logs. The process is the same as for configuring the performance counters. Scroll down the page to Configure events under Configuration workbook | Session host data settings, and then proceed as follows:
- Click Configure events, as shown in the following screenshot:
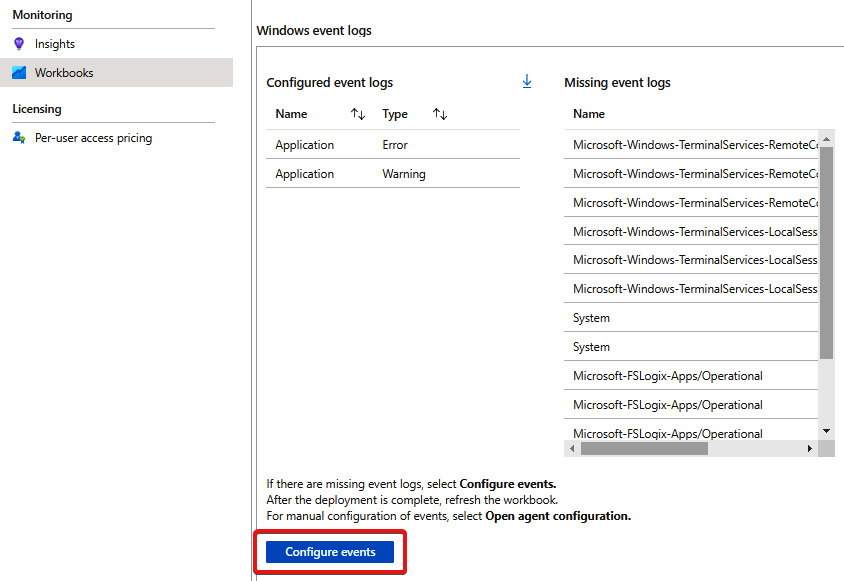
Figure 18.18 – Windows event logs section in the Check Configuration workspace | Session host data settings, with Configure events highlighted
- You will then see the Deploy Template page, which states that the template will deploy the required event logs for the AVD Log Analytics workspace.
- Click Deploy to proceed with the deployment, as illustrated in the following screenshot:
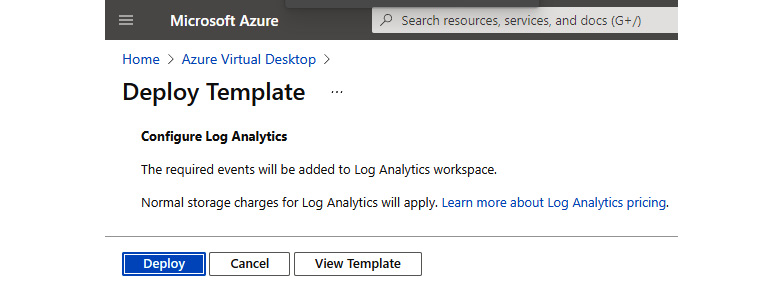
Figure 18.19 – Deploy Template page for configuring the required events logs
- Once deployed, navigate back to the Check Configuration workbook | Session host data settings, and scroll down to the Windows event logs section.
You should see a No missing events found message if the configuration has been done correctly, as highlighted in the following screenshot:
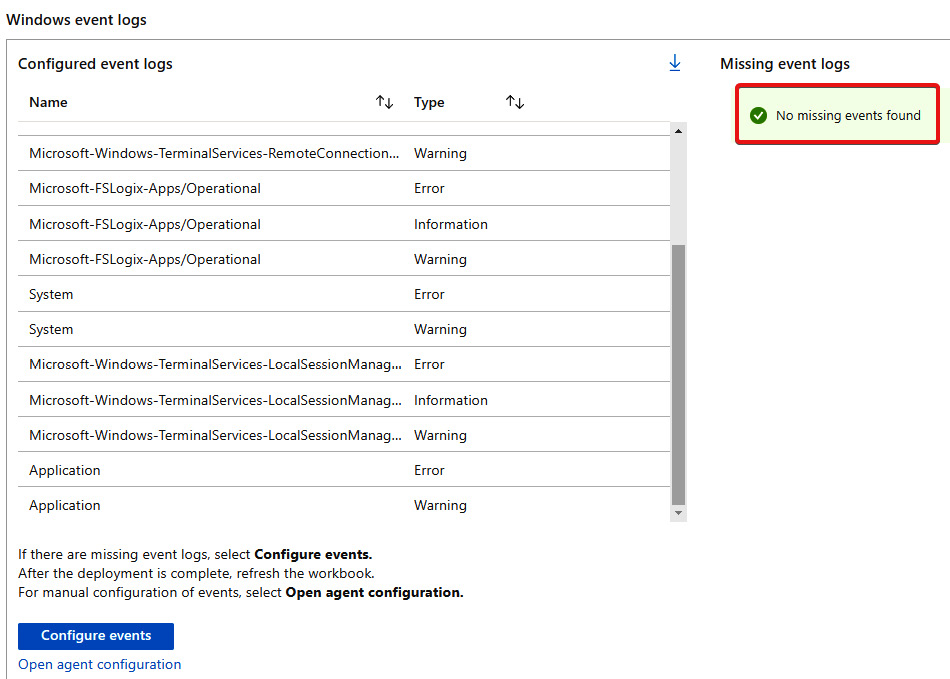
Figure 18.20 – Event logs section has been configured correctly
- You can now click on Insights within the Azure Virtual Desktop page and should be able to see data in a dashboard view, as illustrated in the following screenshot:
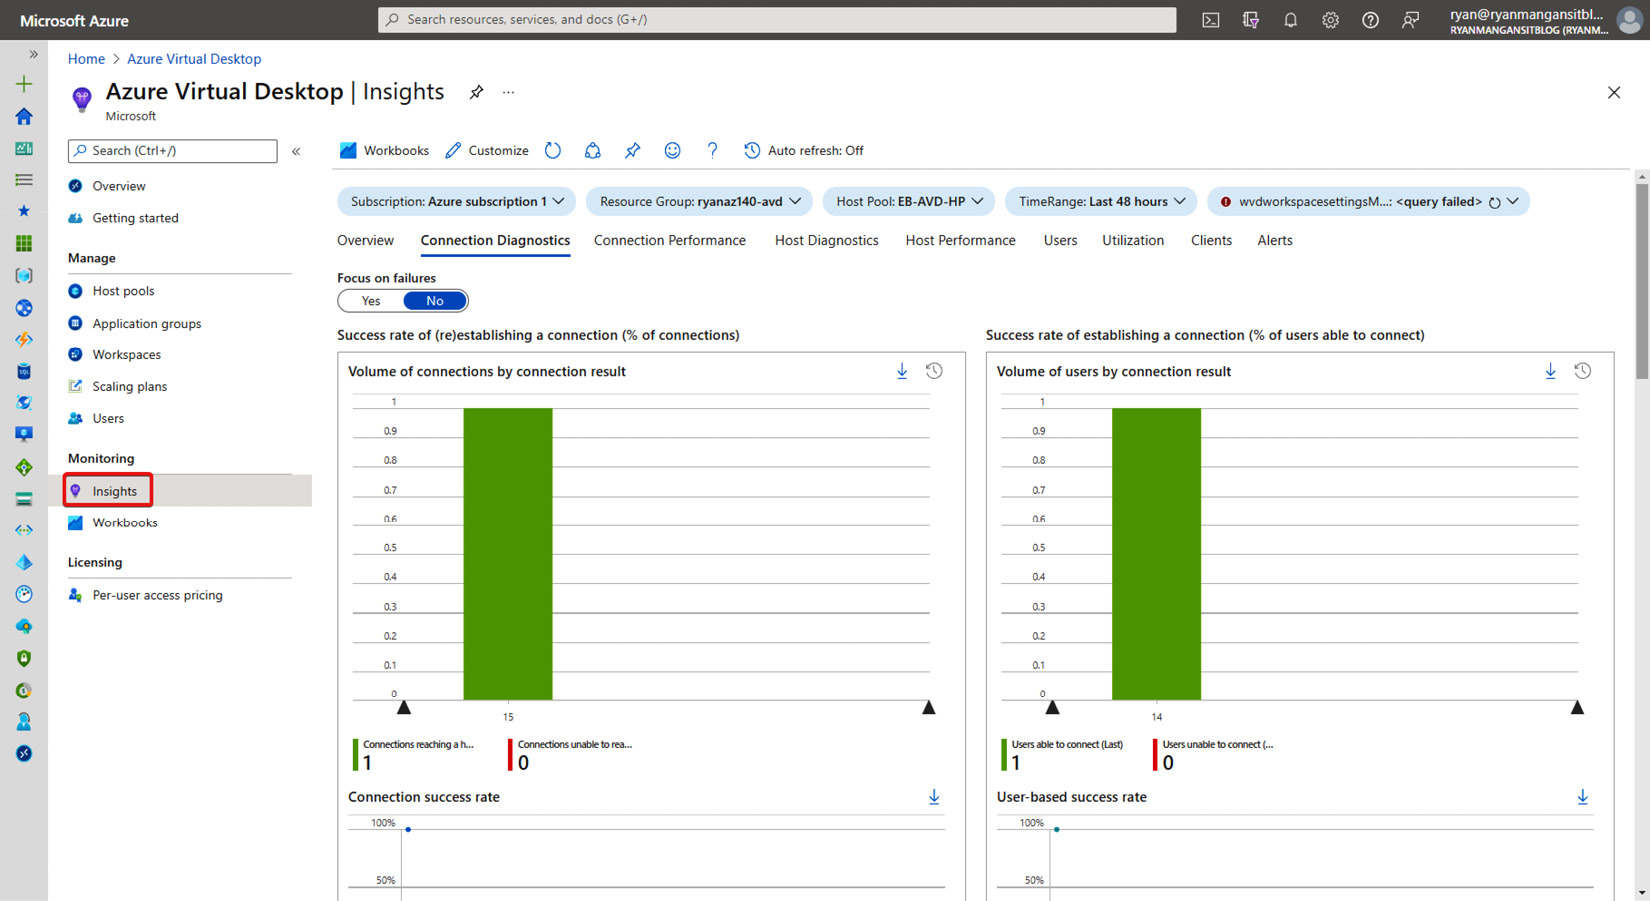
Figure 18.21 – AVD workspace Insights dashboard
Now that we have finished configuring Azure Monitor for AVD, we can take a look at the different areas of the monitoring workspace for AVD.
Using AVD Insights
In this section, we will take a look at how to use Azure Monitor to spot issues and view the current state of an AVD environment.
Important Note
Log Analytics is essentially the data used when visualizing ingested AVD data. AVD Insights is a templated dashboard that uses the configured log analytics and counters to provide IT administrators information about the organization's AVD environment.
Within the AVD Insights workspace, there are nine tabs, as follows:
- Overview
- Connection Diagnostics
- Connection Performance
- Host Diagnostics
- Host Performance
- Users
- Utilization
- Clients
- Alerts
The Overview tab, as highlighted in the following screenshot, provides an overview of the AVD environment, which looks at the Host pool details, Connection Diagnostics, Host Performance, Utilization, and Alerts. We can look at the specific workspace tabs to drill down for more detailed information:
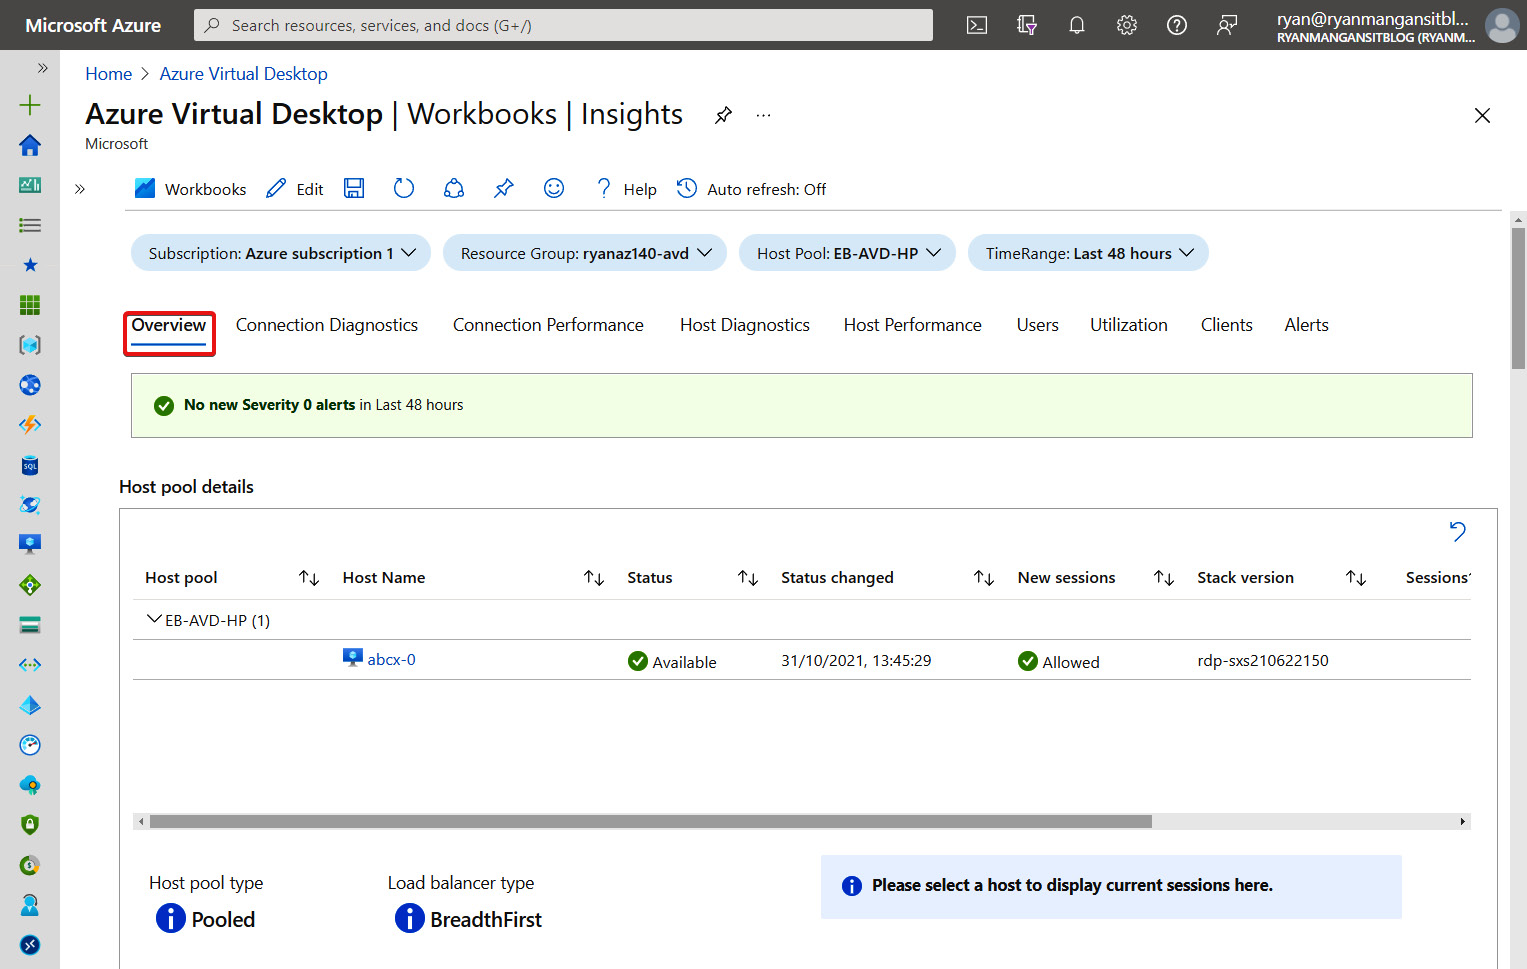
Figure 18.22 – Overview tab of the AVD Insights workbook
The Connection Diagnostics tab provides details on connections. This allows you, as the IT administrator, to review any alerts and investigate any problems. In this example, I noticed there was an FSLogix error relating to the storage path not being found, which shows up in the Connection Diagnostics tab:
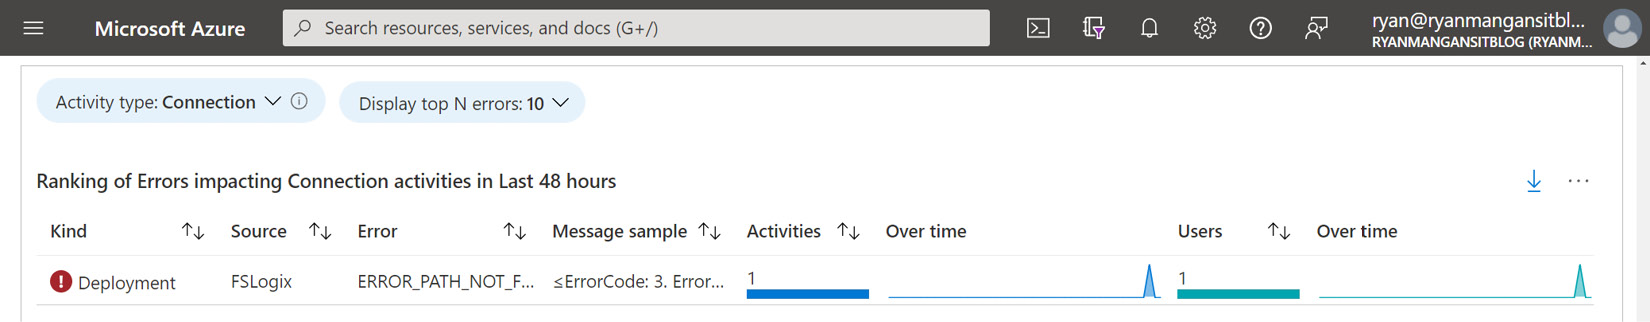
Figure 18.23 – List of errors impacting connections
The following screenshot shows a drill-down of errors that provides more granularity:
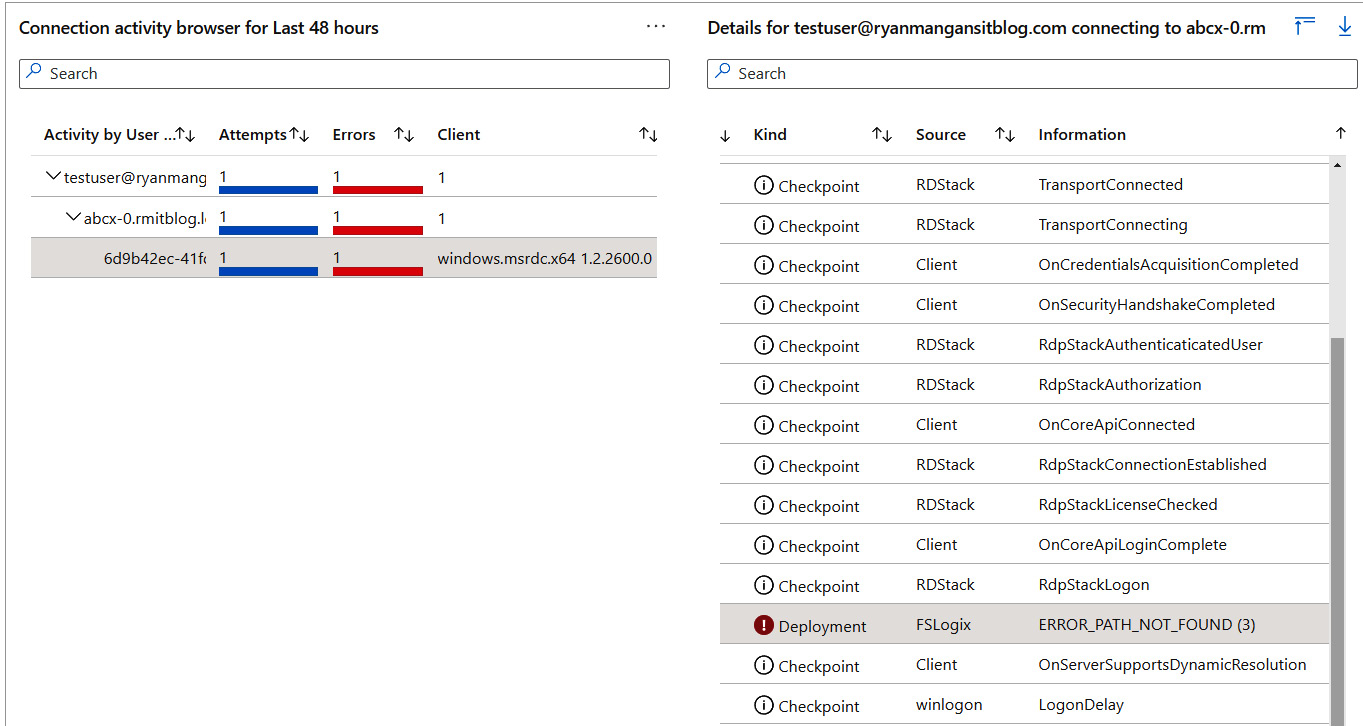
Figure 18.24 – A more detailed breakdown of connection events and associated errors
The Connection Performance tab, shown in the following screenshot, provides information on new and existing sessions, which enables IT administrators to review slow sign-in times and diagnose possible login issues:
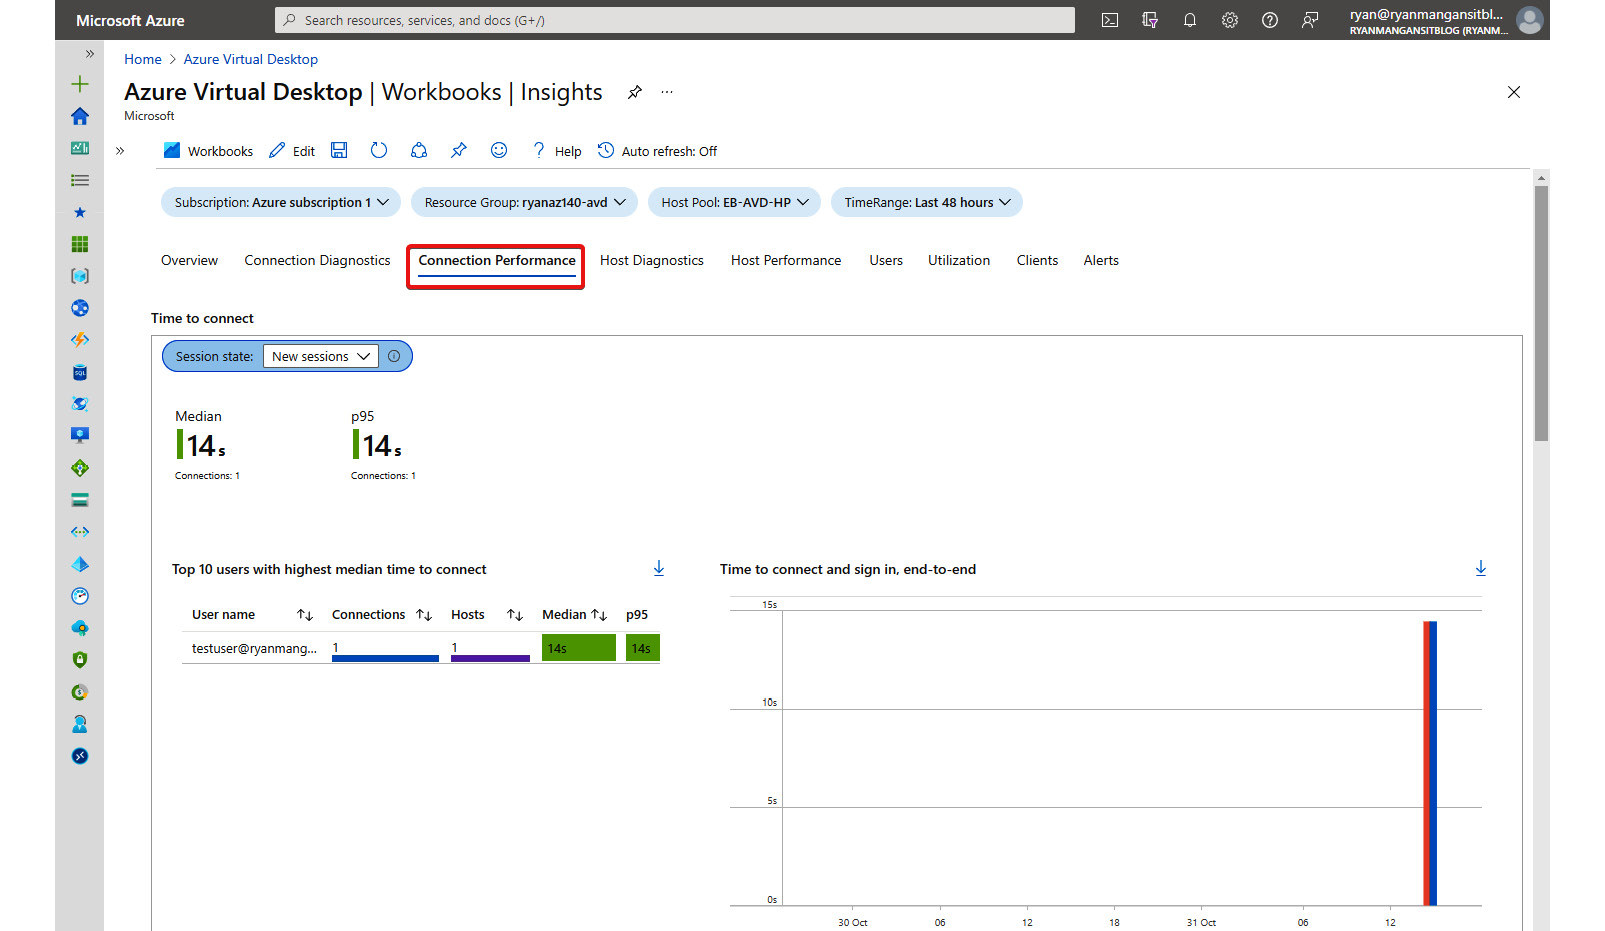
Figure 18.25 – The Connection Performance tab visualizes performance issues/communication issues relating to the user or host
The Host Diagnostics tab, shown in the following screenshot, provides information on the host pool configuration, performance counters, events, and any errors. This can help you pinpoint any issues related to a session host and monitor the central processing unit (CPU) and memory usage:
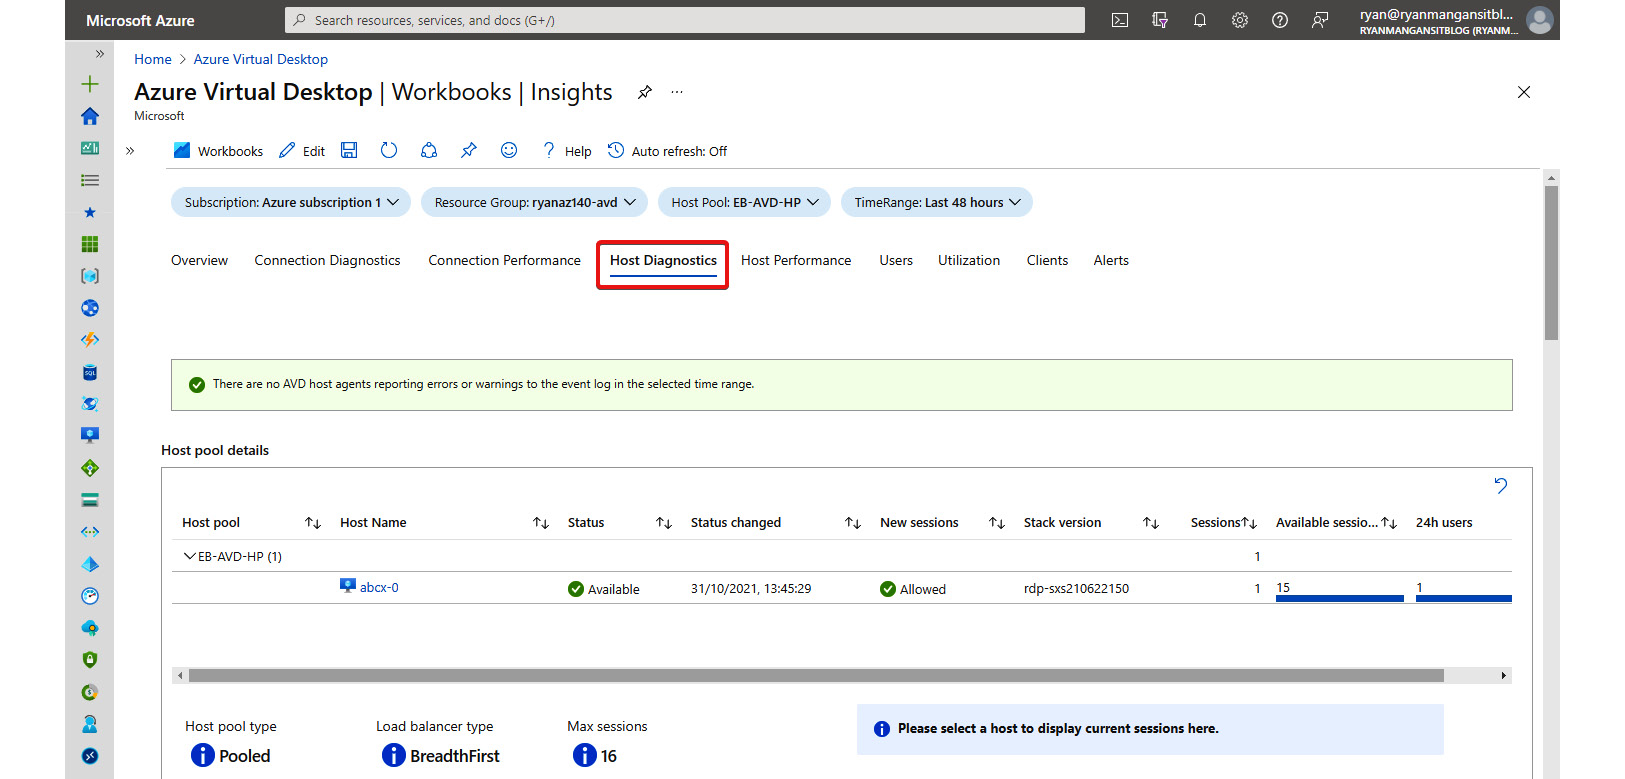
Figure 18.26 – Host Diagnostics tab
The Host Performance tab, shown in the following screenshot, provides insights into the overall performance and enables IT administrators to drill down into possible issues with processes, CPU, memory, and disk queuing. This helps to identify the host saturation and any applications that may be consuming a lot of resources:
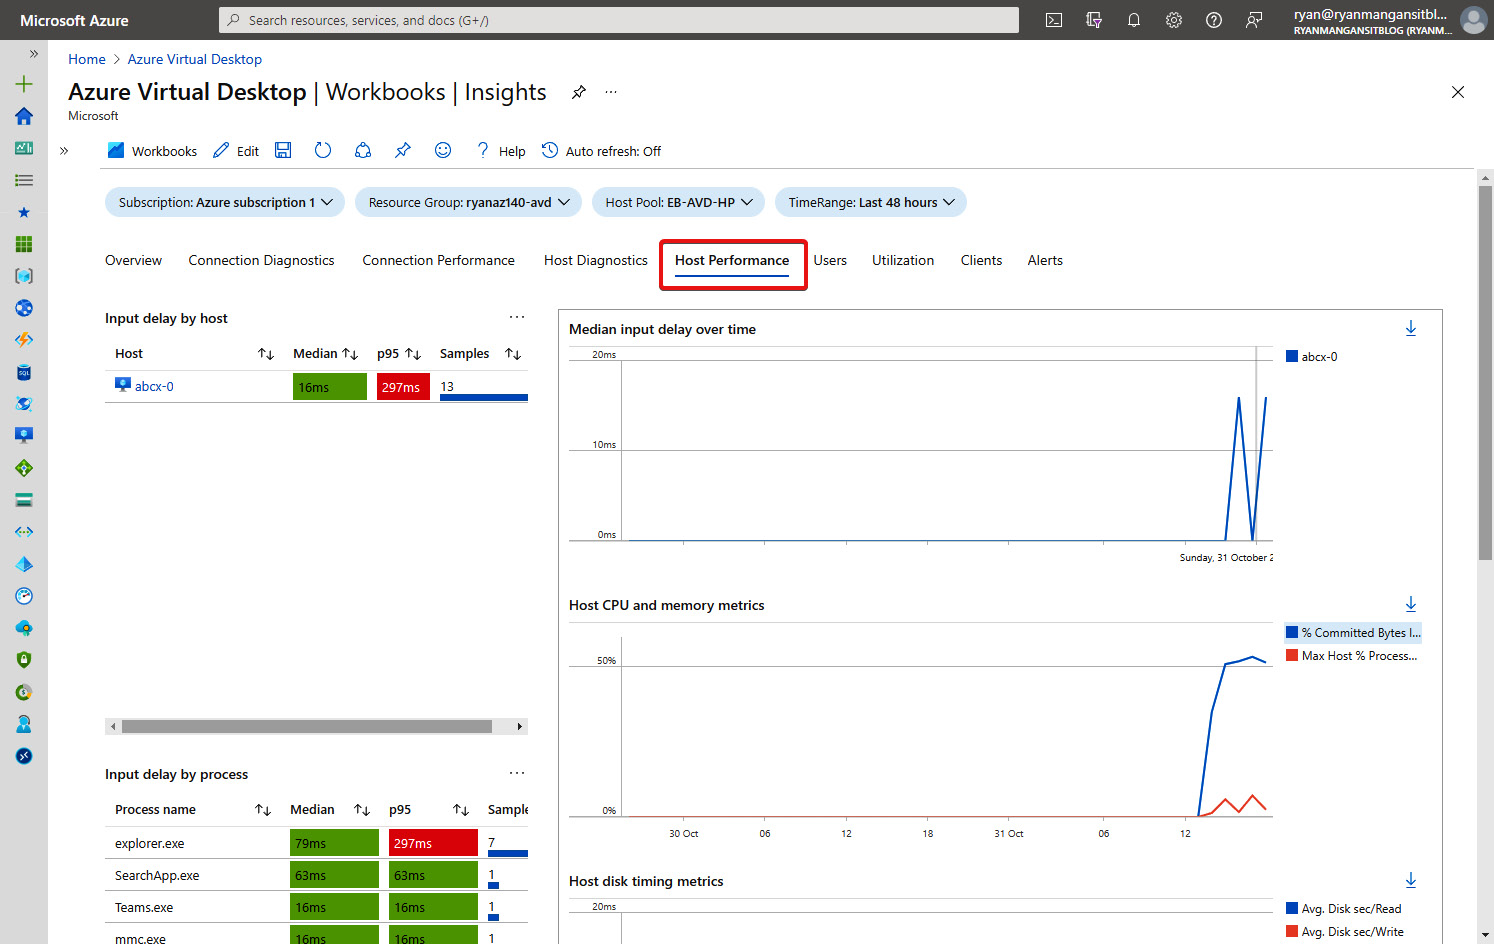
Figure 18.27 – Host Performance tab
The Users tab, shown in the following screenshot, provides a detailed output on user performance and any errors relating to a specific user. This tab helps to identify specific user issues and allows IT administrators to quickly understand the client device in use, client version, and any errors during connectivity:
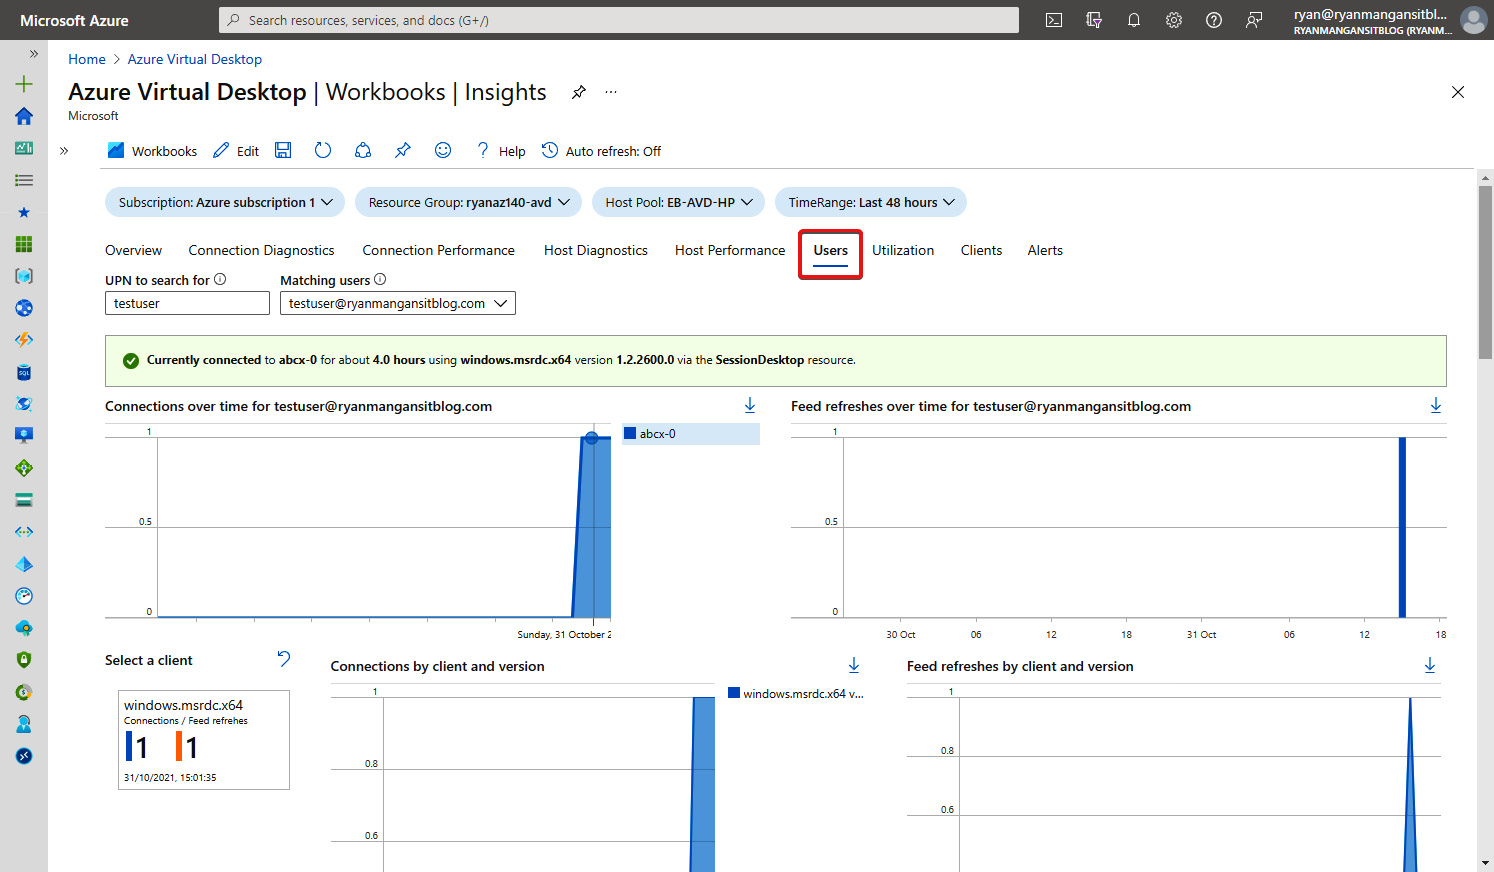
Figure 18.28 – Users tab, which details user connection and client details
The Utilization tab shows the current utilization metrics of your AVD environment. This is particularly useful for capacity management and understanding any potential performance degradation of the environment.
The Clients tab, illustrated in the following screenshot, shows connections and feed refreshes and the version of the client in use. IT administrators can get a full picture of which clients are being used within the AVD environment from here:
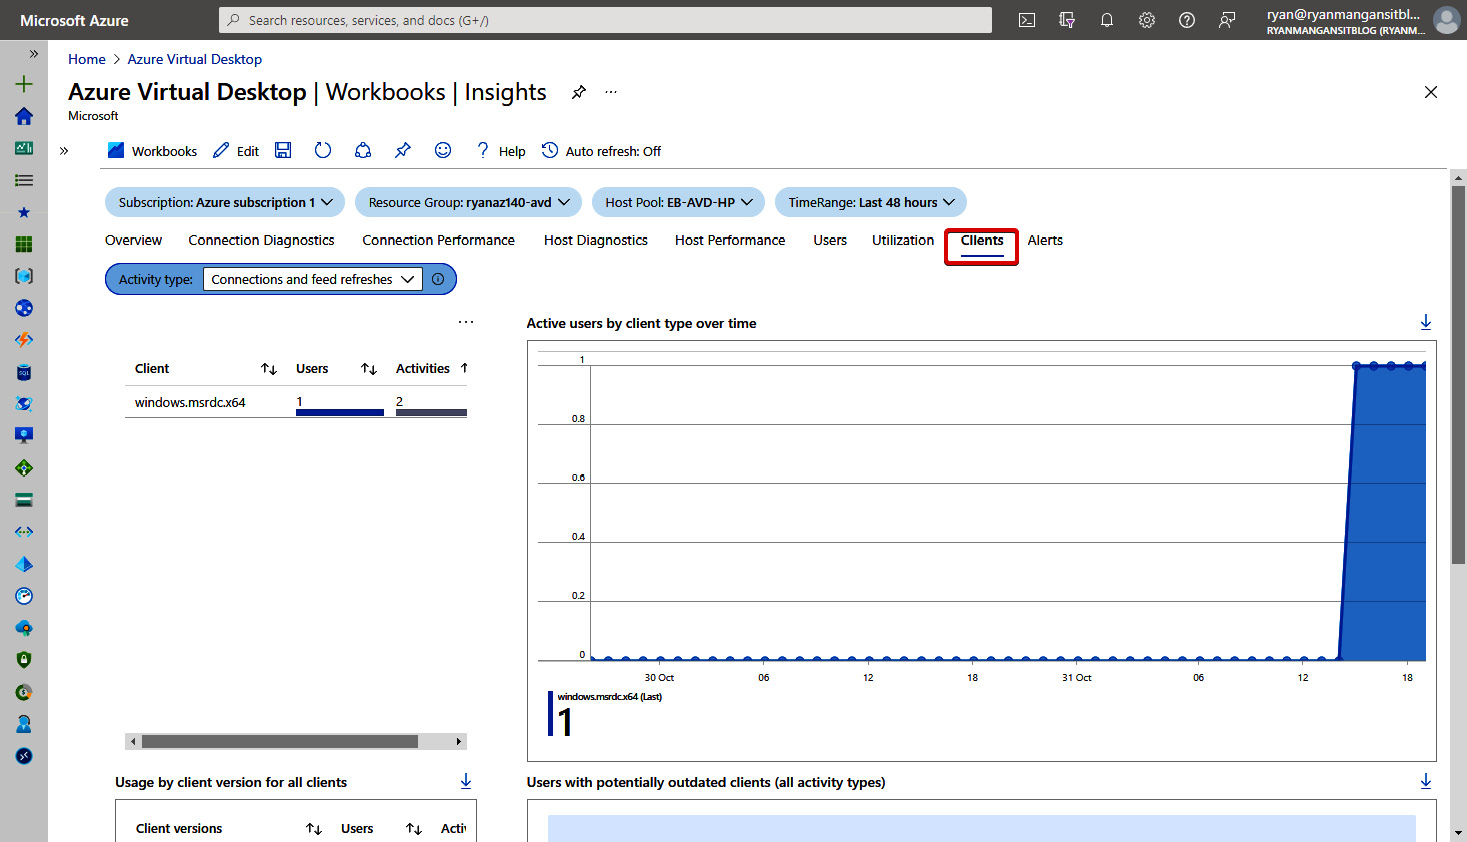
Figure 18.29 – Clients tab, which provides details on client and version usage
The final tab, Alerts, is used to show the number of alerts raised over a period of time, and the severity of those alerts. The tab can be seen in the following screenshot. We will cover the configuration of alerts in the Setting up alerts using alert rules section:
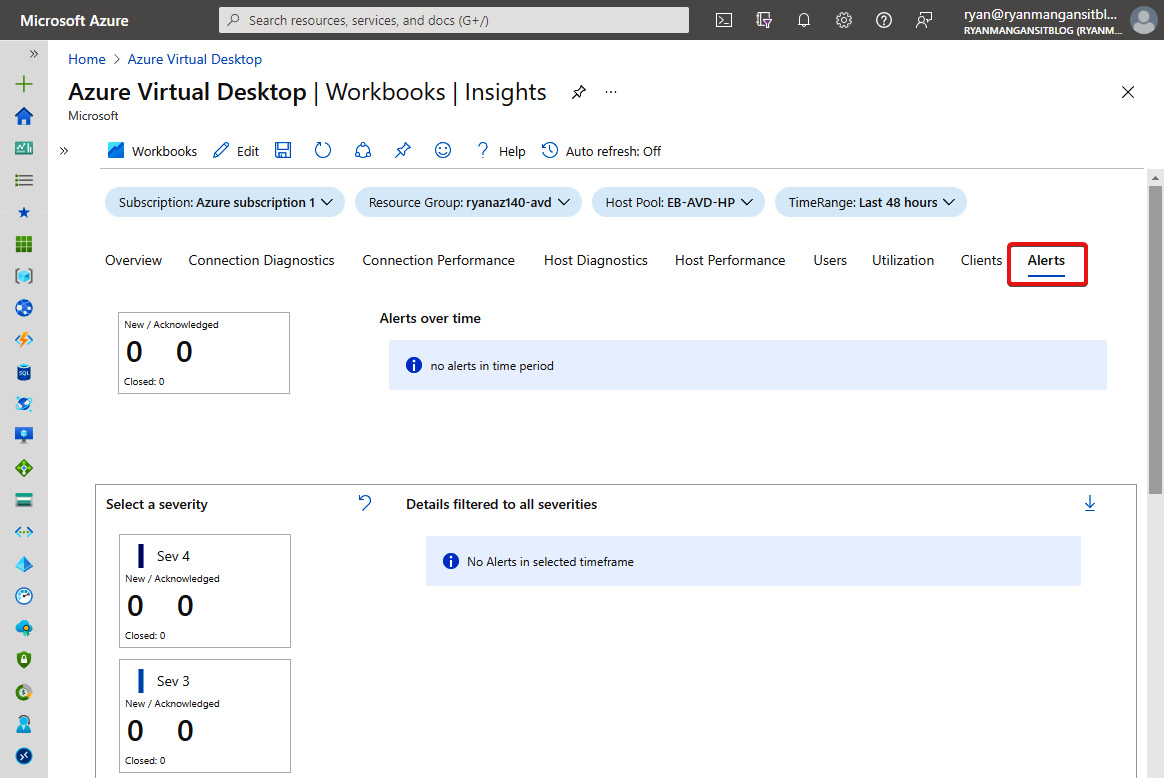
Figure 18.30 – Alerts tab
In this section, we took a quick look at the AVD Insights workspace and the different tabs and learned how IT administrators can use Azure Monitor to quickly diagnose and resolve AVD issues. In the next section, we take a look at setting up alerts based on outputs from a query.
Setting up alerts using alert rules
Within Log Analytics, you can query logs and set a frequency. You can also set an alert based on the output of the query. Rules can be triggered using one or more actions.
Tip
Using alerts to notify administrators or specified users about issues within your AVD environment can be helpful for those who are not continually monitoring the Insights page. This can also be useful for IT administrators who may be on-call or need to receive a text message or other notification of a possible issue/failure.
To set up an alert, proceed as follows:
- Start by typing monitor in the Azure search bar and click Monitor from the search results that appear, as illustrated in the following screenshot:
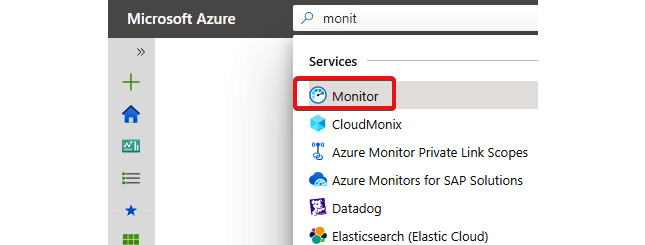
Figure 18.31 – Azure Monitor service within the search bar
- Once within the Azure Monitor page, click on the Alerts icon located within the menu on the left, as illustrated in the following screenshot:
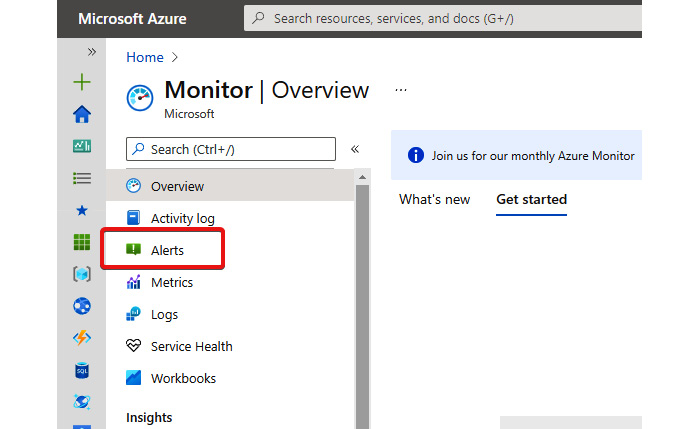
Figure 18.32 – Alerts page icon in Azure Monitor
- Click the New alert rule button, as highlighted in the following screenshot, to load the Create alert rule page:
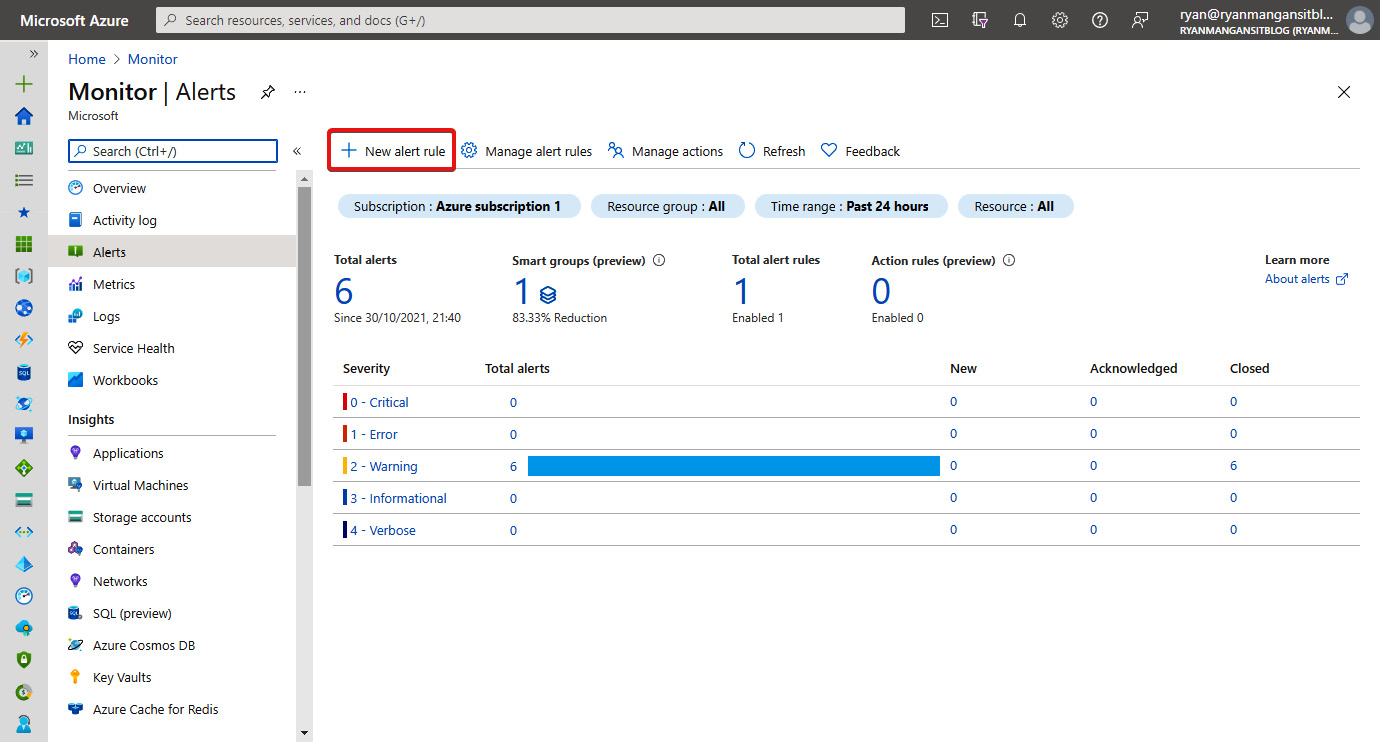
Figure 18.33 – Alerts page and the button to create a new alert rule
- In this example, we are going to create a simple alert for FSLogix disk-related issues. Within the Create alert rule page, click on the Select resource option, as highlighted in the following screenshot:
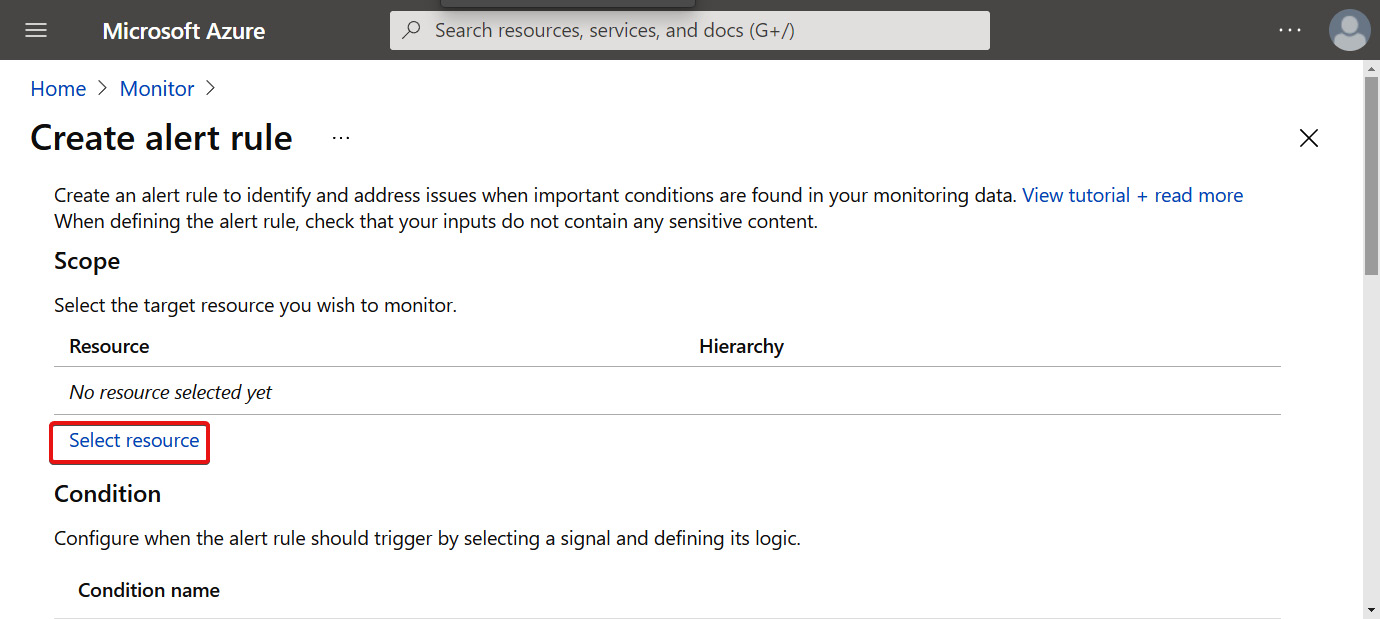
Figure 18.34 – Select resource link on the Create alert rule page
- Within the Select a resource page, click the required subscription and click Done, as illustrated in the following screenshot:
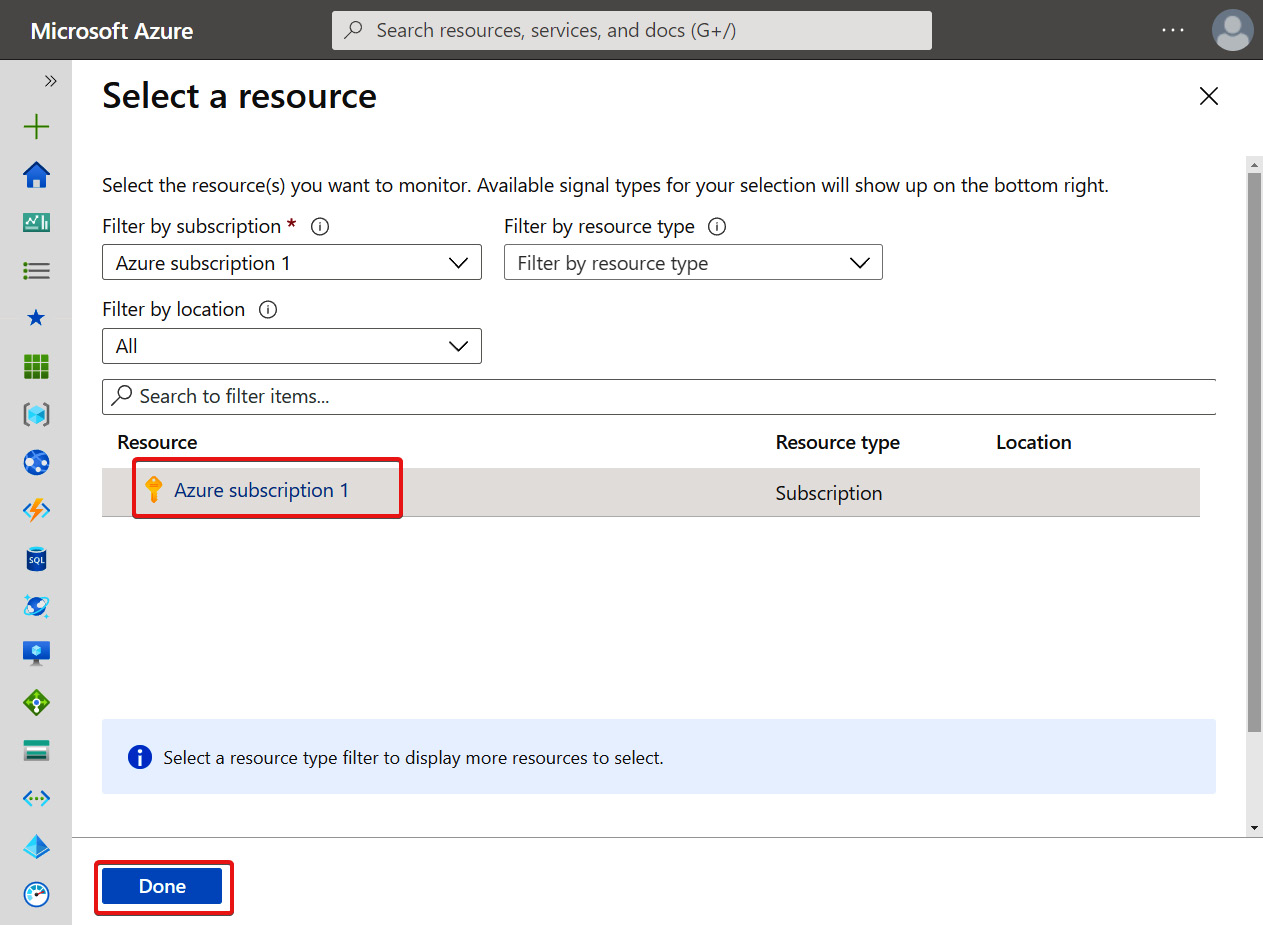
Figure 18.35 – Select a resource page within the Create alert rule section
- I found that I had to go back in for a second time to select the required Log Analytics workspace. For some reason, it did not apply the first time, so I had to repeat the step. This is shown in the following screenshot:
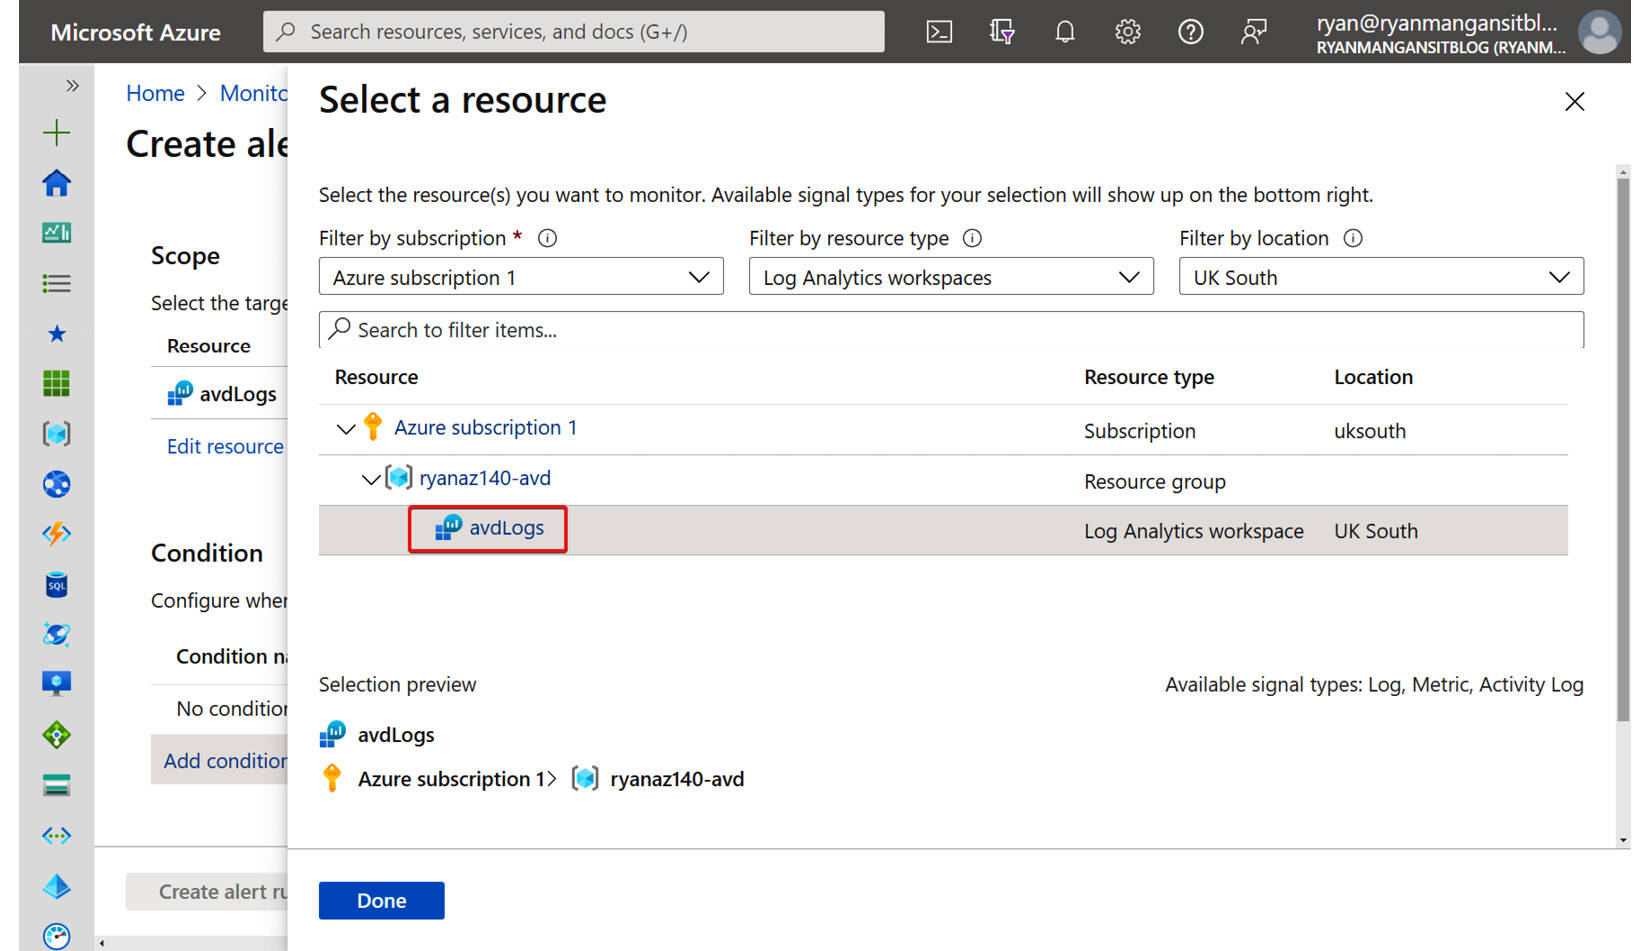
Figure 18.36 – Selection of the Log Analytics workspace
- Once complete, we need to add a condition. We need to click the Add condition option to add a condition, as shown in the following screenshot:
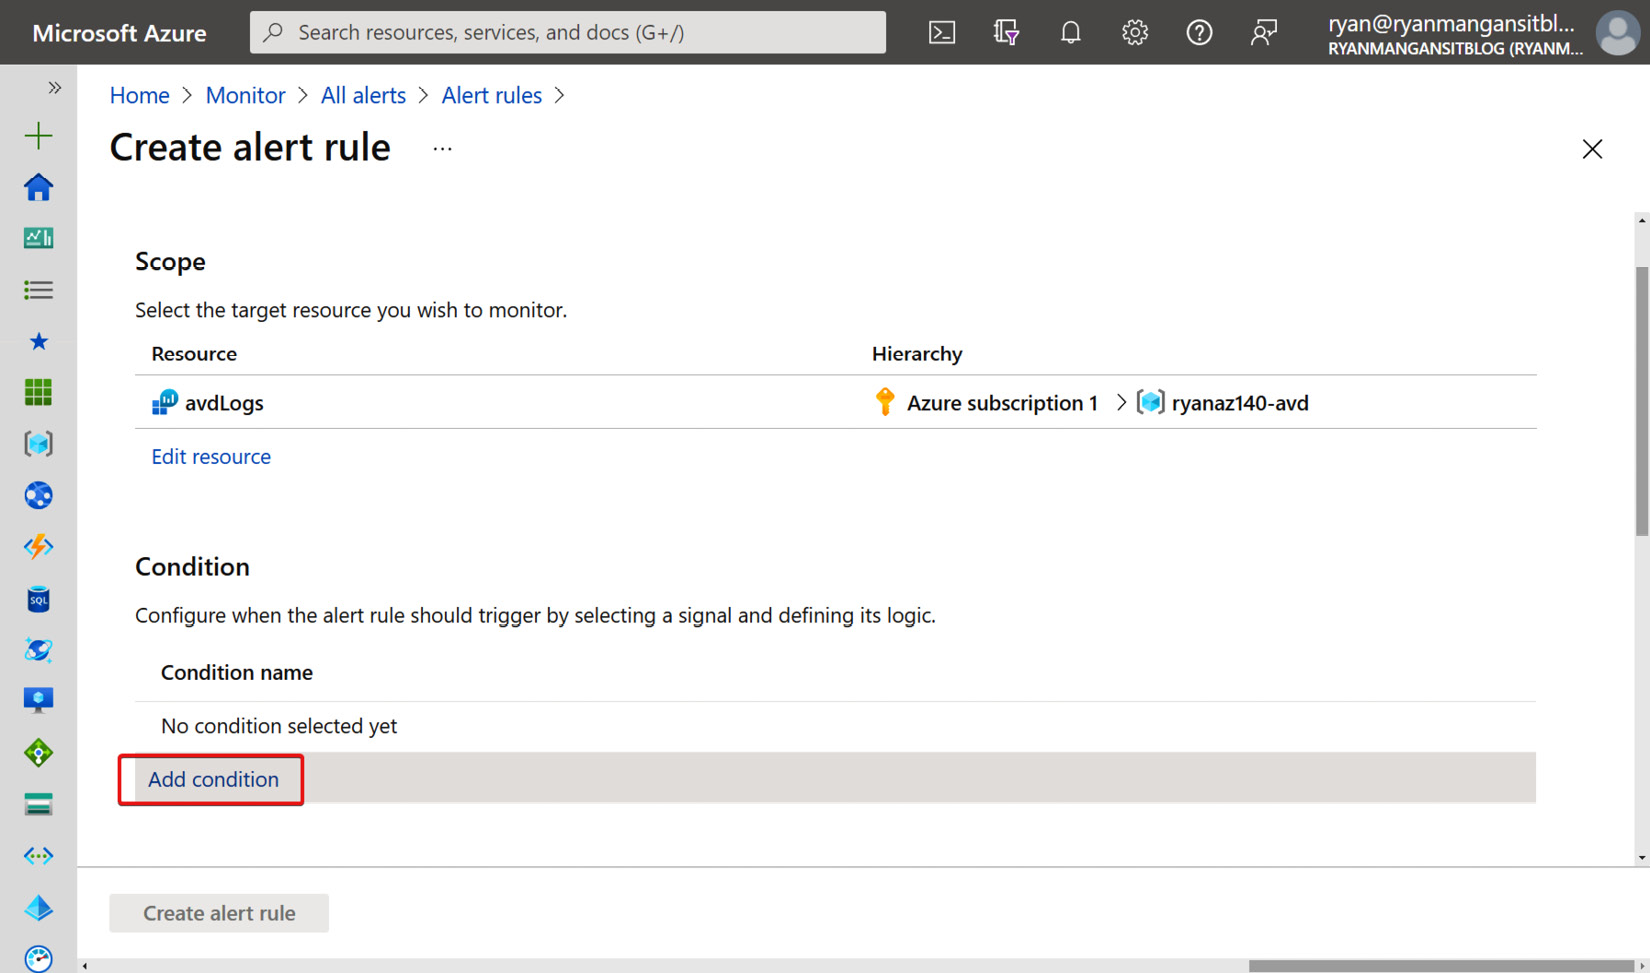
Figure 18.37 – Add condition button in the Create alert rule page
- Within the Select a signal blade, choose the required signal name. In this example, we will select the Event signal, as shown in the following screenshot:
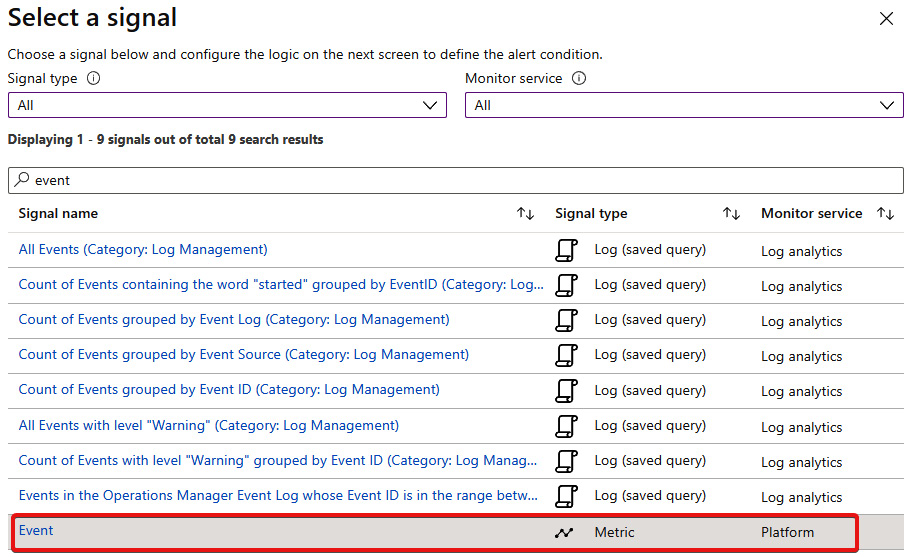
Figure 18.38 – Select a signal page with the signal name metric selected
- Once you have selected the Event signal, you will see the Configure signal logic page appear. Within this page, you will set the Microsoft-FSLogix-Apps/Operational event log and the EventID value as 26, which is a common event, as shown in the following screenshot.
Important Note
The EventID value of 26 is related to the failure to load an FSLogix profile.
- You then need to set the Alert logic field to a Static threshold, the Operator field to Greater than or equal to, the Aggregation type field to Total, the Threshold value field to 5, and the Unit value to Count.
Once complete, click the Done button, as illustrated in the following screenshot:
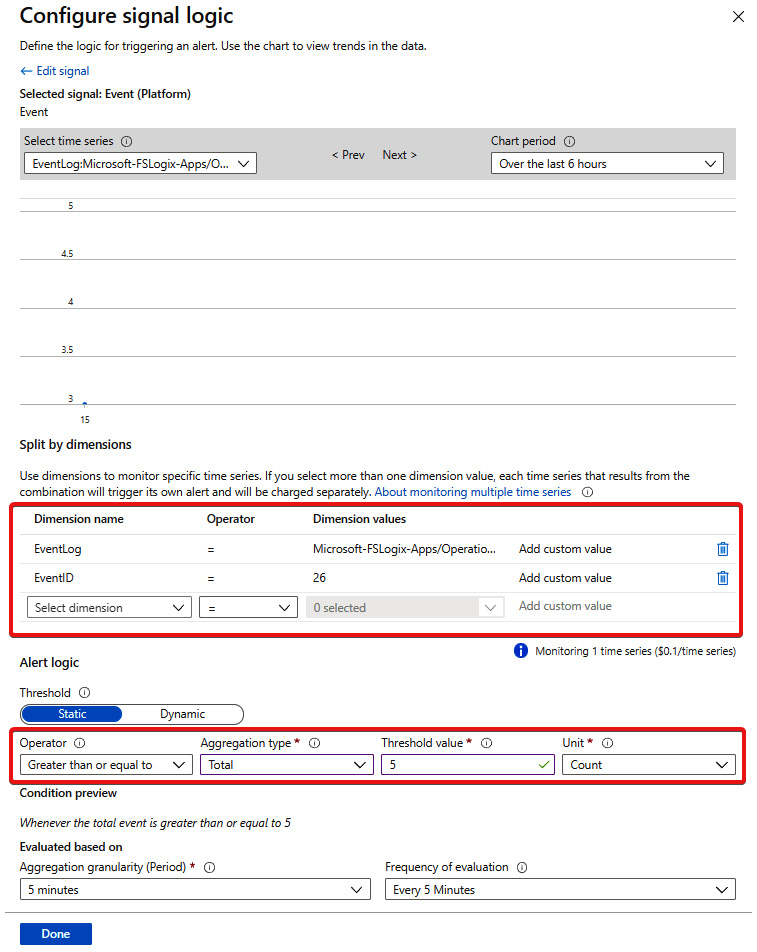
Figure 18.39 – Configure signal logic page
The next step is to create an action group, and in this example, we only need a notification. You can configure actions in more advanced configurations. Proceed as follows:
- Click on the Add action groups button within the Create alert rule page, as highlighted in the following screenshot:
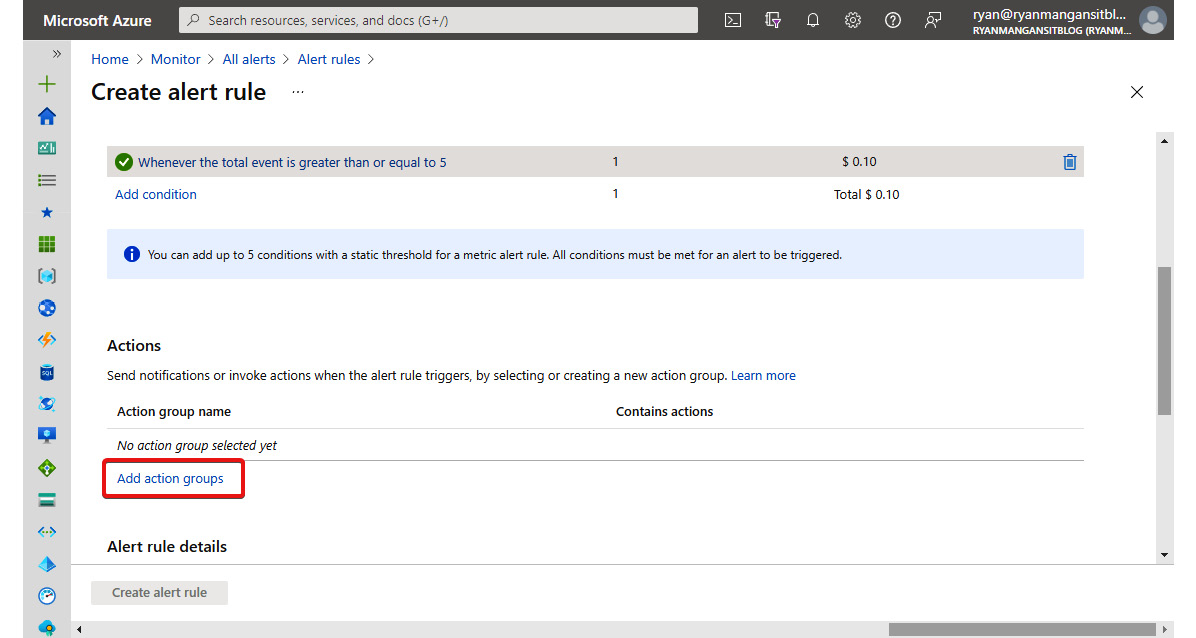
Figure 18.40 – Add action groups button
- In this example, we will create a new action group for notifying IT administrators when an alert is triggered. Click + Create action group, as highlighted in the following screenshot:
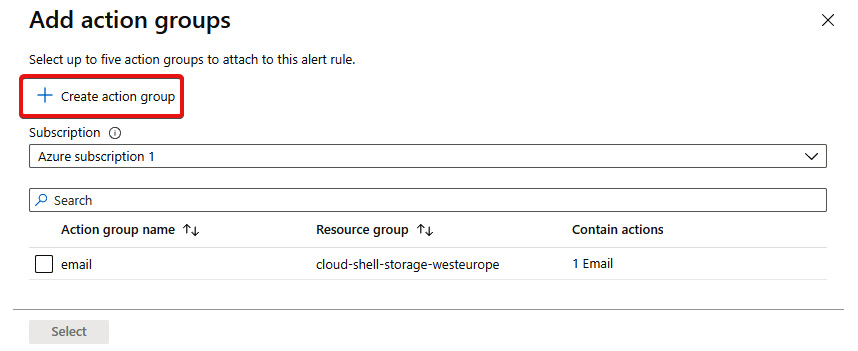
Figure 18.41 – + Create action group button
- Once the Create action group page appears, select a Resource group type, then choose an Action group name value and a Display name value within the Instance details section, as highlighted in the following screenshot:
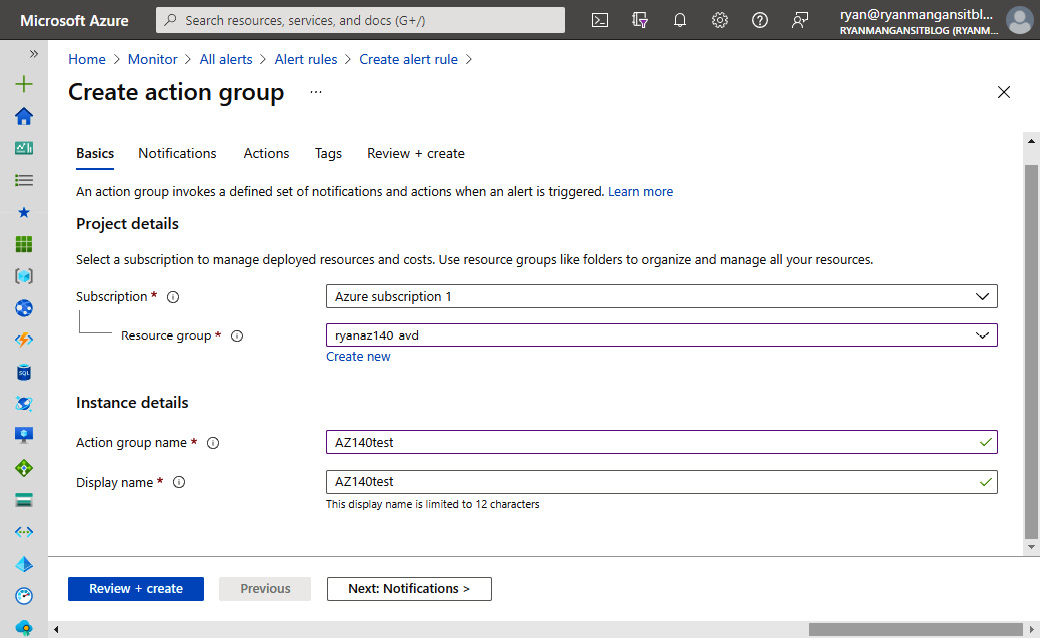
Figure 18.42 – Create action group page
- Once you have configured all the required fields on the Basics tab, click the Notifications tab.
- Within the Notifications tab, you can configure a number of different notifications. In this example, we will configure email only. As shown in the following screenshot, we have set the Notification type value to Email/SMS message/Push/Voice and set the Name value to Admin email:
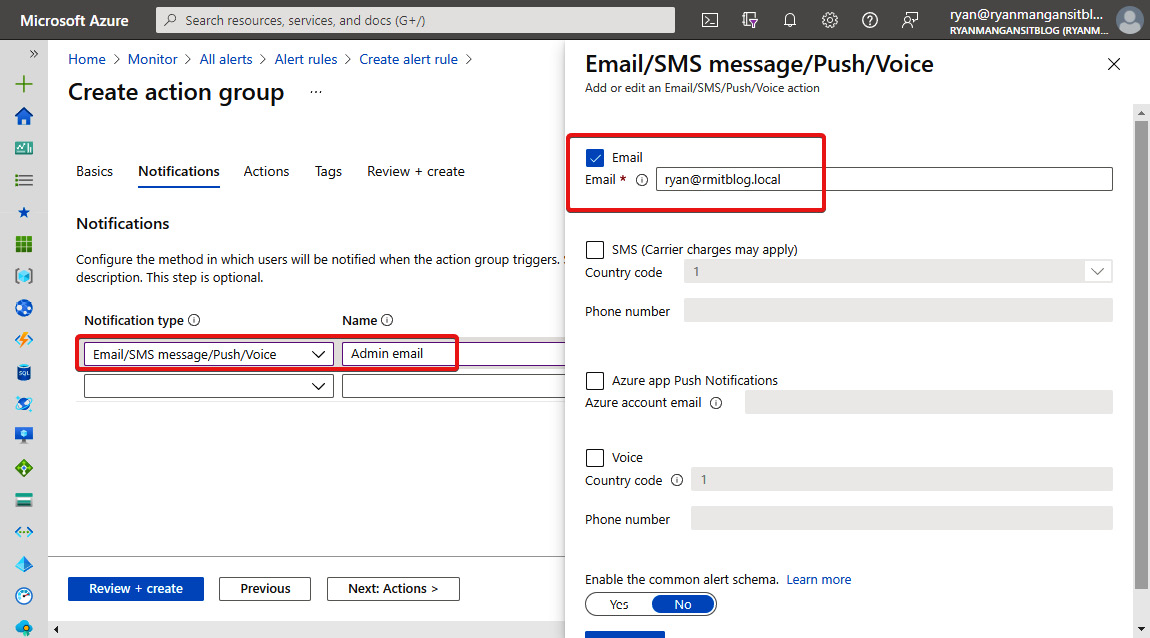
Figure 18.43 – Email configuration within the Notifications tab on the Create action group page
- Once the notifications have been configured, proceed with the Review + create page. Check the configuration and click Create, as illustrated in the following screenshot:
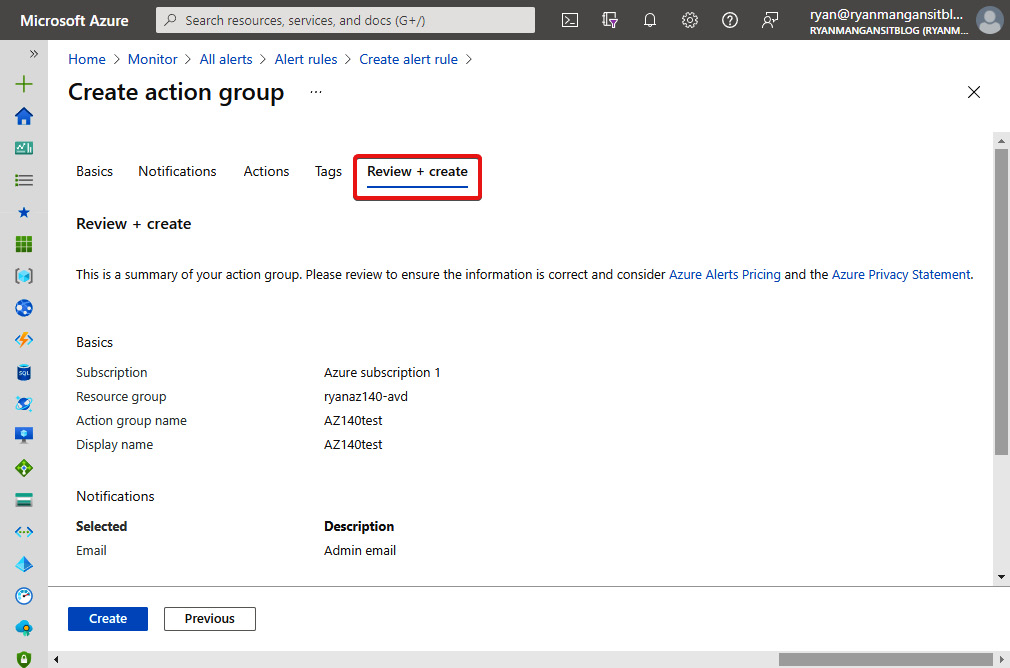
Figure 18.44 – Review + create tab
- You should now be able to see the new action group name we just created under the Actions section within the Create alert rule page, as highlighted in the following screenshot:
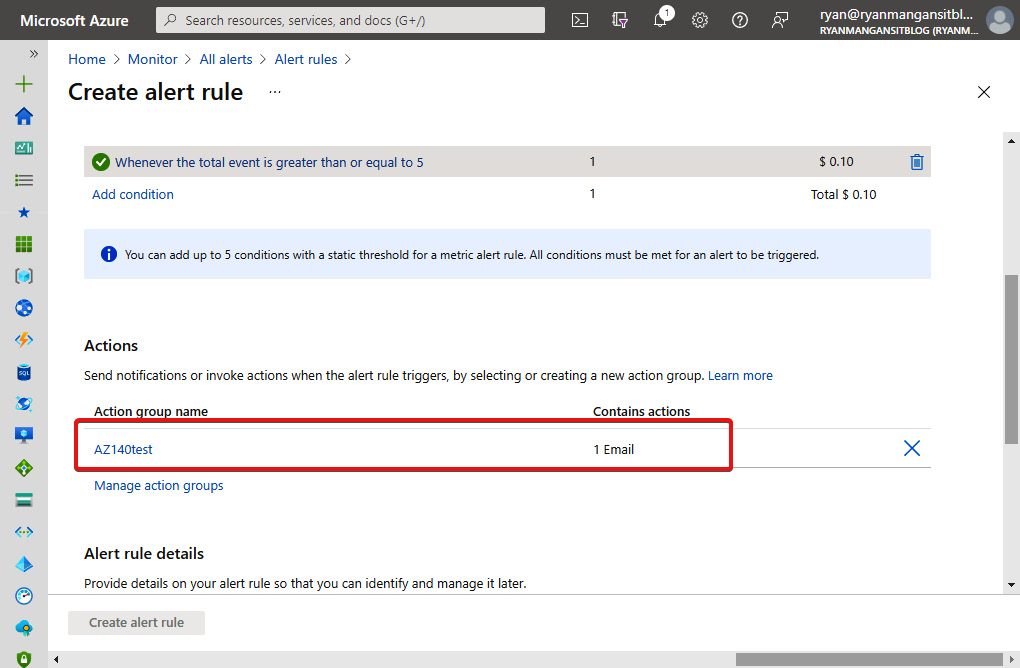
Figure 18.45 – Added action group name
- The last action on the Create alert rule page is to complete the alert rule details located at the bottom of the page. Enter values in the Alert rule name, Description, and Resource group fields, and enter a Severity ranking, as shown in the following screenshot. Once finished, click Create alert rule:
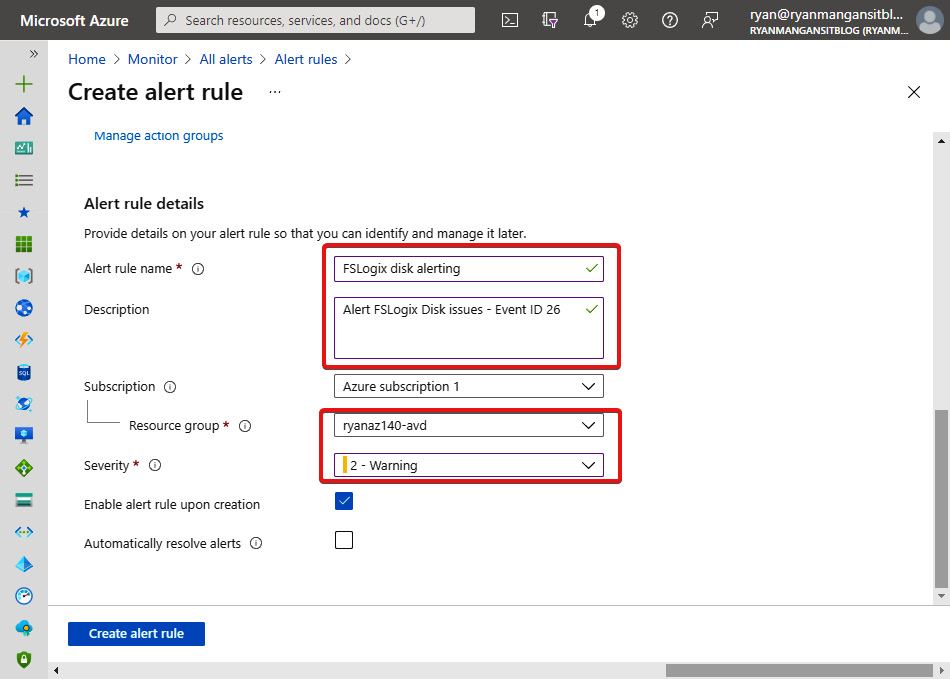
Figure 18.46 – Alert rule details within the Create alert rule page
- You will now be able to see the new alert within Monitor | All alerts, as shown in the following screenshot:
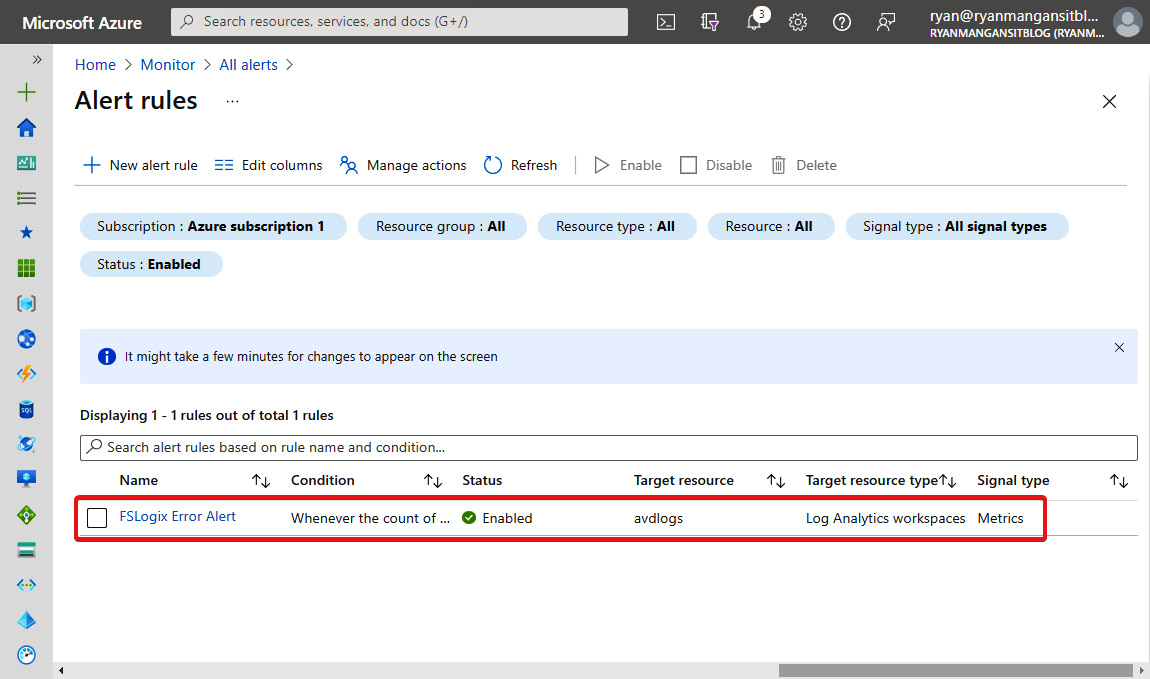
Figure 18.47 – Newly created FSLogix alert rule
This section looked at creating an alert rule to notify IT administrators of a specific issue or problem with the AVD environment. The example I showed was a simple FSLogix alert using event logs; however, you can create custom and customized alerts specific to your environment.
In the next section, we take a look at Kusto and how you can use this query language to query AVD to diagnose issues and pull useful information specific to your environment.
Introduction to Kusto
Kusto Query Language (KQL) is a read-only language used to query datasets within Microsoft Azure. Similar to Structured Query Language (SQL), Kusto can be used to query data, but it can't update or delete, as SQL can. Kusto can be used when querying AVD services and other related components, and you can create custom queries to output information that is important to you.
You can use Kusto with the following Azure services:
- Azure Application Insights
- Azure Log Analytics
- Azure Monitor Logs
- Azure Data Explorer
- Microsoft Defender for Endpoint
- Microsoft Sentinel
Fun Fact
It is understood that the name Kusto was an internal code name named after Jacques Cousteau, as a reference to exploring the ocean of data. You may notice that reference when launching the Kusto Explorer tool, which we will look at shortly. The development of Kusto was focused on addressing the need for fast and scalable logs analytics.
Connecting Log Analytics to Kusto Explorer
Before we start writing a basic query for AVD, we first need to look at how to use Kusto Explorer. Kusto Explorer is a free tool you can download from the Microsoft Docs page here: https://aka.ms/ke.
Once you have downloaded and installed Kusto Explorer, you'll need to connect to your Azure Log Analytics workspace using the following (cluster connection):
Remember to change the subscription identifier (ID), resource group name, and workspace name within the preceding string (cluster connection).
To connect your Log Analytics workspace to Kusto Explorer, you will need to add a connection, as shown in the following screenshot:
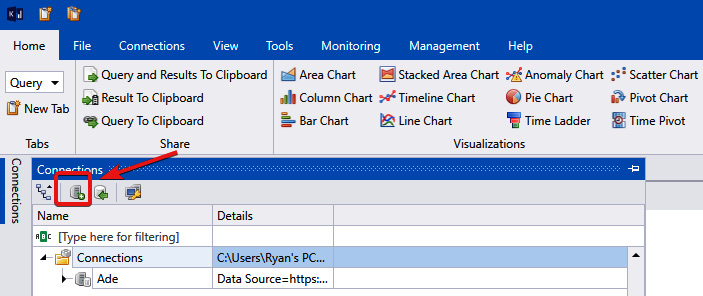
Figure 18.48 – Add connection icon within Kusto Explorer
Enter the cluster connection (the Uniform Resource Locator (URL) for Log Analytics), as illustrated in the following screenshot:
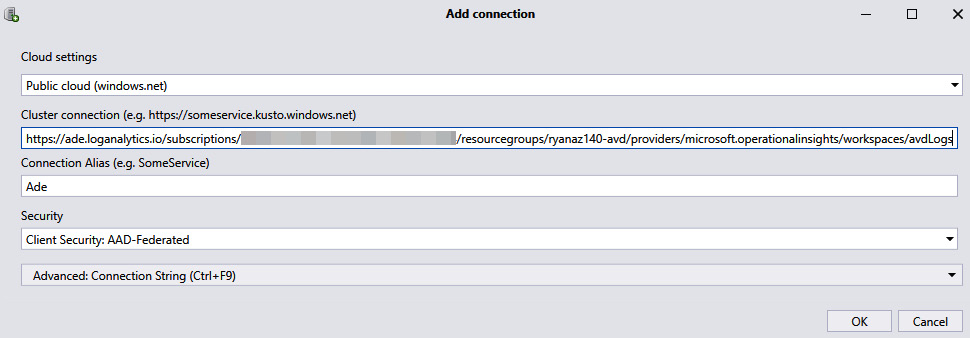
Figure 18.49 – Adding a cluster connection within Kusto Explorer
Once connected, you should be able to see the Connections tab and a list of tables within the tree, as shown in the following screenshot:
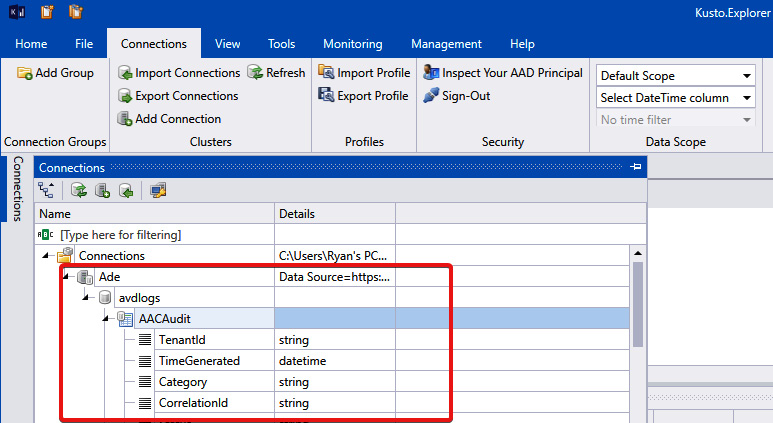
Figure 18.50 – Connection to the Log Analytics workspace
Now that we have configured Kusto Explorer, we can proceed with creating queries for AVD.
Creating queries for AVD using Kusto Explorer
In this section, we will take a look at a few quick queries you can build using Kusto Explorer. You can create and customize queries within Azure; however, Kusto Explorer allows you to work on them in a nice client application and produce graphs as well.
Let's get started with a basic AVD error query.
Within the Connections tab, right-click on Connections and select Open in New tab, as highlighted in the following screenshot:
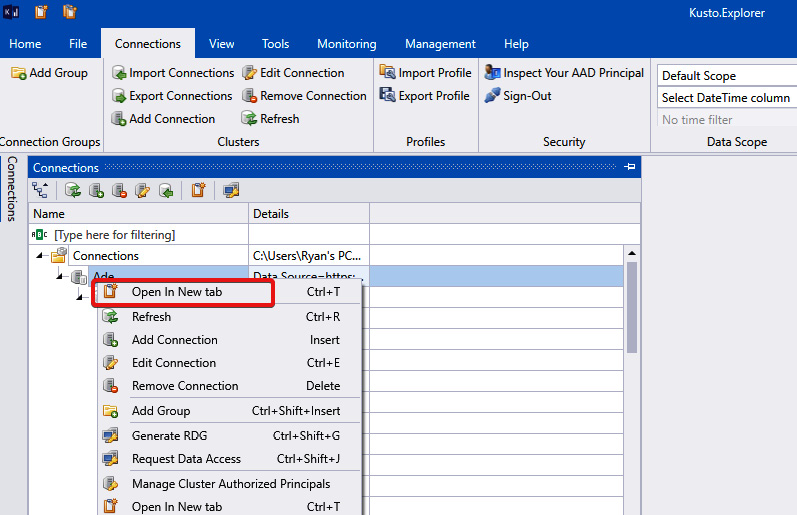
Figure 18.51 – New tab (Ctrl + T) used for creating a new query tab
Once you have clicked the new tab, you should be able to see a new tab created, as shown in the following screenshot:
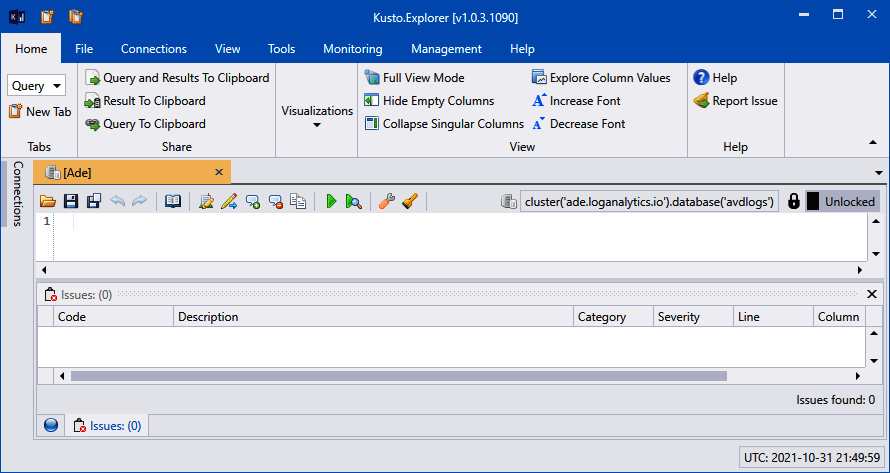
Figure 18.52 – New tab
A straightforward query with no filtering would be WVDErrors—this will collect any recorded errors within the WVDErrors table and display them within the output panel, as shown in the following screenshot:
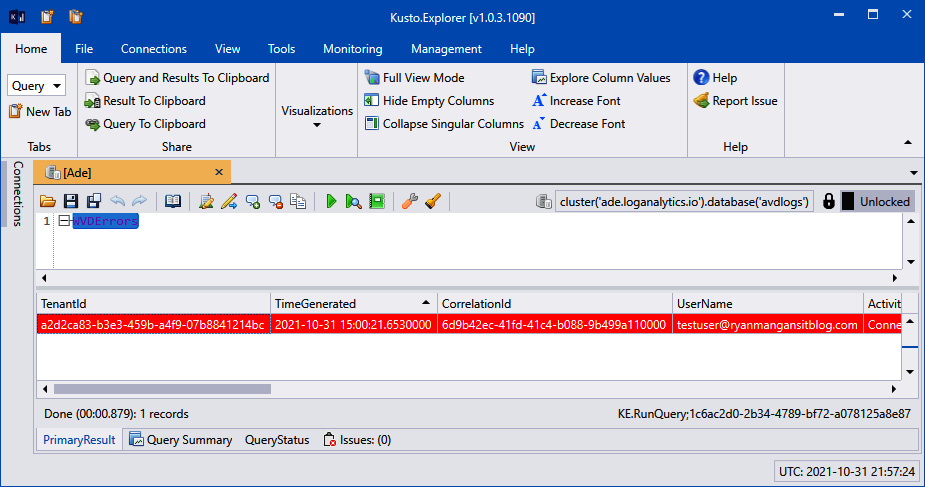
Figure 18.53 – Output of running the WVDErrors basic query within Kusto Explorer
You can then add a filter by using the where Boolean expression to pull a specific time or time range, which may be helpful when reviewing the logs for a specific issue.
The following query shows the usage of where:
WVDErrors
| where TimeGenerated > (datetime(2021-10-31T20:02:18.0000000Z) - 24h)
Here's the output:
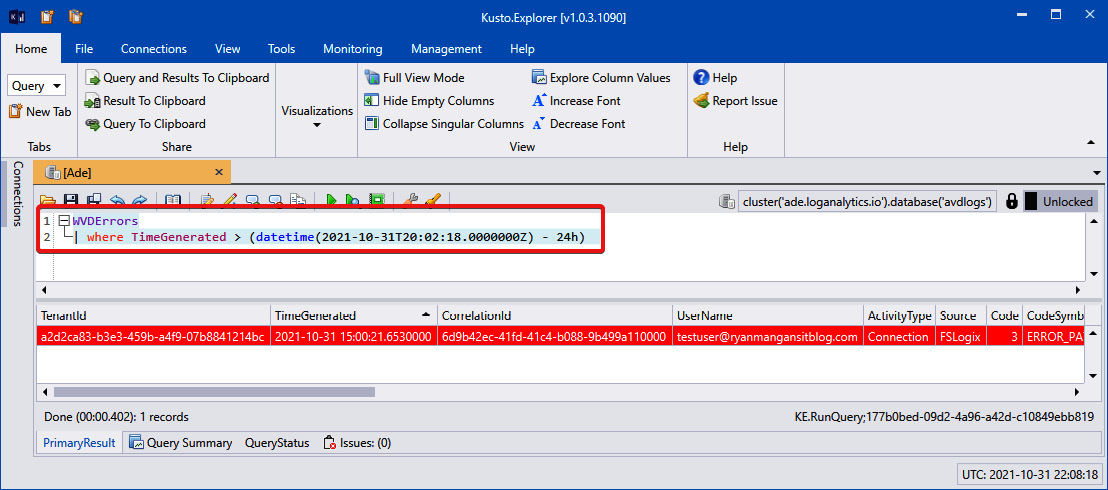
Figure 18.54 – where Boolean expression for the WVDErrors table
In this example, I wanted to show you where to specify specific columns using the project operator. The project operator allows you to pick out specific columns you require.
I used the WVDConnections table this time and then selected a few of the columns to provide an easy-to-read output. Here's an example:
WVDConnections
| where TimeGenerated > (datetime(2021-10-31T20:18:18.0000000Z) - 24h)
| project UserName, State, SessionHostName, TimeGenerated, ConnectionType
The following screenshot shows the usage of Kusto Explorer, using the preceding query, which uses the project operator:
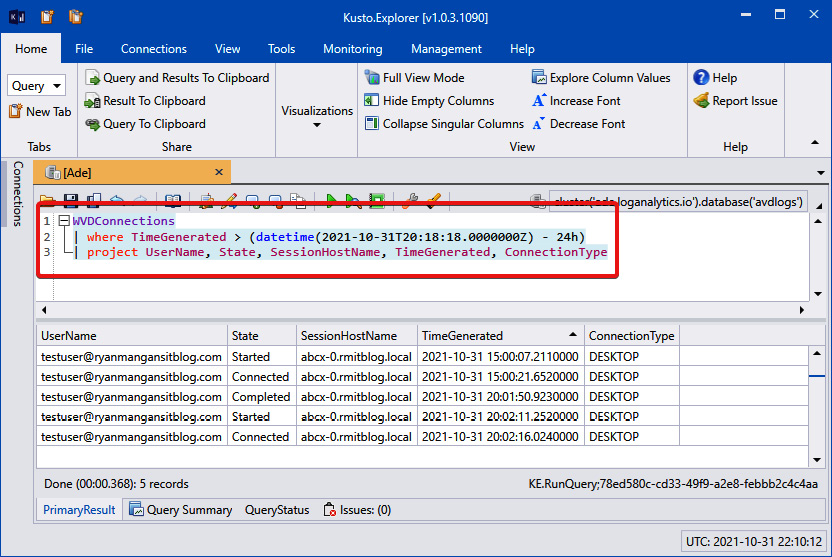
Figure 18.55 – WVDConnections query using project operator to select a few columns
In this final example, I wanted to show you how to filter using CodeSymbolic, which allows you to filter on a specific message. In this example, I have shut the session host down without logging a user off. I wanted to find out which users did not successfully log off before host shutdown. To do this, I used the following Kusto query:
| where CodeSymbolic == "ConnectionFailedReverseUngracefulClose"
The following screenshot shows the results of the preceding query:
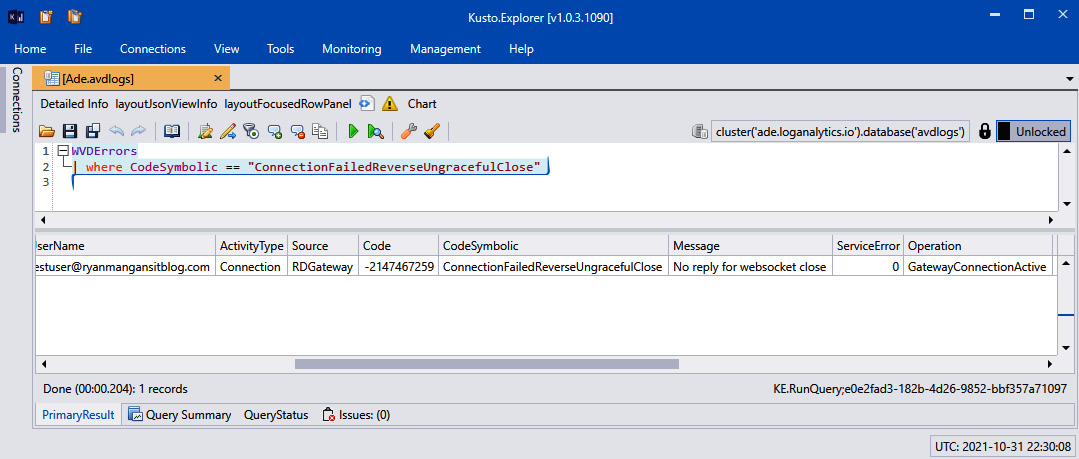
Figure 18.56 – Use of CodeSymbolic filtering
In this section, we looked at querying a Log Analytics workspace using Kusto Explorer. We also looked at a couple of examples to help you get started with querying your own AVD environment.
In the next section, we will take a look at using Azure Advisor for AVD.
Using Azure Advisor for AVD
Azure Advisor can be used to help resolve common issues, and it also provides recommendations. Azure Advisor's recommendations include resource reliability, security, operational excellence, performance, and cost.
To get started with Azure Advisor, simply enter advisor into the Azure search bar and select the service that appears, as illustrated in the following screenshot:
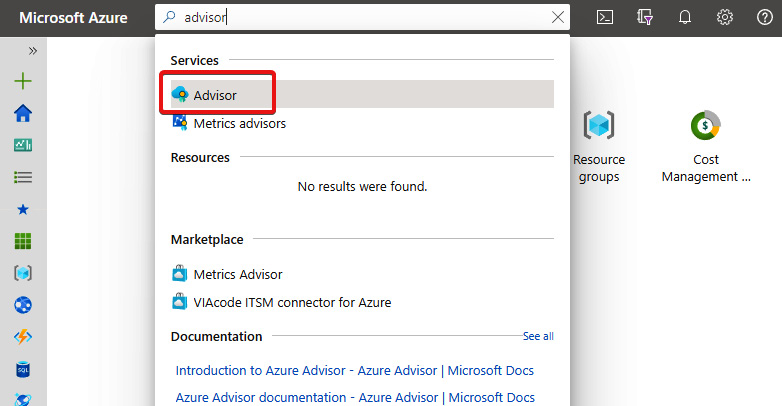
Figure 18.57 – Advisor service within the Azure portal search bar
You will then be presented with several advisories within five categories, as follows:
- Cost
- Security
- Reliability
- Operation excellence
- Performance
The following screenshot shows the Azure Advisor Overview page:
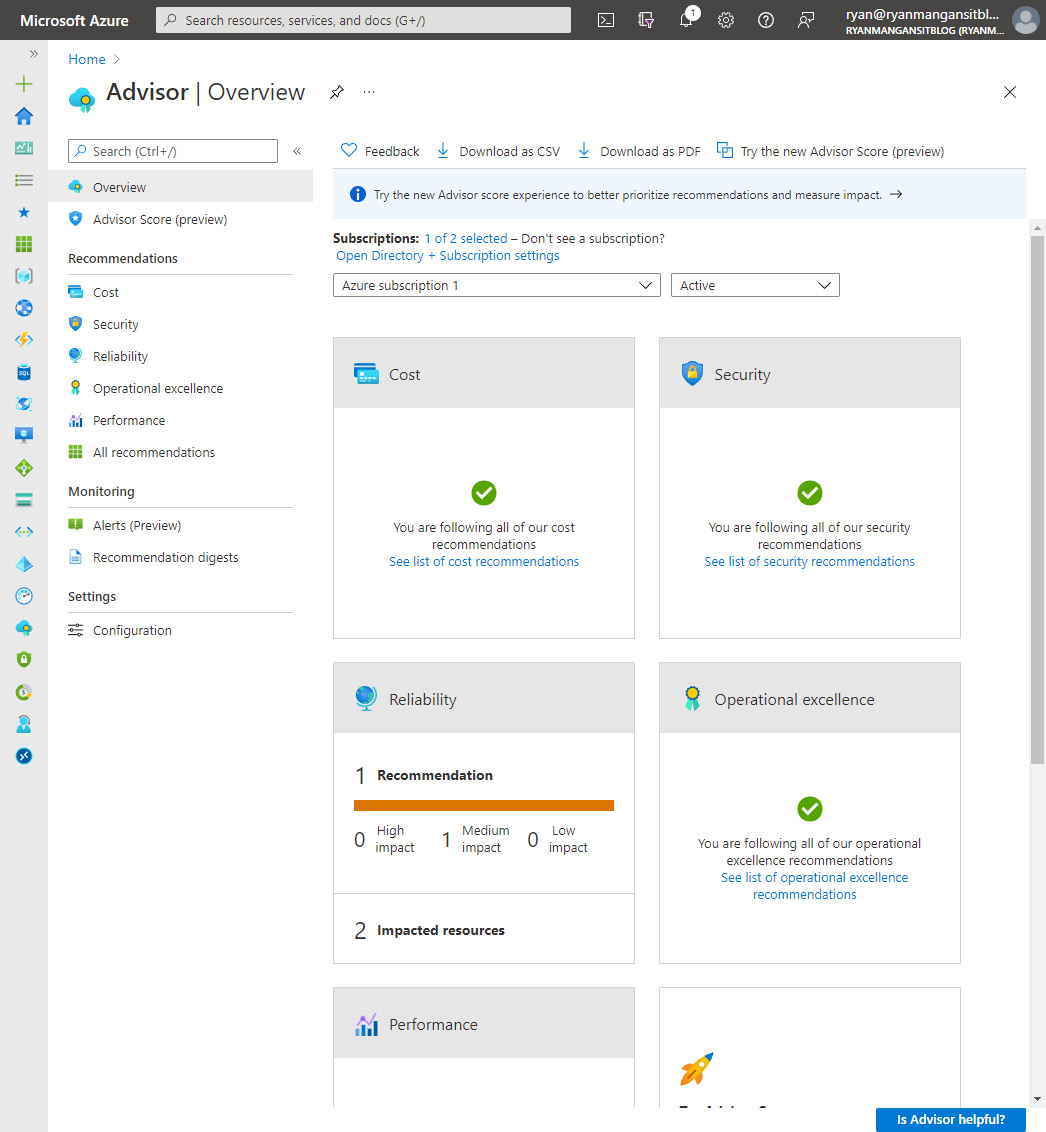
Figure 18.58 – Five-recommendation category overview page
Use the recommendations to enhance your configuration and relatability and reduce the cost.
We looked at Azure Advisor in this section and briefly looked at the value it can bring to your AVD environment.
Summary
This chapter looked at setting up and configuring Azure Monitor for AVD and using the AVD Insights workspace. We then moved on to setting up custom alerts using alert rules, which will notify IT administrators of a specific error or issue. We then looked at KQL and a few examples of querying a Log Analytics workspace. We then finished off the chapter, briefly looking at Azure Advisor for AVD.
Questions
Here are a few questions to test your understanding of this chapter:
- How can a user limit the ingestion of data to Log Analytics?
- What is Kusto?
- What does the EventID value 26 commonly refer to when reviewing FSLogix profile logs?
- What is the name of the feature used for viewing metrics and troubleshooting issues with AVD?
Answers
- Configure the Daily cap setting found under the usage and estimated costs page within the Log Analytics workspace
- A read-only language used to query datasets
- The failure to load an FSLogix profile
- AVD Insights