
Chapter 20
Presenting Your Design
Although Autodesk® Revit® Architecture software is most often used to create parametric content for documentation, it is often necessary to show designs to clients and other project stakeholders to make critical decisions. Revit has tools that you can use to embellish views or create new graphics to help present the design.
In this chapter, you’ll learn to:
- Understand color fill legends
- Use 3D model views in your presentation
- Work with viewport types
- Create “exploded” axonometric views
Understanding Color Fill Legends
There are many times in the design process when you will need to go beyond documentation for construction and portray spaces in a building in a different way. For example, you may need to communicate design intent, departmental adjacencies and allocations, or room finishes. Because Revit software has these functions, you can use its parametric capabilities to do more than just generate annotation—you can graphically show all kinds of model parameters.
The tool for creating this kind of view is called the Color Fill Legend. You can use this tool to color areas and rooms in plans, sections, and elevations. It allows you to assign different colors to just about any of the room or area properties within a view. Here are just a few examples of the types of views you can create:
- Floor plans showing departments.
- Floor plans showing spaces based on area value. An example might be rooms smaller than 500 square feet (50 sq m) as one color, rooms that are between 500 and 1,000 square feet (50 sq m to 100 sq m) as another color, and rooms bigger than 1,000 square feet (100 sq m) as a third color.
- Building sections showing different departments in different colors as in a stacking diagram.
- Plans, sections, or elevations portraying room finish types.
There is an almost endless list of the types of color fills you can create to help communicate a wide variety of project-specific details. The Color Fill Legend tool is located on the Color Fill panel of the Annotate tab (Figure 20.1).

Figure 20.1 The Color Fill Legend tool
To better demonstrate some of the uses of the Color Fill Legend tool, let’s make a simple color fill plan showing room types.
Making a Color Fill Legend for Rooms
In many projects, it becomes necessary to display plans with some additional information about the spaces. Typically during the design phases, clients need to see how different departments are located adjacent to one another. Even in a simple residential design, it can be helpful to see how public spaces such as kitchens and living areas are located relative to the more private spaces of bedrooms and bathrooms.
In the sample building project used in Chapter 17, “Documenting Your Design,” you may want to visually show the various space types in the floor plans. You want to graphically demonstrate which spaces have been assigned to various departments defined in the building’s program of requirements. To get started, download and open the c20-Sample-Building-Start.rvt or c20-Sample-Metric.rvt model from the book’s web page, www.sybex.com/go/masteringrevitarch2016. You will begin by creating a new type of floor plan that will help organize the Project Browser and automatically assign an appropriate view template.
To get started, follow these steps:
- Switch to the View tab in the ribbon, locate the Create panel, and then choose Plan Views ➢ Floor Plans. In the New Floor Plan dialog box, click the Edit Type button to open the Type Properties dialog box for the Floor Plan type.
- Click the Duplicate button and then name the new view type Color Fill.
- Click the button in the parameter field named View Template Applied To New Views. In the Apply View Template dialog box, select Color Fill Plans and then click OK to close the Type Properties dialog box.
- Using the Ctrl key, select both Level 1 and Level 2 in the New Floor Plan dialog box, and then click OK.
- Return to the Project Browser and you will see a new heading called Floor Plans (Color Fill). Change the names of the new floor plans to Level 1 - Dept - Color and Level 2 - Dept - Color.

-
Activate each of the new color fill plans and use the Tag All Not Tagged tool to add room tags to each plan.
For more information on tagging, see Chapter 18, “Annotating Your Design.”
-
Open the Level 1 – Dept - Color floor plan and click the Color Fill Legend button in the Color Fill panel of the Annotate tab. This will activate the Color Fill Legend tool and ask you to place a legend somewhere in the active view. Anywhere for now is fine—just place it to one side of the plan or the other.
Once the legend is placed, you can then define and customize its characteristics.
-
After the legend is placed, you’ll be presented with a dialog box similar to the one in Figure 20.2. This dialog box will prompt you to choose from a list of space types available in the current view and color schemes that have already been established within the model. From the Space Type drop-down list, select Rooms, and from the Color Scheme drop-down list, choose Name and click OK.
The color scheme will automatically generate a legend based on your room names and color the rooms on the plan.
If you already created a color scheme that you wanted to use in this view, it would be a simple matter of selecting it from this list and clicking OK, and the legend and view would be complete. The default project template contains a few simple color schemes from which you can choose when you place your first legend. You started with a basic one that automatically assigns a color for each unique room name in the project; however, this type of presentation is not usually that useful.
In the subsequent steps of the exercise, you will create different color schemes to further explore more complex methods of presentation.
-
After the legend is placed, you can then alter its properties or choose a different color scheme. To modify a legend, select the legend, and in the Modify | Color Fill Legends context menu, click the Edit Scheme button.
This opens the aptly named Edit Color Scheme dialog box (Figure 20.3). This dialog box allows you add, rename, or delete color schemes on the left side and define the graphic properties and attributes of these schemes on the right.
A drop-down list labeled Color at the top of the Scheme Definition area appears. This is the property by which the color scheme is being defined. It is currently assigned to color the plan according to room name. Each unique room name in the project is automatically generating its own color for the legend.
-
From the list of schemes at the left, choose Department.
The Color drop-down list now indicates the Department parameter, but there are no values defined in the list to the right. This is because text has not been added to the Department parameter for any of the room elements in the project.
Any parameter available to be used in a color fill legend needs to have values in its properties. You can either enter the value in the Properties palette by selecting the item and finding that property or by predefining values in the color scheme. In the following steps, you will predefine values for the departments and then assign them to the rooms later.
- Now let’s predefine some values. At the left side of the table under Scheme Definition, click the green plus sign to add values to the color scheme for Department. Create four new values as follows:
- MANAGEMENT
- OPERATIONS
- PRODUCTION
-
SALES
For now, you can use the automatic color and pattern assignments.
-
Click OK to close the dialog box.
You will notice in the floor plan that the legend now shows the title Department Legend and it displays No Colors Defined (Figure 20.4). Even though you defined some Department values, they will not show on the legend until you assign values to the rooms placed in the project.
-
Back in the floor plan, select the Manager room on the lower left of the plan and look in the Properties palette. Find the Department property and click in the value field to access a drop-down list (Figure 20.5).
The values available in the list are the values you added to the color scheme in step 5.
-
Assign the two rooms at the left side of the plan to the MANAGEMENT department, assign the LOUNGE space to the SALES department, and assign the SUPPORT space to the OPERATIONS department.
As you make these assignments, the color fill legend will update and the space will fill with the matching color.
-
Activate the Level 2 - Dept - Color floor plan and repeat steps 7 through 14 to assign some department values.
Because you already created a color scheme defined by department value, you don’t need to repeat steps 9 and 10.

Figure 20.2 Choose Space Type and Color Scheme after you place the legend in a view.

Figure 20.3 The Edit Color Scheme dialog box

Figure 20.4 Department legend with no defined color scheme

Figure 20.5 Assign values to room properties based on data assigned to a color scheme.
 Customizing a Color Fill Legend
Although the software automatically assigns colors to each value in a color scheme definition, you’ll likely want to change the colors or the fill patterns to suit your presentation needs. In this section you will customize the color scheme and the legend created in the previous exercises. Because many firms typically have standards for presentation color schemes, it’s a good idea to add your customized schemes to your office template.
In the following exercise you will create a copy of the department-based color scheme to use black line patterns instead of color fills. Download and open the file c20-Sample-Building2-Start.rvt or c20-Sample-Metric2-Start.rvt from the book’s web page. Then follow these steps:

- Return to the Level 1 – Dept - Color floor plan you used for the exercise in the previous section. In the Project Browser, right-click Level 1 - Dept - Color and choose Duplicate With Detailing from the context menu. Rename the duplicated view Level 1 - Dept - Black. Repeat this process for the Level 2 - Dept - Color plan.
- Activate the Level 1 - Dept - Black floor plan, select the legend located to the right of the plan, and click Edit Scheme in the ribbon to open the Edit Color Scheme dialog box.
- Select Department from the list of schemes on the left side and click the Duplicate icon at the bottom of the list. Name the duplicate scheme Department (Black).
-
You can change any of the assigned colors by selecting any of the buttons in the Color column. Doing so opens the Color dialog box (Figure 20.6) and allows you to select colors based on RGB values or PANTONE colors. Change the colors for each of the departments to black (R:0, G:0, B:0) and then click OK.
After you have defined the colors, take note of a couple of other features in the Edit Color Scheme dialog box, shown previously in Figure 20.3. The first is the Options area at the bottom of the dialog box, which contains a single check box that allows you to pull values from linked projects. If you are working on a large building that is split into multiple files, this is a good way to tie all that information together into a single graphic presentation.
-
The other option you have is the ability to exclude various scheme definition values for a color scheme. Notice the Visible column next to the Value column in the scheme definition, as shown in Figure 20.7.
Uncheck the box in the Visible column next to the value for OPERATIONS.
This setting will exclude the selected value wherever this color scheme is applied to a view. In this example, we might assume that the client does not need to see spaces that belong to the OPERATIONS department in color—just the remaining departmental spaces.
- Click each of the fields under the Fill Pattern column to change the fill pattern to a variety of line-based patterns, as shown in Figure 20.8.
- Click OK and you’ll notice that the color fills have dynamically changed to reflect the modifications you made in your color scheme properties, as shown in Figure 20.9.
-
Open the Level 2 - Dept - Black floor plan. In the Properties palette, locate the Color Scheme parameter and click the button in the value field that is currently assigned to Department. In the Edit Color Scheme dialog box, choose the Department (Black) color scheme and click OK.
The pattern fills are automatically placed according to the department assignments. Also notice that spaces assigned to the OPERATIONS department are not colored, nor does the department name appear in the legend because the Visible setting was turned off in step 4.

Figure 20.6 Click the button in the Color column to select a different color.

Figure 20.7 Use the Visible option to exclude values from the legend.

Figure 20.8 The pattern for each value can be customized.

Figure 20.9 The floor plan after scheme colors and patterns are altered
Modifying Other Settings
By now, you’ve created a color fill legend and placed it within a view, and you’ve seen a number of the settings and properties of the legend. Those settings reflect how the color fill legend will look and react to the plan or view in which it’s placed, but there are other settings you can modify as well. The legend key itself has several properties that control fonts and swatch sizes. Select the legend and click the Edit Type button in the Properties palette to explore some of the other properties you can modify.
Figure 20.10 shows the type properties for a color fill legend. In this dialog box, you can change the font size and type as well as the size of the color swatches that appear in the legend.

Figure 20.10 Edit the visual and functional characteristics of a color fill legend in the Type Properties dialog box.
An important type property for color fill legends is Values Displayed. The two options for this property are By View and All, and the default setting for color fill legends is By View. You might have noticed that none of the spaces on Level 1 are assigned to the PRODUCTION department, and so that value does not appear in the legend placed on Level 1.
Try creating a duplicate color legend type named All Values and change the Values Displayed property to All. This legend type shows all department names, regardless of the department assignments on each level. This setting does not override the Visible options you specify in the color scheme settings; therefore, the OPERATIONS department will still not display when you use the Department (Black) color scheme.
In summary, you can combine any color scheme with any color legend type—the two are not dependent on each other.
Using Numerical Ranges for Color Schemes
In the previous exercises, you explored how to use color schemes to create presentation material based on specific object properties. You can also create color schemes that display ranges of numerical values. In the following exercise, you will continue with the c20-Sample-Building2-Start.rvt orc20-Sample-Metric2-Start.rvt file. With the Room color fill legend defined, you have seen an example of how to create color fill legends. A variety of other legend types are available, and some of these types allow you to define your own parameters when creating the legend itself. Let’s step through this process again using a different legend type so you can see how you can define your own parameters in a color fill legend.
The next color scheme you will create is based on areas. Whereas the Department color scheme was defined by rooms that were already placed on plans, the area scheme is defined by numerical ranges you will need to define within the color scheme properties. Follow these steps:
- In the Project Browser, right-click the Level 1 - Dept - Black floor plan and choose Duplicate With Detailing from the context menu. Rename the duplicated plan Level 1 – Area Range. Select the color fill legend in the view, and click Edit Scheme in the contextual tab of the ribbon.
- In the Edit Color Scheme dialog box, create a copy of the Name color scheme, using the Duplicate icon at the bottom of the list. Name the new scheme Area Range. Also change the Title field to Area Range.
-
From the Color drop-down list, choose Area. Click OK if you are presented with a warning about preserving colors.
You’ll notice that all the room names and colors will disappear; they are replaced with values representing each unique room area.
This type of schedule—like a schedule of room names—is probably not that useful as a presentation method. Instead, let’s create a series of colored area ranges to easily identify which spaces are within specific ranges.
- Next to the Color drop-down list in the Scheme Definition field, select the By Range option. The static area values in the list below are now split into two columns labeled At Least and Less Than (Figure 20.11).
- Select one of the rows so the green plus button is active. Click that button two times so that you have four rows in the list of value ranges.
-
Starting from the bottom row, change the values to 800, 500, and 200, as shown in Figure 20.12.
You can also try changing some of the colors assigned to each of the value ranges to make the presentation more meaningful or simply easier to read.
-
Click OK to update the color fill scheme and view the results in the plan (Figure 20.13).
The rooms now have colors based on their sizes rather than their names.
- In the Project Browser, right-click Level 2 - Dept - Black and choose Duplicate With Detailing from the context menu. Rename the duplicated view Level 2 - Area Range.
- In the Level 2 - Area Range floor plan, select the existing color fill legend and click Edit Scheme from the contextual tab in the ribbon. In the Edit Color Scheme dialog box, select Area Range and then click OK.

Figure 20.11 Select By Range to change the scheme definition.

Figure 20.12 Modifying the values in the Scheme Definition field

Figure 20.13 The finished floor plan with color fills by area range
The rooms on Level 2 are now also represented with the same color range as we assigned for Level 1.
Presenting with 3D Views
In addition to using 2D views such as plans, sections, and elevations to convey your design intent, you can present the 3D model in a variety of ways. In Chapter 11, “Visualization,” we discussed the methods for creating analytic and photorealistic visualizations; the following sections will help you to establish a new repertoire of presentation techniques for design and construction documents.
Orienting to Other Views
A quick and easy way to create more useful 3D views is by utilizing the Orient To View command. This command, which is somewhat hidden within the ViewCube,® allows you to create a 3D view that mimics the settings of a 2D view.
In the following exercise, you will continue to use the c20-Sample-Building2-Start.rvt or c20-Sample-Metric-Start.rvt file. You will first adjust the view range settings for the floor plans and then create a 3D view for each level. Finally, you will assemble the views on a sheet to complete the presentation.
- Select Level 1 from the Project Browser and go to the Properties palette to examine the view properties. Click the Edit button in the View Range property.
-
In the View Range dialog box (Figure 20.14), change the Top value under Primary Range to Level Above and set the corresponding offset value to –1'-8" (–0.5 m). Repeat this step for Level 2.
Although you are changing the top of the view range of the floor plans, you will not see any difference in their graphic display.
- Right-click the Default 3D view {3D} in the Project Browser and create two duplicates. Rename the duplicate views Box-Level 1 and Box-Level 2.
-
Activate the view Box-Level 1 and right-click the ViewCube. Select Orient To View ➢ Floor Plans ➢ Floor Plan: Level 1, as shown in Figure 20.15.
The view will be set to a plan orientation, but more important, a section box has been enabled that matches the extents of the Level 1 plan view. Try orbiting the view to see the results (Figure 20.16).
- Right-click the ViewCube and select Orient To A Direction ➢ Southwest Isometric.
- Repeat steps 4 and 5 for the Box-Level 2 view.
- Create a new sheet using the C or A2 size title block, and drag the Box-Level 1 and Box-Level 2 views onto the sheet.

Figure 20.14 Adjust the Top values for the plan’s view range.

Figure 20.15 Orient a 3D view to any other 2D view.
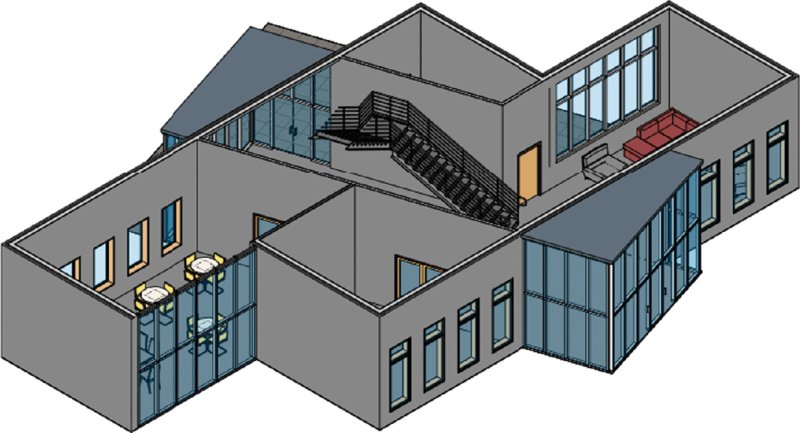
Figure 20.16 A 3D view after being oriented to a plan view
Place the Box-Level 2 view directly above the Box-Level 1 view and you’ll notice that the views will align vertically. You can align model views of various types on sheets as long as they are the same scale. This does not work for drafting views or perspective views.
You can continue to experiment with the view settings of these 3D views on the sheet. Even though the section boxes won’t print by default, you may want to hide them anyway. You can’t uncheck the Section Box property because the view would no longer be three-dimensionally cropped. To hide the section box, select the viewport and then click Activate View in the contextual tab in the ribbon. Select the section box, and from the contextual tab in the ribbon, click Hide In View (the light bulb icon) ➢ Hide Elements. Right-click and choose Deactivate View from the context menu, and then repeat this process for the other 3D view.
Annotating 3D Views
Once you add a 3D view to your sheets, you’re likely want to annotate it. To add annotations to your 3D view, you first need to lock it before adding text and tags as you would in a 2D view. This functionality is quite simple to implement.
In any orthographic 3D view, you will find the Lock/Unlock View button in the view shortcut bar, as shown in Figure 20.17. Once you lock the view, you can begin to add tags, text, and dimensions, but you cannot change the orientation of the view unless it is unlocked.

Figure 20.17 The 3D view can be locked from the view control bar.
In the example shown in Figure 20.18, a section box was first applied to a 3D view and then annotated.

Figure 20.18 Annotation can be applied to a 3D view with locked orientation.
Once you have added annotation to a view, you may need to rotate the view. Return to the locked view tool and click Unlock View. You are now free to orbit the 3D view; notice how your annotations orbit with your model. The annotations will appear a bit skewed as a result of this rotation. If you want to return the view to the originally saved orientation, click Restore Orientation And Lock View. The annotations will reappear in their original locations.
Editing Viewport Types
In the previous exercises, you might have noticed that the 3D views placed on the sheet displayed the default view title; however, we don’t need the titles every time we place a view on a sheet. Options and properties related to the display of views on sheets are stored as viewport types. Although the name conjures up memories of model space and paper space in Autodesk® AutoCAD® software, it is actually quite different in Revit. The viewport does not determine the scale or anything else about the view itself; rather, it simply sets the parameters for how a view sits on a sheet.
Let’s examine how to customize viewport types by completing an exercise that continues from the previous example of placing 3D views on a sheet:
-
Using the sheet with the two stacked 3D plan views, select one of the views and click Edit Type in the Properties palette.
The Type Properties dialog box appears (Figure 20.19).
There are only a few properties in a viewport type, most of which are related to the extension line in the title. You can change the View Title family selection in the Family drop-down list. However, in this exercise you will not need a view title. We’re going to create a new viewport type that does not use a title.
- Click the Duplicate button to create a new viewport type named No Title.
- Click the Show Title drop-down list and select No.
-
Next, for the Show Extension Line setting, uncheck the box.
Before clicking OK to make the new type, let’s verify an important property in this dialog box. The Show Title property is set to When Multiple Viewports, which will display the titles only when multiple views are placed on a sheet. The view title is not displayed if only one view is placed on a sheet, as in an overall floor plan.
- Click OK to close the Type Properties dialog box, and you’ll see that the viewport you had selected is already changed to the new type. Select the other viewport and switch it to No Title in the Type Selector.

Figure 20.19 The type properties of a viewport
When you have completed the exercise, you can also add some detail lines to the sheet to further embellish the descriptive presentation, as shown in Figure 20.20. Although you cannot snap to the geometry within the viewports, you can use the arrow keys to nudge the lines into alignment as required.

Figure 20.20 Customized viewports placed on a sheet
Creating “Exploded” Axonometric Views
 A very useful tool to help you present your designs in a unique way is the Displace Elements tool. This tool allows you to create an “exploded” axon—essentially allowing you to take the geometry of a 3D view and move it without impacting the model. In Figure 20.21, you can see the use of the Displace Elements tool on the left and the original model on the right. The displacement is view specific, so in all other views the model integrity remains.

Figure 20.21 Using the Displace Elements tool
In this exercise, you’re going to continue using the c20-Sample-Building2-Start.rvt or c20-Sample-Metric2-Start.rvt file to create a displaced element. The Displace Elements tool is found on the Modify tab, and it is active when you select an object in a 3D view. It is located on the View panel in the upper-right corner.
You’ll start this exercise by creating a new view:
- Take the Box-Level 1 view you created in the previous exercise and duplicate it. Rename the view Axon-Level 1.
-
With the new view established, you can change the orientation. Right-click the ViewCube, select Orient To A Direction, and select Southeast Isometric. Alternatively, you can select the corner of the ViewCube where the Front, Right, and Top sides connect.
Your starting view will look like Figure 20.22.
-
One thing that you’ll notice about this view is the section box. In other situations, the scope box would create a limit for what you could change, because anything outside the scope box would effectively disappear within the view. Because the changes you are making using the Displace Elements tool are only view specific and not actually manipulating model content, you can leave the scope box where it is.
So that it doesn’t interfere with the view, however, you can turn it off. Right-click the scope box and choose Hide In View ➢ Element from the context menu.
-
Now, you can begin displacing elements. When using this tool, elements will be grouped based on selection. So, if you were to pick multiple elements and then displace them, they would all move together, keeping a relative distance to one another.
To demonstrate this, select both of the walls on the right of the view (Figure 20.23).
- Select the Displace Elements tool from the View panel of the Modify tab. Both walls will remain highlighted now, but you’ll see a 3D control tool appear (Figure 20.24).
-
Grab the red control (the one that points to the lower right) and pull it away from the building. The walls should move in a plane parallel to their original position.
You’ll see the walls you selected visually unjoin from the building (Figure 20.25). If you were to move these walls without the use of this tool, you would receive error messages about rooms being unbound or elements being unjoined. None of that is happening because the changes you’re making are just view specific and not impacting the actual model.
-
For the next displacement, select the three walls on the backside of the building (Figure 20.26). Select the Displace Elements tool again, and drag these using the green arrow (the one pointing to the upper right).
Notice how the door moved without selecting it (instead the wall was selected) but the storefront system did not move. As you create these types of views, you’ll need to make sure you’re selecting all of the elements you want to relocate. If you don’t get it exactly right, however, don’t worry. With these displaced walls highlighted, some new tools are active in the Modify | Displaced Elements tab: Edit, Reset, and Path. The Reset tool will undo the displacement you have created and reset the walls to their original locations.

-
To complete this step, you need to use the Edit button. Select Edit and notice how the view has changed.
The elements within the displacement group are highlighted orange, and a new Edit Displacement Set panel has popped up similar to the Edit Groups panel.
-
In this view, choose Add from the Edit Displacement Set panel. Choose the storefront system that you didn’t select in step 7.
It will immediately move to its proper location within the wall and turn orange like the rest of the set (Figure 20.28). Click Finish from the panel to exit this view.

-
You’re going to make one more displacement: the wall to the right of the stairs. Select it, choose the Displace Elements tool, and move the wall away from the stairs just a bit (Figure 20.29).
-
With all the elements displaced for this view, we’re going to touch on one more tool. Highlight the first set of walls you displaced and select the Path tool from the Displacement Set panel. With this tool selected, click the lower portions of the walls you moved. It creates a dashed line or a “path” that the walls are pulled out upon. This will help to add visual clues to the view so you can see the origin point of specific elements. Do this for the other elements you’ve displaced (Figure 20.30).
In addition to moving building elements along their logical displacement plane, you can move them in any other direction if it increases the clarity of your 3D presentation. The path will be jogged for elements that are displaced out of plane.
- The final view with the paths and displaced elements will look like Figure 20.31.

Figure 20.22 Baseline view for the displaced elements

Figure 20.23 The first selection for displacement

Figure 20.24 Using the 3D control to move the displaced elements

Figure 20.25 The displaced walls

Figure 20.26 The second displacement

Figure 20.27 Add the storefront wall to the displacement set.

Figure 20.28 Displace the wall next to the stairs.

Figure 20.29 Using the Path tool to trace the displaced elements to their origin points

Figure 20.30 The finished view
As with any other view in Revit, this view is parametric as well. Changes you make to elements within the model will update elements within this view and to the paths too.
If you now open the Default 3D view, you’ll see that the integrity of the model has not changed—all the building’s elements are exactly where you would expect them. You can even begin to experiment with making modifications to the walls you have displaced—add a door or a window and you can see that updated within the displaced view. You can quickly begin to see how useful this type of visualization can be!
The Bottom Line
Understand color fill legends. Color fills are a great way to illustrate data that otherwise might appear only in a schedule, such as department assignment, designed areas, and room finishes.
Master It There are a variety of ways to graphically display information using color fills. It can initially take a bit of time to get things organized, but once you create them, the legends can easily be transferred between views and projects. Describe how to add a color fill legend, once created, to your project template.
Use 3D model views in your presentation. Revit provides a variety of ways to help you visualize your designs—both while designing and during presentation. Understanding where these features are located and how and when to use them can help expedite the presentation process, depending on the look and feel you want to create with your images.
Master It Describe the process for creating an exploded 3D view of each level within your project.
Work with viewport types. Viewport types are simple to manage, but they are powerful when applied to the views you place on sheets. You can customize the view titles for any use case, from design presentations to construction documents.
Master It Describe the process for adding a new viewport type to your project.
Create “exploded” axonometric views. The Displace Elements command is used to create exploded axonometric views that used to be drafted by hand or created manually in a separate model. Understand the best ways to use this tool to help visualize and communicate design ideas.
Master It Describe the process for creating a displaced view.