Jet Reports Express and Zetadocs Express are free versions of third-party applications recommended by Microsoft and compatible with standard versions of Microsoft Dynamics NAV. This chapter will explain what those applications are meant for, and how to install and configure them to work together with Microsoft Dynamics NAV 2013.
In this chapter we will cover the following topics:
- Downloading and installing Jet Reports Express
- How to configure and use Jet Reports Express
- Downloading and installing Zetadocs Express
- How to configure and use Zetadocs Express
Jet Reports Express for Microsoft Dynamics NAV is a business-reporting tool meant to let users create high-impact reports in a familiar environment, such as Microsoft Excel. With Jet Reports Express, you can use all Excel capabilities, such as formatting, slicers, charting, and pivot tables.
This is a very good and profitable tool for many users. So don't wait for your customers to ask for it; instead, plan to install it on every new Dynamics NAV project and give users the necessary training to use it.
Visit the Jet Reports website for updated information of this application. In the website, you will also find a few demo videos that show you how to start using it. Don't worry, they are short videos that focus only on the information you need. It's worth seeing them.
In this section we will explain the following:
- Where to download Jet Reports Express from
- How to install Jet Reports Express
- How to configure Jet Reports Express
- How to create a Jet Reports Express report
- How to analyze data with Jet Reports Express
- The use of Jet Reports Express to retrieve data
There are two components of Jet Reports Express to download, as follows:
- The installation files of Jet Reports Express
- A Microsoft Dynamics NAV 2013 FOB file
The installation files of Jet Reports Express can be downloaded from the following link:
http://jetexpress.jetreports.com/en/index.php
There is a 32-bit and a 64-bit installation file. You will be installing this application on the client computers that will be using Jet Reports Express. Choose the appropriate installation file for them; either one of the two files shown in the following screenshot:

The Microsoft Dynamics NAV 2013 FOB file can be downloaded from the following link:
http://expresssupport.jetreports.com/viewtopic.php?f=9&t=134
The name of this FOB file is Jet Reports Objects.fob.
Jet Reports Express has to be installed in Microsoft Dynamics NAV 2013 and also on every client computer that will be using Jet Reports.
Perform the following steps to install Jet Reports Express on client machines:
- Run
Jet Express Setup (32-bit).exeorJet Express Setup (64-bit).exe. - Complete an easy Next-Next-Next-Finish installation process.
This will install a Jet tab in Microsoft Office Excel as shown in the following screenshot:
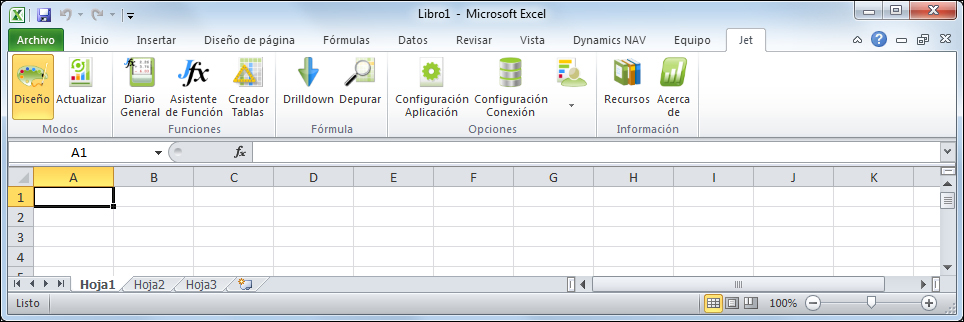
This installation has to be done on every single client machine using Jet Reports Express.
Perform the following steps to install Jet Reports Express on Dynamics NAV 2013:

The Jet Reports objects for Microsoft Dynamics NAV 2013 are the Codeunits shown in the previous screenshot.
The codeunit 14125500 Jet Data Source must be published as a web service to enable Jet Reports Express to operate. To publish this codeunit as a web service, complete the following steps:
- Open the Microsoft Dynamics NAV 2013 client.
- Navigate to Departments/Administration/IT Administration/General.
- Select Web Services.
- The Web Services page opens.
- Select New on the ribbon bar to publish a new web service.
- The New – Web Services page opens.
- Select Codeunit as Object Type.
- Select 14125500 as Object ID.
- Set Jet Data Source as Service Name.
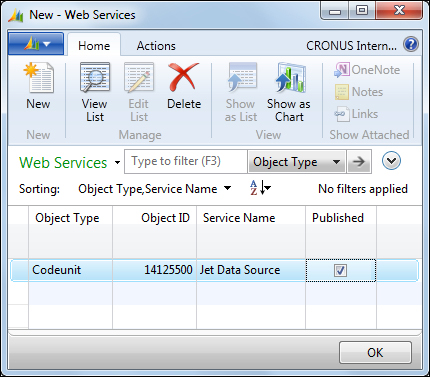
- Select Published as shown in the following screenshot:
Now it's time to configure Jet Reports Express on Microsoft Office Excel. This process will have to be done on every client machine where Jet Reports Express has been installed.
- Open Microsoft Office Excel.
- Select Data Source Settings from the Jet ribbon.
- Use the Data Source Version drop-down button and select Dynamics NAV 2013 and later.
- Select the Web Service tab.
- Enter the Server, SOAP Services Port, and Instance values.
- Select the company from which you want Jet Reports Express to retrieve your data.
- Select Jet_Data_Source as the Jet Codeunit value.
- Click on OK.
The configuration of Jet Reports Express is now complete.
The user can now access all the Microsoft Dynamics NAV 2013 data from the company selected while configuring Jet Report Express. All data? Not really! Jet Reports Express respects the roles and permissions assigned to users, so they will only see the data they are allowed to see.
Let's see an example of how it works and all the capabilities it has. In the Jet Report's web page, you will find a few examples related to financial and sales information. We will not reproduce those examples; we will build a warehouse report instead.
We want to build a report to determinate the ABC items in the company so that we can rearrange our location based on this information. We will use the Item Ledger Entry table to analyze the data.
To do so, open Microsoft Excel, click on the Jet tab, and then click on the Table Builder icon as shown in the following screenshot:
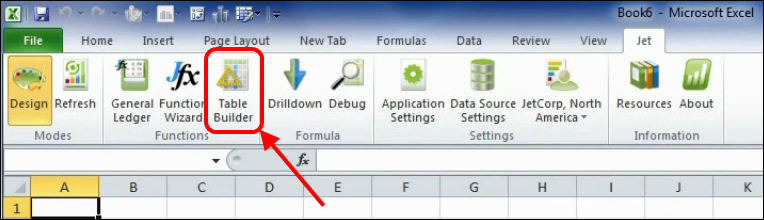
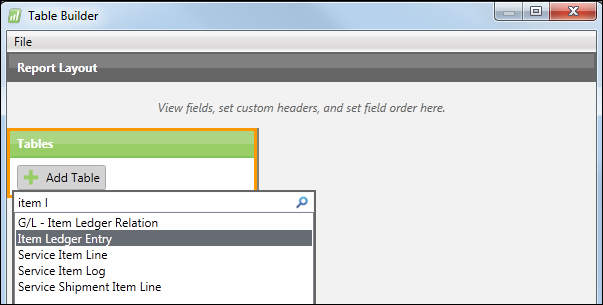
The Table Builder assistant opens. Click on the Add Table icon and a list of all available tables will appear. In the search area, type Item Ledger Entry. Once you find the table, select it by double-clicking on it.
The next step is to select which fields we want to populate. All fields are available, including flowfields, which can retrieve delimited data by introducing fixed or user-defined filters on any flowfilter.
In our example, we need to select the following fields: Item No., Item Category Code, Location Code, and Quantity. When selecting the table, you will see a list of all fields. You can scroll through the list or use the search area.

As you can see in the preceding screenshot, selected fields are shown at the top area of the screen. Fields are populated in the same order you have selected them, but you can also move any field position by selecting it and clicking on the left or right arrows that are placed just below the selected fields.
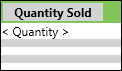
By default, the fields get the same name as defined in the Dynamics NAV table. You can select the field header and edit it if needed. In our example, we only need the sales item entries. We'll filter the information later on. We'll change the Quantity field header description to have a clear definition of what information we are getting. Edit the header and type Quantity Sold as shown in the following screenshot:
As you can imagine, the Item No. field does not have enough information to know what item we are talking about. The company may have hundreds or thousands of references, and it is impossible to know all their codes. A description of the item would be fantastic. In the Item Ledger Entry table you will find a field called Description, but it only gets filled if on a single entry the user has changed the description of the line. If the description hasn't changed, the Description field will be blank. So we need to use the Description field found on the Item Card instead.
Click on the Add Table icon and select the Item table. Find the Description field and mark it. Move it so that the description is shown after the Item No. field, like so:

We already have all the information we need, now it's time to add filters to delimit the data we get.
Select the Item Ledger Entry table again, and add two filters on the right pane of the screen. As we said before, we only need sales entries. Click on the Add Filter icon, select Entry Type on the Where field, and select Sale on the Equals field.
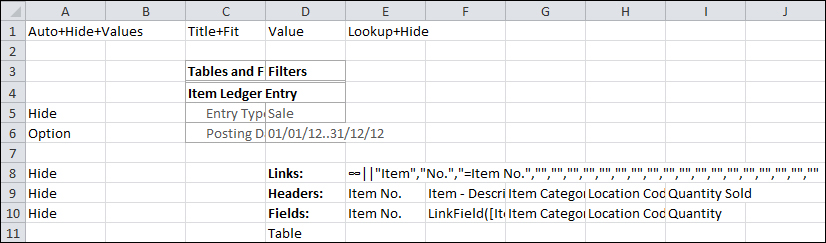
Our report is based on last year's movements, so we need to add a filter on the Posting Date field. Do it as it is shown in the following screenshot:

We've just finished the report definition. Click on the OK button to go back to the Excel sheet. A set of queries is generated inside Microsoft Excel that will return the report's information. If you are an end user, don't worry about what they mean; just let Jet Reports Express do the job for you. If you are a developer, you can edit this information to develop advanced reports, such as automatically sort the table by the value of a sum field. You can find all the information on the Jet Reports community web page at http://community.jetreports.com/.
Now click on Refresh. The Report Options window will open, so you can easily change the user-defined report options. At this moment, we would like to see the data for all of 2012, so we don't need to change the filter. Just click on the Run button as shown in the following screenshot:

The report now looks like the following screenshot:

All the information you need is now in your Excel sheet. Now it's time to use the Excel capabilities to analyze this data.
In the Item Ledger Entry table, quantities for the sales movements are negative; they mean less stock in our warehouse.
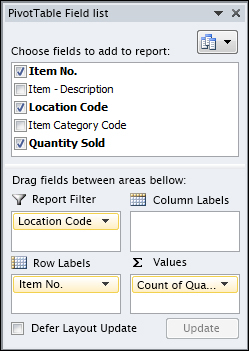
Select any of the cells of the table and insert a pivot chart. A window will open with a few options. The table will already be selected, and we would want Excel to create a new sheet for our chart, so just click on the OK button. Drag the Item No. field into the Row Labels area, the Quantity Sold field to the Values area, and the Location Code field to the Report Filter area. This is depicted in the following screenshot:
The pivot table and the pivot chart are created on the fly in the Excel sheet. You can now filter either on the Location Code values or on the Item No. values to analyze the data. Sort the pivot table by the Quantity Sold column and you will easily see the most sold items in your company, as shown in the following screenshot:

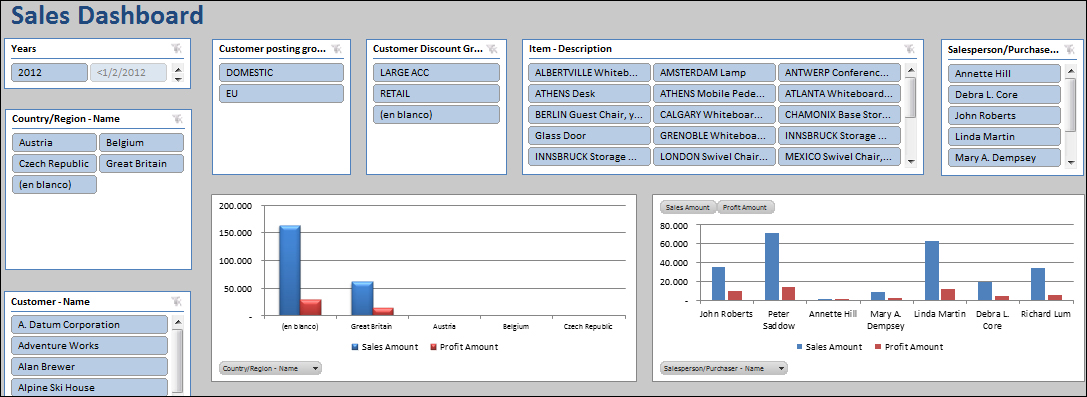
You will find more advanced examples on the download section of the Jet Reports Express web page. For instance, in the following screenshot, you can see the 3 NAV SALES - Sales Dashboard.xls report.
Besides data analysis, Jet Reports Express can also be used to retrieve data. For example, you can retrieve all your customers' shipping addresses, or the item's cross references. This information can also be retrieved using the data migration tools explained in Chapter 6, Migrating Data.
But the data migration tools have a few limitations that Jet Reports Express overcomes.
- Data filtering: Data migration tools always retrieve all the records of a given table. There is no way to filter data when exporting it. For big tables, this may be an issue. However, Jet Reports Express allows multiple filters.
- Table joining: Data migration tools only retrieve information from one table at a time. There is no way to obtain joint or grouped data. For instance, if you want to retrieve information from the cross reference tables, you will be able to export the Item No. field but not the Item Description field.
To be fair with data migration tools, we also have to say that it allows users to import and update date, while Jet Reports Express can only be used to read. It has no writing capabilities.
Besides the Express edition, Jet Reports also has an Essentials edition and an Enterprise edition that give users more tools to analyze and share their data.