
Chapter 6
Drawing on the Canvas
In This Chapter
![]() Adding a canvas to your HTML page
Adding a canvas to your HTML page
![]() Drawing paths and geometric shapes
Drawing paths and geometric shapes
![]() Working with images
Working with images
![]() Pixel manipulation
Pixel manipulation
The canvas element is one of the most interesting new developments in HTML5. Although the <canvas> tag is an HTML tag, it really isn't interesting without JavaScript programming. The <canvas> tag provides a graphics context, which is an area of the page that can be drawn upon with JavaScript commands.
The <canvas> tag supplies a rich toolkit of drawing operations that may very well revolutionize the web. Innovations in the <canvas> tag along with advances in the speed of JavaScript engines may very well lead to new uses of the web. A number of developers have developed games with the <canvas> tag and JavaScript that would have required Flash or Java just a few years ago. Also, the flexibility of <canvas> could lead to entirely new visual tools and widgets that are not based on HTML, which could have profound implications on usability and user interfaces.
The <canvas> tag is supported by all current browsers.
Although many of the features of the <canvas> element (shadows, transformations, and images) are available through other parts of the HTML5 universe, the implementation of the various <canvas> elements is identical on all browsers that support the platform. This universal support makes the canvas ideal for animation applications.
Canvas Basics
Begin with a simple demonstration of the <canvas> tag. The canvas variation of “Hello World” creates a simple canvas and draws a rectangle on it.
Setting up the canvas
To use the <canvas> tag, build a web page with a <canvas> element in it. Typically you'll provide width, height, and id parameters:
<canvas id = "drawing"
width = "200"
height = "200">
<p>Your browser does not support the canvas tag...</p>
</canvas>
Inside the <canvas> tag, you can put any HTML code you wish. This code will appear if the browser does not support the <canvas> tag. Typically, you'll just put some sort of message letting the user know what she's missing.
Nothing interesting happens in a canvas without some kind of JavaScript code. Often you'll use a function to draw on the screen. Here's my draw() function, which is called by the body onload event:
function draw(){
//from basicCanvas.html
var canvas = document.getElementById("surface");
if (canvas.getContext){
var con = canvas.getContext('2d'),
con.fillStyle = “rgb(255,255,0)”;
con.fillRect(40,140,150,50);
} // end if
} // end draw
Figure 6-1 illustrates the page created with this code:
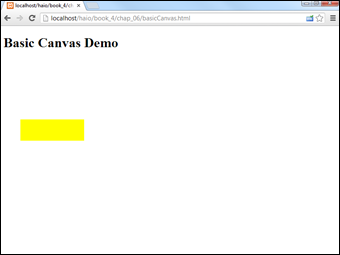
Figure 6-1: This rectangle was created through code.
The draw() function illustrates all of the main ideas of working with the canvas tag. Here's how you build a basic drawing:
- Create a variable reference to the canvas: Use the standard getElementById() mechanism to create a variable referring to the canvas.
- Extract the graphics context from the canvas: Canvas elements have a graphics context, which is a special object that encapsulates all the drawing methods the canvas can perform. Most browsers support a 2D context now, but 3D contexts are beginning to appear as well.
- Set the context's fillStyle: The fillStyle indicates how you will color filled-in areas (like rectangles). The basic approach is to supply a CSS color value. See the section “Fill and Stroke Styles” for information on how to fill with colors, gradients, or image patterns.
- Create a filled-in rectangle: The graphics context has a few built-in shapes. The rectangle shape is pretty easy to build. It expects four parameters: x, y, width, and height. The x and y parameters indicate the position of the rectangle's top left corner, and the width and height parameters indicate the size of the rectangle. All measurements are in pixels. See the “Drawing Essential Shapes” section for more information on the various types of primitive shapes you can build.
How <canvas> works
I go into detail throughout this chapter, but it's helpful to begin with an overview of the way <canvas> works and what it does in general.
There are really only two main drawing functions in <canvas>: fill and stroke. Most drawing is done as a two-step process. First you define some sort of shape (a rectangle, an arc, a series of lines) and then you tell the canvas to draw with a stroke or a fill. A stroke simply draws a line, so if you stroke a rectangle, you'll see the outline of the rectangle, but it will not be filled in. The fill draws the filled-in shape, so a filled rectangle will show the interior of the rectangle.
You can specify a fillStyle, which specifies the color and pattern of subsequent fill commands. You can also indicate a strokeStyle, which determines how subsequent stroke commands will be drawn.
More complex shapes are drawn with a mechanism called paths, which are a series of line-drawing instructions. You can use paths to create strokes or filled-in shapes.
You can draw images onto a canvas. You can draw an entire image, or part of an image onto the canvas.
You can also draw text directly onto the canvas in various fonts and colors. You can add shadow effects to your text elements, or even images.
The canvas object gives you access to the underlying data of an image. This allows you to perform any kind of transformation you wish on image data, including color balancing, adjusting brightness, and so on.
It's possible to add transformations to any of your objects. Transformations allow you to move, resize, or rotate any element (text, drawing, image) you place on the canvas.
Finally, you can use JavaScript's animation and user interface tools to build your own animations that move an element around in real time or under user control.
Fill and Stroke Styles
Nearly every operation in the canvas implements a fill or stroke style. To get the most out of canvas, you need to understand how they work. There are three primary types of styles that can be used on fills and strokes: colors, gradients, and patterns.
Colors
There are a number of places where you can indicate a color value in the canvas API. In general, you can use the same color tools you use in CSS and HTML:
- Six-digit hex values: The most common way to manage colors is with the same six-digit hexadecimal scheme commonly used in CSS, with two digits each for red, green, and blue. The value begins with a pound sign. For example, #FF0000 is red, and #FFFF00 is yellow.
- Three-digit hex values: Hex color values often use repeating values, so you can abbreviate these values as three-digit numbers. In this scheme, red is #F00 and yellow is #FF0
- Color names: You can often use color names, like “red” or “yellow.” Common color names usually work, but not all browsers support the same list of color names, so “papaya whip” is not likely to be supported. (It sounds more like a dessert recipe than a color to me anyway.)
- rgb and rgba values: You can use the rgb() function to create colors using integers (0–255) or percentages (0%–100%). Red would be rgb(255, 0, 0), and yellow is rgb(100%, 100%, 0%). Note that the rgb function must go in quotes like any other color value. If you want to include alpha, add a fourth parameter that is a 0–1 value. Transparent red would be rgba(255, 0, 0, 0.5).
- hsl and hsla: The new hsl and hsla color formats are supposed to be supported by the <canvas> element, but so far the support for these features varies by browser.
Note that the various values for a color are always enclosed in quotes. The color parameter is a string that can be interpreted as a CSS color.
Gradients
You can also fill a shape with a gradient. Canvas gradients are defined in two steps:
- Create a gradient object: There are two methods built into the context object for this. One builds linear gradients, and the other builds radial gradients.
- Add color stops: A color stop is a special element that indicates a color to be added to the gradient. You can add as many colors as you wish, and you can also specify where along the gradient pattern the color will appear.
The following code builds a radial gradient and a linear gradient on a canvas.
function draw(){
//from gradient.html
var drawing = document.getElementById("drawing");
var con = drawing.getContext("2d");
//build a linear gradient
lGrad = con.createLinearGradient(0,0,100,200);
lGrad.addColorStop(0, "#FF0000");
lGrad.addColorStop(.5, "#00FF00");
lGrad.addColorStop(1, "#0000FF");
con.fillStyle = lGrad;
con.fillRect(0, 0, 100, 200);
//build a radial gradient
rGrad = con.createRadialGradient(150, 100,
0, 150, 100, 100);
rGrad.addColorStop(0, "#FF0000");
rGrad.addColorStop(.5, "#00FF00");
rGrad.addColorStop(1, "#0000FF");
con.fillStyle = rGrad;
con.fillRect(100,0, 200, 200);
} // end draw
The output of this code is shown in Figure 6-2.

Figure 6-2: These gradient patterns were created by code.
A linear gradient is a pattern of colors that blend into each other along a straight-line path. To define a linear gradient:
- Create a variable to hold the gradient: Gradients are a little more complex than simple colors, so they are stored in variables so they can be re-used.
- Build the gradient: Use the createLinearGradient() method of the context object to build a linear gradient.
- Define the gradient path: The createLinearGradient() method expects four parameters. These define a line (x1, y1, x2, y2). The colors are perpendicular to this line, so if you want horizontal color bands, draw a vertical line. If you want vertical color bands, draw a horizontal line. In my example, I drew a diagonal line for diagonal colors. The line typically takes up the entire width or height of the element, but it does not have to. If the line is smaller than the image, the excess area is automatically assigned a color from the nearest end of the gradient.
- Add color stops: Gradients aren't much fun without colors. The addColorStop() method of the gradient object allows you to add a color to the gradient. Each color stop has two parameters: position and color. The position is a 0–1 value indicating where on the gradient line the color should be positioned. 0 is the beginning, 1 is the end, and intermediate values are in the middle. The color parameter is a text value that can be evaluated as a CSS color. You can use any of the mechanisms described in the color section of this part. At a minimum, you should define two color stops, one for the beginning, and one for the end.
- Apply the gradient as a fill pattern: If you want to use the gradient as a fill pattern, set the context's fillStyle to the gradient variable you just created. All subsequent fills will be done using the gradient pattern until the fillStyle is changed to something else.
Radial gradients are similar. Rather than drawing a gradient in a straight line, they draw a series of circular color bands. The first color is the center of the circle, and the last color defines an outer radius. Building a radial gradient is very similar to building a linear gradient. The only difference is the create command.
Use the console object's createRadialGradient() method to build a radial gradient. This command actually takes six parameters:
- beginX: The X position of the starting point. This is often in the center of your shape.
- beginY: Along with centerX, this determines the beginning position of your gradient.
- beginRadius: The radius of your center circle. Usually this is 0, but you can make it larger if you want to emphasize the center color more.
- endX: Describes the X position of the ending circle. Typically this is the same as beginX.
- endY: Along with endX, endY defines the position of the ending circle. If the beginning and ending circles have the same positions, you'll get a circular gradient. Change the ending position to make the gradient stretch in a particular direction.
- endRadius: The ending radius defines where the last color gradient will be placed. Smaller values for this radius will lead to a tightly grouped gradient, and larger values will spread the gradient along a larger area.After the gradient is defined, the addColorStops() method works exactly like it does for linear gradients. The variable created through the addRadialGradient() command is usually stored in a variable, where it can be used for subsequent fillStyle() requests.
Patterns
A pattern is used to define an image to be used as a fill or stroke. You can use any image as a pattern, but it's generally best to find or create an image that is designed to be tiled. (See Book VIII, Chapter 4 for complete information on how to build tiled patterns using free software.) Many sources of tiled patterns exist on the web as well. After you've got an image you want to use as a fill pattern, here's how to implement it in the <canvas> tag:
function draw(){
//from pattern.html
var drawing = document.getElementById("drawing");
var con = drawing.getContext("2d");
var texture = document.getElementById("texture");
pFill = con.createPattern(texture, "repeat");
con.fillStyle = pFill;
con.fillRect(10,150,190,150);
con.font = "40px sans-serif";
con.fillText("Pattern!", 20, 80);
con.strokeStyle = pFill;
con.lineWidth = 5;
con.strokeRect(10, 10, 180, 100);
} // end draw
You can see the results of this code in Figure 6-3.

Figure 6-3: An image pattern can be applied to text and other shapes.
A pattern is simply an image. Building a pattern is relatively straightforward:
- Get access to an image.
You'll need a JavaScript image object to serve as the basis of your pattern. There's a number of ways to do this, but the easiest is to create the image somewhere in your HTML, hide it with the display:none style, and use the standard document.getElementById() technique to get access to your image. (See “Drawing an image on the canvas” toward the end of this chapter for alternate ways to load images.)
- Create a variable for the pattern.
Like gradients, pattern fills can be reused, so store the pattern in a variable for later reuse.
- Build the pattern.
The context's createPattern() method creates a pattern from an image.
- Specify the pattern's repeat parameter.
The second parameter indicates how the pattern will repeat. The default value is repeat, which repeats the pattern in both the X and Y axis indefinitely. If your pattern is not tiled, you will see a visible seam where the pattern repeats. You can also set the repeat value to repeat-x, repeat-y, and no-repeat.
- Apply the pattern variable to the fillStyle or strokeStyle.
Assign the pattern variable to the context's fillStyle and then perform any fill operation to draw in the pattern.
Drawing Essential Shapes
A few primitive shapes can be drawn directly onto the graphics context. The most common shapes are rectangles and text.
Rectangle functions
You can draw three different types of rectangles:
- clearRect(x, y, w, h): Erases a rectangle with the upper-left corner (x,y) and size (w,h). Generally, erasing draws in the background color.
- fillRect(x, y, w, h): Draws a box with upper-left corner (x,y) and size (w,h). The rectangle is filled in with the currently-defined fillStyle.
- strokeRect(x, y, w, h): Draws a box with upper-left corner (x,y) and size (w,h). The box is not filled in, but the outline is drawn in the currently-defined strokeStyle and using the current lineWidth.
Figure 6-4 illustrates a couple of rectangles.
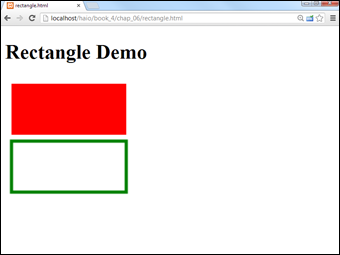
Figure 6-4: You can easily draw rectangles on a canvas.
Here's the code that generates Figure 6-4:
function draw(){
//from rectangle.html
var drawing = document.getElementById("drawing");
var con = drawing.getContext("2d");
con.fillStyle = "red";
con.strokeStyle = "green";
con.lineWidth = "5";
con.fillRect(10, 10, 180, 80);
con.strokeRect(10, 100, 180, 80);
} // end draw
Drawing text
The <canvas> tag has complete support for text. You can add text anywhere on the canvas, using whichever font style and size you wish.
Figure 6-5 shows a canvas with embedded text.
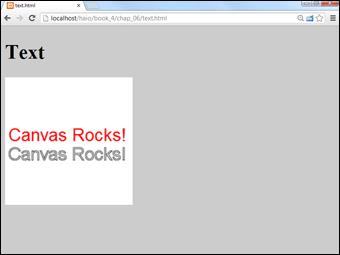
Figure 6-5: Text is embedded into the canvas.
Text is drawn onto canvas much like a rectangle. The first step is to pick the desired font. Canvas fonts are created by assigning a font to the context's font attribute. Fonts are defined like the single-string font assignment in CSS. You can specify all of the font characteristics in the same order you do when using the font shortcut: style, variant, weight, size, and family.
When you're ready to display actual text on the screen, use the fillText() method, which accepts three parameters. The first parameter is the text to display. The last two parameters are the X and Y position of the left-hand side of the text. The following code is used to produce the result shown in Figure 6-5. When the strokeStyle is not explicitly set, the stroke is black by default.
function draw(){
//from text.html
var drawing = document.getElementById("drawing");
var con = drawing.getContext("2d");
//clear background
con.fillStyle = "white";
con.fillRect(0,0, 200, 200);
// draw font in red
con.fillStyle = "red";
con.font = "20pt sans-serif";
con.fillText("Canvas Rocks!", 5, 100);
con.strokeText("Canvas Rocks!", 5, 130);
} // end draw
Adding shadows
You can add shadows to anything you draw on the canvas. Shadows are quite easy to build. They require a number of methods of the context object:
- shadowOffsetX: Determines how much the shadow will be moved along the X axis. Normally this will be a value between 0 and 5. A positive value moves the shadow to the right of an object. Change this value and the shadowOffsetY value to alter where the light source appears to be.
- shadowOffsetY: Determines how far the shadow is moved along the Y axis. A positive value moves the shadow below the object. In general, all shadows on a page should have the same X and Y offsets to indicate consistent lighting. The size of the offset values implies how high the element is “lifted” off the page.
- shadowColor: The shadow color indicates the color of the shadow. Normally this is defined as black, but the color can be changed to other values if you wish.
- shadowBlur: The shadowBlur effect determines how much the shadow is softened. If this is set to 0, the shadow is extremely crisp and sharp. A value of 5 leads to a much softer shadow. Shadow blur generally lightens the shadow color.
If you apply a shadow to text, be sure that the text is still readable. Large simple fonts are preferred, and you may need to adjust the shadow color or blur to ensure the main text is still readable. After you've applied shadow characteristics, all subsequent drawing commands will incorporate the shadow. If you want to turn shadows off, set the shadowColor to a transparent color using RGBA.
Here's the code to produce text with a shadow:
<!DOCTYPE HTML>
<html lang = "en">
<head>
<title>shadow.html</title>
<meta charset = "UTF-8" />
<style type = "text/css">
body {
background-color: #cccccc;
}
</style>
<script type = "text/javascript">
function draw(){
//from shadow.html
var drawing = document.getElementById("drawing");
var con = drawing.getContext("2d");
//clear background
con.fillStyle = "white";
con.fillRect(0,0, 200, 200);
// draw font in red
con.fillStyle = "red";
con.font = "18pt sans-serif";
//add shadows
con.shadowOffsetX = 3;
con.shadowOffsetY = 3;
con.shadowColor = "gray";
con.shadowBlur = 5;
con.fillText("Canvas Rocks!", 5, 100);
} // end draw
</script>
</head>
<body onload = "draw()">
<h1>Shadows</h1>
<canvas id = "drawing"
height = "200"
width = "200">
<p>Canvas not supported!</p>
</canvas>
</body>
</html>
An example of a shadow inside a <canvas> is shown in Figure 6-6.

Figure 6-6: You can apply a shadow to any canvas drawing, including text.
Working with Paths
More complex shapes are created using the path mechanism. A path is simply a series of commands “played back” by the graphics context. You can think of it as a recording of pen motions. Here's an example that draws a blue triangle with a red border:
function draw(){
//from pathDemo.html
var drawing = document.getElementById("drawing");
var con = drawing.getContext("2d");
con.strokeStyle = "red";
con.fillStyle = "blue";
con.lineWidth = "5";
con.beginPath();
con.moveTo(100, 100);
con.lineTo(200, 200);
con.lineTo(200, 100);
con.lineTo(100, 100);
con.closePath();
con.stroke();
con.fill();
} // end draw
The code shown here generates the output displayed in Figure 6-7.
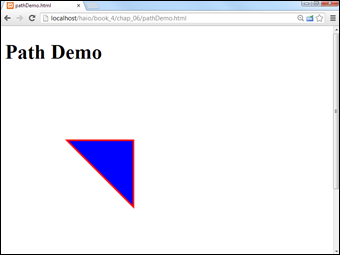
Figure 6-7: A path can be used to draw multi-line shapes.
The technique for drawing a path is not terribly complicated, but it does involve new steps:
- Generate the graphics context.
All <canvas> programs begin by creating a variable for the canvas and another variable for the graphics context.
- Set the strokeStyle and fillStyle.
strokeStyle indicates the color of lines. The lineWidth attribute describes how wide the line will be (in pixels), and fillStyle indicates the color that enclosed shapes will have.
- Begin the path.
A path is a series of drawing commands. Use the beginPath() method to start your path definition.
- Move the pen.
The moveTo(x,y) command moves the pen to a particular point on the screen without drawing.
- Draw lines.
The lineTo(x, y) command draws a line from the current pen position to the indicated (x, y) coordinates. See the “Drawing Essential Shapes” section for information on other drawing commands for building arcs, circles, and more complex curves. (Note that the line will still not be visible. See Step 7.)
- Close the path.
When you're finished with a path, use the closePath() function to indicate you are finished defining the path.
- Stroke or fill the path.
When you define a path, it is not immediately displayed! The stroke() command draws a line using the current stroke style and line width along the path. If you prefer, use the fill() command to draw a filled-in shape defined by the path. If the path did not define a closed shape, the fill() command draws a line from the ending point to the beginning point. The fill() command fills in the path with the color, gradient, or pattern designated with fillStyle().
Note that the closePath() function draws a connecting line between the first point of the path and the last point. This creates closed shapes. If you want a path to remain open, use the stroke() command before the closePath() command. It is still necessary to call closePath() before creating a new path.
 Remember, the lineTo() method doesn't actually draw a line! It simply indicates your path. The path is not visible until you execute a stroke(), closePath(), or fill() command.
Line-drawing options
Whenever you are using stroke commands, you can modify the line width and style with a number of interesting options. Figure 6-8 shows a few of these choices.

Figure 6-8: You can modify several aspects of the stroke.
The code used to create Figure 6-8 is here:
function draw(){
//from lineStyle.html
var drawing = document.getElementById("drawing");
var con = drawing.getContext("2d");
//change line width and color
con.strokeStyle = "red";
con.lineWidth = 10;
con.lineJoin = "round"
con.beginPath();
con.moveTo(10, 40);
con.lineTo(20, 10);
con.lineTo(30, 40);
con.stroke();
con.closePath();
con.strokeStyle = "blue";
con.lineJoin = "bevel"
con.beginPath();
con.moveTo(40, 40);
con.lineTo(50, 10);
con.lineTo(60, 40);
con.stroke();
con.closePath();
con.lineJoin = "miter";
con.strokeStyle = "green"
con.beginPath();
con.moveTo(70, 40);
con.lineTo(80, 10);
con.lineTo(90, 40);
con.stroke();
con.closePath();
//line caps
con.lineCap = "butt";
con.strokeStyle = "red"
con.beginPath();
con.moveTo(10, 100);
con.lineTo(90, 100);
con.stroke();
con.closePath();
con.lineCap = "round";
con.strokeStyle = "blue"
con.beginPath();
con.moveTo(10, 120);
con.lineTo(90, 120);
con.stroke();
con.closePath();
con.lineCap = "square";
con.strokeStyle = "green"
con.beginPath();
con.moveTo(10, 140);
con.lineTo(90, 140);
con.stroke();
con.closePath();
} // end draw
While the code listing is long, it is quite repetitive. There are only a few new elements:
- strokeStyle: Use any of the style options (color, gradient, or pattern) to specify how your line will be drawn.
- linewidth: Specify the width of your line in pixels.
- lineJoin: The lineJoin property indicates how corners are rendered in your paths. The default form is miter, which produces sharp corners. You can also choose round, which gives rounded corners, and bevel, which squares off the corners.
- lineCap: You can also determine how the ends of the lines are rendered. Use round to produce rounded edges, square to produce squared-off edges, and butt to produce edges that are cut off exactly at the line width. Square and butt look almost identical, but square adds a small length to each line, and butt cuts off the line immediately.
Drawing arcs and circles
Arcs and circles are part of the path mechanism. They are created much like lines, as they are executed as part of a path. After the path is complete, use the stroke() or fill() command to actually draw the arc or circle.
Arcs and circles are both created with the arc() method.
To draw an arc or a circle:
- Set the stroke or fill style.
Like all path-drawing commands, you'll need to specify the fill or stroke style before drawing the arc.
- Begin a path.
Arcs, like lines, must be drawn as part of a path. Arcs can be combined with lines if you wish.
- Specify the center of the circle.
An arc is simply a partial circle, so you begin defining an arc by determining the center of a circle. The first two parameters of the arc() method are the center of the circle.
- Indicate the radius of the circle.
The third parameter is the radius of the circle that describes the arc.
- Define beginning and ending points.
An arc is a part of a circle. To indicate which part of the circle you want to draw, indicate the beginning and ending angles. These measurements are the fourth and fifth parameters of the arc() method. Note that angles are defined in radians.
- Indicate the direction to draw.
The last parameter determines the drawing direction. Use true for counter-clockwise, and false for clockwise.
The arc drawing functions are used in the following code:
function draw(){
//from arcCirc.html
var drawing = document.getElementById("drawing");
var con = drawing.getContext("2d");
con.strokeStyle = "green";
con.fillStyle = "rgba(255,0,0,0.5)";
con.lineWidth = "5";
//half-circle stroked
con.beginPath();
con.arc(220, 140, 50, 0, Math.PI, false);
con.closePath();
con.stroke();
//full circle filled
con.beginPath();
con.arc(220, 220, 50, 0, Math.PI*2, true);
con.closePath();
con.fill();
}
This code generates the image shown in Figure 6-9.

Figure 6-9: Draw circles and arcs with the arc() command.
The angle measurements of the arc() command use radians as the unit of angle measurement. Radians are frequently used in mathematics rather than degrees. A radian is simply the angle described when you stretch the radius of a circle around the circumference of that same circle. Radians are normally expressed using the constant π, so there are 2 * π radians in a full circle. JavaScript has the built-in constant Math.PI to simplify working with pi. You can use Table 6-1 to determine the main angles. (See Table 6-1.)
Table 6-1 Angle Measurements in Radians
|
Direction |
Angle |
|
North |
3 * Math.PI/2 |
|
West |
Math.PI |
|
South |
Math.PI/2 |
|
East |
0 |
 If you're familiar with radian measurement, you might think the angles are upside down (typically, π /2 is north and 3* π /2 is south). The angles are reversed because Y increases downwards in computer systems.
Drawing quadratic curves
The canvas element also supports two elegant curve-drawing mechanisms. A quadratic curve is a special curve with a start and ending point. However, the line between the beginning and ending point is influenced by a control point. As an example, look at Figure 6-10. It shows a simple curve with a control point.
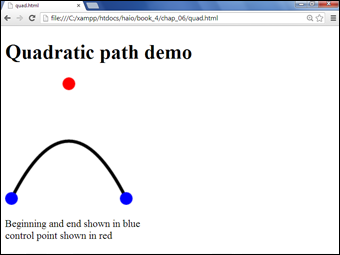
Figure 6-10: Quadratic curves have a single control point.
If you examine the code for the quadratic curve, you'll see it works much like drawing lines and arcs:
function draw(){
//from quad.html
drawing = document.getElementById("drawing");
con = drawing.getContext("2d");
con.strokeStyle = "black";
con.lineWidth = "5";
con.beginPath();
con.moveTo(10,190);
con.quadraticCurveTo(100, 10, 190, 190);
con.stroke();
con.closePath();
//mark beginning and end with blue
drawDot(10, 190, "blue");
drawDot(190, 190, "blue");
//mark control points with red
drawDot(100, 10, "red");
} // end draw
function drawDot(x, y, color){
con.fillStyle = color;
con.beginPath();
con.arc(x, y, 10, 0, 2 * Math.PI, true);
con.fill();
con.closePath();
} // end drawDot
The beginning and ending points of a quadratic curve are described explicitly, and the line begins and ends on these points. However, the control point doesn't usually lie on the curve. Instead, it influences the curve.
Here's how to build a quadratic curve:
- Begin a path.
Curves, like most drawing features, act in the context of a path.
- Move to the starting position.
Use the moveTo() command to move to where you want the curve to begin.
- Use the quadraticCurveTo()method to draw the curve.
This method takes four parameters: the X and Y position of the control point and the X and Y position of the end point.
- Draw another curve if you wish.
Like most of the drawing commands, you can chain a series of quadraticCurveTo() calls together to build a more complex shape.
Note that for this example I called a custom function called drawDot to draw the various points on the screen. See the complete code on my website. (For more information on the website, see this book's Introduction.)
Building a Bézier curve
The Bézier curve is another curve-drawing tool. It is similar to the quadratic curve, except it requires two control points. Figure 6-11 illustrates a Bézier curve.
Building a Bézier curve is almost exactly like building a quadratic curve. The bezierCurveTo function takes six parameters, the X and Y position of control point one, control point two, and the ending point. Here's the code for the Bézier path shown in Figure 6-11.
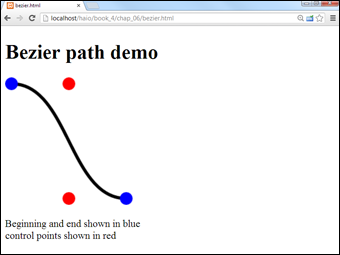
Figure 6-11: The Bézier curve uses two control points.
function draw(){
//from bezier.html
drawing = document.getElementById("drawing");
con = drawing.getContext("2d");
con.strokeStyle = "black";
con.lineWidth = "5";
con.beginPath();
con.moveTo(10,10);
con.bezierCurveTo(100, 10, 100, 190, 190, 190);
con.stroke();
con.closePath();
//mark beginning and end with blue
drawDot(10, 10, "blue");
drawDot(190, 190, "blue");
//mark control points with red
drawDot(100, 10, "red");
drawDot(100, 190, "red");
} // end draw
function drawDot(x, y, color){
con.fillStyle = color;
con.beginPath();
con.arc(x, y, 10, 0, 2 * Math.PI, true);
con.fill();
con.closePath();
} // end drawDot
Like the quadratic curve example, I used a custom drawDot() function to draw circles for the control point. See the section “Drawing arcs and circles” for information on how to draw these dots.
Images
Although HTML has long had support for images, the canvas interface adds new life to web images. Images can be displayed inside a canvas, where they can be integrated with the vector-drawing techniques of the canvas API. You can also select a portion of an image to display and apply the various transformations to your image to create interesting compositions and animations.
Figure 6-12 shows a basic version of this technique, with an image drawn twice on a canvas element.
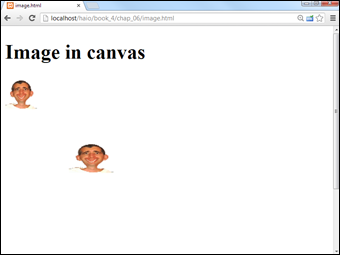
Figure 6-12: The canvas element has flexible options for drawing images.
Drawing an image on the canvas
The easiest way to use an image in a <canvas> element is to use an image that is already available on the web page. You can put an image on the page with the ordinary <img> tag and use the CSS display: none rule to make the image invisible. An alternate approach is to create an Image object in JavaScript and apply the src attribute to connect that image to a specific image file. For examples of both techniques, consider the following HTML code:
<img class = "hidden"
id = "goofyPic"
src = "andyGoofy.gif"
alt = "Goofy pic of me" />
<canvas id = "drawing"
height = "400"
width = "400">
<p>Canvas not supported</p>
The following JavaScript code displays the image in the canvas:
function draw(){
//from image.html
var drawing = document.getElementById("drawing");
var con = drawing.getContext("2d");
var goofyPic = document.getElementById("goofyPic");
con.drawImage(goofyPic, 0, 0, 50, 50);
var image2 = new Image();
image2.src = "andyGoofy.gif";
con.drawImage(image2, 100, 100, 70, 50);
} // end draw
Here's how it's done:
- Create the image in the main page.
The easiest way to access an image is to use ordinary HTML to embed the image in the main page. If you wish, you can hide the <img> tag with CSS code (display: none) so that only the version in the canvas is visible.
- Create a JavaScript variable for the image.
Use the ordinary document.getElementByID() mechanism to create a variable referring to the image.
- Draw the image on the canvas.
The drawImage() function takes five parameters. The first is the name of an image object (It must be the name of a JavaScript image object, not just the filename of an image.) The next two parameters are the X and Y values of the top-left corner of the image, and the last two parameters are the size of the image (width and height.)
- Create a JavaScript Image object.
If you don't want to embed an image in the page, you can use JavaScript to create an image dynamically. Use the new Image() constructor to build a new image.
- Change the image's src property.
If you create a JavaScript image, you must specify the src attribute to indicate the file associated with the image. It might take some time for the image to load.
The image won't display until it has loaded from the server. In most cases, this won't be a problem, but sometimes you'll find you need to delay your program until the image has finished loading. The image object has an onload property that accepts a callback function. Use this technique to wait until your drawing finishes.
image.onload = finishDrawing;
function finishDrawing(){
//rest of drawing code goes here
}
Drawing part of an image
Sometimes you'll want to draw a small part of the original image. Figure 6-13 illustrates a program focusing in on the center of the goofy face:
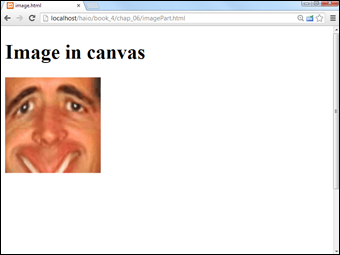
Figure 6-13: This image is a zoomed-in section of the previous image.
It's quite easy to draw part of an image. Use the same drawImage() command, but this time use a version with nine parameters:
con.drawImage(goofyPic, 60, 70, 90, 90, 0, 0, 150, 150);
Here's what all these parameters mean:
- Image name: The first parameter is the name of the image (not the filename, but the name of the JavaScript Image object).
- Top left corner of source: The first job is to choose the part of the original picture that will be displayed. The next two parameters indicate the top left corner of a selection on the original picture. (You might use an image editor like Gimp or IrfanView to determine the selection position and size.)
- Height and width of source: The next two parameters indicate the height and width of the source selection.
- Position of destination: The next two parameters are the position of the picture's top left corner on the canvas.
- Size of destination: The last two parameters describe the size of the destination image on the canvas.
The “draw only part of an image” technique described here is quite useful because it allows you to combine several images into a single image (sometimes called a sprite sheet). This decreases the overhead for delivering the image (one large image is faster to deliver than several small ones). It's also frequently used in games and animations where one entity might have several images displayed in sequence to suggest walking or attacking.
Manipulating Pixels
The <canvas> tag has one more incredible trick up its sleeve. You can extract the data of a <canvas> tag into the underlying pixel data. If you know how to manipulate this data, you can have very extensive control of your image in real time. You can use this data for color balancing, as well as experimenting with your own blurs, sharpens, and chroma-key effects.
In order to understand how to have this much control of your images, you need to have some knowledge of how pictures are stored in memory. No matter what format an image is stored in on the file system, it is displayed as a list of pixels. Each pixel is represented (in the standard 32-bit system, anyway) by four integers: RGBA. The R value represents how much red is in the current dot. G stands for green, and B stands for blue. The A stands for alpha, which is a measure of the transparency of the image. Each of these values can vary from 0 to 255. When you convert an image to the imageData, you get a huge array of integers. Each group of four integers represents a single pixel of color data.
Here's an example that changes the color balance of an image:
function draw(){
//from pixel.html
var drawing = document.getElementById("drawing");
var con = drawing.getContext("2d");
var original = document.getElementById("original");
CANV_WIDTH = 200;
CANV_HEIGHT = 200;
//draw the original on the canvas
con.drawImage(original, 0, 0);
//get the image data
imgData = con.getImageData(0, 0, 200, 200);
//loop through image data
for (row = 0; row < CANV_HEIGHT; row++){
for (col = 0; col < CANV_WIDTH; col++){
//find current pixel
index = (col + (row * imgData.width)) * 4;
//separate into color values
r = imgData.data[index];
g = imgData.data[index + 1];
b = imgData.data[index + 2];
a = imgData.data[index + 3];
//manipulate color values
r -= 20;
g += 50;
b -= 30;
a = a;
//manage boundary conditions
if (r > 255){
r = 255;
}
if (r < 0){
r = 0;
}
if (g > 255){
g = 255;
}
if (g < 0){
g = 0;
}
if (b > 255){
r = 255;
}
if (b < 0){
b = 0;
}
if (a > 255){
a = 255;
}
if (a < 0){
a = 0;
}
//return new values to data
imgData.data[index] = r;
imgData.data[index+1] = g;
imgData.data[index+2] = b;
imgData.data[index+3] = a;
} // end col for loop
} // end row for loop
//draw new image onto canvas
con.putImageData(imgData, 0, 0);
} // end function
Although the code listing seems quite long, it really isn't too difficult to follow:
- Draw an original image.
The technique you'll use extracts data from a <canvas> element, so to modify an image, first you need to draw it onto a canvas. I drew my goofy face image on the canvas first with the ordinary drawImage() method.
- Extract the image data.
The getImageData() method gets the picture displayed by the current canvas and places it in a huge array of integers.
- Make a loop to handle the rows.
Image data is broken into rows and columns. Each row goes from 0 to the height of the canvas, so make a for loop to iterate through the rows.
- Make another loop to handle the columns.
Inside each row is data from 0 to the width of the canvas, so make a second for loop inside the first. It's very common to use a pair of nested for loops to step through two-dimensional data like image information.
- Find the index in imageData for the current row and column.
The imageData array contains four integers for each pixel, so we have to do a little math to figure out where the first integer for each pixel is. The easiest formula is to multiply the row number by the width of the canvas, add that to the column number, and multiply the entire result by four.
- Pull the corresponding color values from the index.
The index also represents the red value of the current pixel. The next int holds the green value, followed by the blue value, and finally the alpha value.
- Manipulate the color values as you wish.
If you're going to do a color-balancing app (as I'm doing), you can simply add or subtract values to change the overall color balance. In my example, I add a bit to green and subtract a bit from red and blue. I chose to leave the alpha alone. Of course, this is where you can do much more elaborate work if you want to play around with pixel-level image manipulation.
- Check for boundaries.
A pixel value cannot be lower than 0 or higher than 255, so check for both of these boundaries and adjust all pixel values to be within legal limits.
- Return manipulated values back to the imgData array.
You can copy values back to the array, and you should do so, to make the changes visible.
- Draw the imageData back to the canvas.
The putImageData() function draws the current image data back to the canvas as an ordinary image. The new version of the image will reflect the changes. In my case, I have a decidedly ill-looking image.
Color-balancing is too subtle an effect to display accurately in a black-and-white screen shot, so please visit the book's companion website to see this program in its full glory. See the book's Introduction for more on the website.