
Examination and analysis of failed components
2.1 Introduction
Various experimental methods are needed to examine the physical remains when polymer products fail. It may include many samples, or just a unique example, so care is needed in the choice of methods. It is also valuable to examine intact samples of a failed product to check their integrity using similar methods. A central aim of this chapter is to review the range of methods for analyzing polymers and it includes the:
However, it is worth reiterating that the cause of many failures can be detected by careful examination using low-power magnification coupled with some basic chemical or physical testing and analysis. Inspection of the failure will show the forces involved, whether the load was applied cyclically or was a single overload, the direction of the critical load, and the influence of outside forces such as residual stresses or strains. Knowing the roots of the failure, the investigator can pursue both the causes of failure and possible human errors. The way products are made is important for the features that can arise from the particular way a polymer is shaped, and when those features turn into defects.
2.2 Processing methods and defects
Shaping of polymers occurs via several routes, especially:
Each produces characteristic faults, most of which are detected by the machine operator. Many, however, are difficult to spot without access to microscopes or other methods, so defective products can enter the chain.
2.2.1 Injection moulding
The method involves injection of molten polymer into a shaped tool which can be separated at the end of the moulding cycle (Fig. 2.1). The tool has at least one gate where the polymer enters, and in some cases where the shape to be created is complex, several gates. Since the metal parts of the tool must be able to separate, there are several important design rules. Polymer products frequently need supporting ribs, so they must be aligned with the direction of withdrawal of the tool, for example. The cycle time is dominated by the cooling period (Fig. 2.2) caused by their low thermal conductivity, and many polymers must be cooled slowly so as to relieve internal strains and stresses which can result from quenching. Otherwise, a seriously defective product can be created. Where holes are needed in a product, the flow of the melt has to part, creating the problem of weld lines where they rejoin. Voids and sinks can act as stress concentrators if in the load path when the product is in service. Moulding features can include:


Other features may be created where the polymer granules are not dried correctly. Since thermoplastic polymers have to be processed well above the Tg or melting point, Tm, it is usually well above the boiling point of water, so any traces of moisture will create voids and surface splay marks, for example. It may also degrade the molecular weight by hydrolysis.
Whether a moulding feature becomes a defect depends on its location on the product, its further treatment and its final environment. Thus a weld line in an unstressed part of the product may never cause failure. However, if it falls along a load path, it can act as a nucleus for a brittle crack.
The polymer melt viscosity is an important variable in the process because it effectively controls not just the way the process works, but the strength of the final product. The root variable is molecular weight, which determines both properties: the greater molecular weight of the polymer, the greater both the melt viscosity and the product mechanical strength. The shear stress, τ of a Newtonian fluid like water is related to the shear rate, γ and the viscosity μ by the simple equation
However, polymer melts are governed by a so-called rate law where the shear stress is more sensitive to shear rate, or the rate at which the melt moves when sheared:
with the exponent n of negative value. In other words, the melt viscosity decreases with increasing shear rate, and such fluids are generally known as ‘pseudoplastic’ in nature, a specific example of a non-Newtonian liquid (Fig. 2.3). So as the shear rate increases, the shear stress falls. The diagram shows how several different polymers react as shear rate rises, and there are considerable variations between them. Thus acrylics such as PMMA and PVC fall fastest compared with more rigid chains like those of PBT (polybutylene terephthalate) and polyethersulphone. The MFI is the melt flow index, an empirical measure of melt viscosity used by moulders, and inversely related to molecular weight. The shear rates encountered in the pipes of moulding machines are typically above 103 sec− 1, so the melt viscosities used in moulding are those to the right of the diagram. There is a subtle implication that some polymers are more difficult to mould than others, those polymers with inflexible chains generally being more difficult than simple chains like LDPE. Greater care is needed for such polymers, which includes polysuphones, polycarbonates as well as PBT. Similar care is needed with composites such as short glass reinforced materials such as GF nylon owing to the thickening effect of the short fibres present in the melt.

The melt viscosity below entanglement is proportional to molecular weight:
But when the chains start to entangle with one another, then the melt viscosity rises very steeply according to a power law:
The influence of the two equations is illustrated for some polymers by Fig. 2.4, where the molecular weight is now plotted in terms of the number of atoms in the backbone chain, NB. This is why injection moulding grades of polymers tend to be chosen near to the entanglement molecular weight so as to minimize melt viscosity. However, the tensile strength will lie at the lower end of expectations, and will be sensitive to any mechanism which cuts or degrades chains. It might only need a few single chain scissions to lower the molecular weight locally to below entanglement, the tensile strength drops dramatically and a brittle crack is initiated.

Injection moulding is the most sophisticated moulding technique, and the tools are an expensive part of the process, their cost being determined by their complexity. Production runs must be long to justify their cost, and there are various way of increasing the rate, by using multi-cavity tools, for example (1,2).
2.2.2 Extrusion
The process of injecting a stream of molten polymer through a die of constant section is known as extrusion, and it is generally simpler than injection moulding. Pipe, sheet and profiles are made using the method, but there are several kinds of feature in the final product which can be deleterious. Perhaps the most important is the equivalent of weld lines: so-called ‘spider lines’ which are aligned along the axis of a pipe, for example. They are formed by the internal metal supports for the die head, where the melt divides before reforming. If the melt is too cold, then reformation is poor, so leaving lines along the extrudate. They can be seen clearly in the section of a pipe in Fig. 2.5.

The section also shows another problem encountered in all processes: poor mixing of ingredients, in this case carbon black in polyethylene. To achieve the best product strength, such fillers must be mixed to make a uniform material, combining both high dispersion and an even distribution of particles.
Owing to the simplicity of extrusion, much greater molecular weight material can be used, so extruded products tend to be stronger than moulded products. The problem of residual strain is also usually much reduced in extrudates. This is why pipe is generally very strong, failures tending to occur at joints.
2.2.3 Other moulding methods
Rotational moulding is a way of shaping products without two matching tools. Only an outer tool is used, and a weighed quantity of powder is added to the tool, which is then rotated in an oven. The particles gradually melt and fuse to create a uniform wall, which can then be removed at the end of the cycle. Since high pressure is not used, higher tool temperatures are needed, so raising the chance of thermal degradation. The inner surface can also be rough owing to incomplete particle fusion. Both oxidation and geometric irregularity can weaken this surface, making products weak to external impact loads (3).
Compression moulding is a primitive form of injection moulding, but yet widely used for elastomers and some thermosets. It suffers from the poor control of melt flow, although tools are simple and production rates high. The features, which may turn into defects, follow those of injection moulding. Perhaps the most sophisticated method is used in tyre building, where temperature control is crucial to achieving the best properties of the many different parts of the product.
With materials of extremely high molecular weight, which are impossible to mould or extrude, sintering is a possible forming route. The process involves use of very high pressures to compress powder particles together into very simple shapes in a closed mould. It is used for ultra-high molecular weight PE or UHMPE, and PTFE, for example. Shaping by machining can then be achieved, although costs are high, since each product must be shaped individually.
2.2.4 Other shaping routes
Welding is an important secondary process used to bond components together to make a composite product. Thermal or fusion welding presents the problem of temperature control. Since high temperatures are needed, the problem of oxidation is ever present, so good control of the process is needed to achieve a reliable bond. Those problems can go undetected until too late, as when a pipe exploded at a chemical works on Teesside (Fig. 2.6). The polypropylene pipe was in a scrubbing line designed to remove strong acids from effluent gases, and was operated at 50 °C and a pressure of 0.5 bar up to 1.7 bar when it failed suddenly. The fracture surface (Fig. 2.7) showed that a brittle crack had been growing for some time in the butt fusion weld, judging by discolouration in the crack. An exhaustive investigation showed there to be a faulty heater element in the welding machine, causing it to operate 50 °C below the specified temperature of 220 °C for the polymer. This operation temperature of about 170 °C compares with the normal melting point of about 176 °C, so it was likely that the opposing sides of the weld had not fused correctly, and formed a weld line. The feature opened up slowly when the pipe was working, until 8 months after installation, it failed catastrophically Three other faulty welds in other pipes were also found when the relevant parts were dissembled. Precautions were introduced to prevent future problems by calibrating the heater elements in the welding machine on a regular basis.


2.3 Mechanical testing
Since many product failures involve fracture, mechanical testing can be important for establishing the state of the material (3). However, it is of limited value in most investigations because ample material is needed for testing, material which is usually unavailable. Large samples of flat sheet are needed to cut dumbbell specimens, normally an impossible requirement. It is destructive, so cannot be used for unique samples. Polymer products are often highly anisotropic, so any results are of limited diagnostic value.
2.3.1 Tensile testing
Component failures can occur by traumatic overloading, as a result of poor design, incorrect material selection, manufacturing defects or environmental factors. Mechanical properties of a failed component are, therefore, of prime interest in any failure investigation, as they will provide an insight as to how the component would perform under ‘service’ loading conditions. Some of the most widely quoted mechanical properties are those determined by a tensile test. A common measure given by a test is the tensile modulus, E, which is simply the initial slope of a stress-strain curve defined by:
where the stress, σ is just the applied force, F per unit cross-section area of the test piece, A:
and the strain, α is the relative extension from an original sample length l0 to length l
As well as elastic modulus, a wide range of mechanical data can be generated from tensile tests, such as tensile strength, elastic limit, yield point, cold drawing and so on. The tensile test rarely tells the whole story, and further mechanical information may be required to conclude a failure inquiry.
2.3.2 Creep and stress relaxation
But polymers are essentially viscoelastic materials, so their mechanical properties are subject to the time scale of examination as well as the local temperature. The tensile stress relaxation and creep moduli are often quoted as ER(t) or EC(t) where the time in brackets is stated, 10 seconds being a common standard. These are the values quoted in the table in Chapter 1, and are often used in design calculations (3,4).
With all polymers, their temperature sensitivity is high, particularly so for polymers with relatively low melting (Tm) and glass-transition (Tg) temperatures such as polyolefins. As part of their structure is in the amorphous elastomeric state at room temperature, their creep rates will in general be higher than materials such as PVC, PMMA and PC, which have glass-transition temperatures at or well above 100 °C.
Permanent distortion of polymer products is a symptom of poor design or exposure to higher loads or temperatures than expected. Figure 2.8, for example, shows a glass reinforced radiator reservoir distorted by contact with hot water in the cooling system of a brand new car on which the tank was being tested. The product had been injection moulded into a cold tool, so producing high levels of residual strain. The near boiling conditions of exposure allowed those strains to relax and distort the product, despite the high Tm of the nylon 6,6 matrix of 267 °C.

In a test of thermoplastic polypropylene from a failed storage tank, sample dumbbells were cut from the surrounding sheet as well as across a thermal weld. As will be discussed in detail in Chapter 4, the tank failed from just such a weld, and a test of the weld was thought useful. The bulk extruded sheet proved very strong, cold drawing above its yield point, but all the welds failed by brittle cracking across the centre of the weld. The fractures appear to have started small pinholes in the outer surfaces of the welds, and their weakness probably reflects the recrystallization of the material inevitably involved where the polymer was melted and then reformed. The weld strength of about 21 MNm− 2 compared well with the data sheet value of about 20 MNm− 2. As will be seen later, the failure was in fact caused by another problem unrelated to the polymer used in its construction.
2.3.3 Composite materials
The spread of moduli is extremely wide, from a few kNm− 2 for elastomers through common thermoplastics of about 2 MNm− 2, up to about 180 GNm− 2 for aramid fibres (5). It makes them ideal candidates for composite materials with a thermoset or thermoplastic matrix reinforced by a variety of fibres or particles. Their moduli can be modelled in several ways, a simple model of parallel loads giving the result:
where Ec is the composite modulus, E1 the fibre modulus and E2 the matrix modulus. The volume fraction of fibres is V1.
The parallel model in reality fails to recognize the great anisotropy of all composite materials, a factor which has to be taken into account when designing composite products and the relation between the load path and the fibre orientation.
Composites are attractive for highly demanding components because of the higher moduli and strengths available, so are widely used in aerospace and automotive applications such as the radiator tank already mentioned. It was moulded from short glass fibre (30% by weight) nylon 6,6, but failed during testing by a brittle crack developing at one point on its axis (Fig. 2.9). Water leaked through the crack when it had grown through the wall, and the engine of the new car seized up without warning. The crack had formed as a result of the pressure of the cooling system on the wall, and acting on a weld line which had formed along the axis of the component (6).

Tensile testing of the material revealed the anisotropy of the moulding, and only proved possible because the sample was not involved in litigation (it had been submitted by the manufacturer who wanted a detailed analysis). A new sample was also tested for comparison with the failed specimen. Two samples were tested to break from each tank, with the following strength recorded from machined dumbells:
| New sample, lateral to axis | σf = 84 MNm− 2 |
| New sample, parallel to axis | σf = 81 MNm− 2 |
| Failed sample, lateral | σf = 55 MNm− 2 |
| Failed sample, parallel | σf = 80 MNm− 2 |
All samples showed virtually identical strain to break of about 10%. The sample tested across the axis showed the lowest strength, probably caused by a small stress concentration in the outer surface. Flow lines could be seen in all the samples where the fibres were oriented during moulding from a central gate (Fig. 2.8). It was interesting to note that all values were well below the strength given in the material supplier’s data sheet of 140 MNm− 2 at a strain of 6%. So although the test did show a small difference between good and failed material, it did not point to the reasons for failure.
2.3.4 Photoelastic strain analysis
Indirect stress or strain analysis is a versatile method for investigating possible or actual failure of a product or part. Failure can be from externally applied stress or from residual (moulded-in) stresses. Both external stress and moulded-in strain (or a combination of both) can cause a part to fail prematurely. It is more straightforward to detect failure due to poor design, or excessive service forces. However, residual stresses and strains are altogether different. Here, poor moulding practice can generate residual strain just about anywhere, anytime. Photoelastic inspection will allow detection of frozen-in strains, allowing identification of failure, with the method revealing the actual levels of orientation in the part.
Some transparent plastics such as polycarbonate are highly birefringent and lend themselves to photoelastic stress analysis. The part is placed between two polarizing media and viewed, in the crossed polar position, from the opposite side of the light source. Fringe patterns are observed -without applying external stress, thus allowing observation of moulded-in or residual strains in the part. Figure 2.10 shows a set square containing residual moulding stresses that are clearly visible under the photoelastic viewing method. A high fringe order indicates areas of high chain orientation whereas low fringe order represents an unstressed area. Close spacing of fringes represents a high strain gradient, whereas uniform colour will be an indicator of uniform strain in the part. The injection point of polymer at P shows high residual strain, and the corners to the central hole an exceptional level. A weld line formed beyond the hole is also clearly visible (WW).

Plastic models can be used to simulate ‘in-service’ conditions. Both applied and residual stress fields can be exposed using models of structures in photosensitive material placed between polarizing filters in the crossed polar position. Figure 2.11 shows the stress fields present in a section of a bridge beam used in the first rail crossing of the Dee at Chester. It failed in May 1847 by brittle fracture. One possible initiation point lay in the corners present in the cavetto moulding shown in section on either side of the lower part of the cast iron structure. Straining the lower flange showed that the upper corner was the most seriously strained and thus the likely cause of the failure. The method is used widely for examining how structures respond to various load conditions (7).

2.4 Techniques for recording product failures
The simplest investigation tools are often the best, and simple observation is such a basic method that it is frequently forgotten by text books. However, it is perhaps the single most useful method for both recording and analyzing failures. Photography of the failed product and the context of failure at the site of an accident provides a permanent record, frequently useful at a later stage of an investigation.
2.4.1 Visual observation
The power of observation is a basic asset for the forensic investigator. However, there is a tendency to neglect the fundamental importance of our eyes - the simple power of visual observation, so that others may see what we have seen and the importance attached to it. Sharp observation will allow more than scrutiny of artefacts under examination - it may also provide an insight into the situation that led to failure in the first instance. Observations of this nature allow assessment of the circumstances from which physical evidence was gathered, and provide insight as to a possible train of events leading to failure. It takes the form of:
• a visit to the scene of the accident or failure
• selection of evidence for laboratory examination
• examination of ‘scene of incident’ photographs (and/or pertinent documentation) taken by bodies such as the police or factory inspectorate.
Visual observation is critical for crack detection. A human eye with 20/20 vision is able to resolve features as small as 75 μm in size at a distance of 25 cm. It is possible under perfect conditions (on a mirror-polished surface) to detect a crack with a crack opening dimension (COD) as small as 10 μm. However, the minimum detectable COD becomes much larger if the surface is rough or not perfectly clean. Surface features such as scratches and machining marks present visual ‘noise’ that will effectively mask any cracking. This is why other methods to aid crack detection are normally needed.
2.4.2 Forensic macroscopy
Forensic photography demands more than a ‘point-and-shoot’ approach to recording information. The general area in or around the vicinity of the incident is always important but it is of little use photographing the surrounding area when the clue to failure lies in one small area or a surface feature that would pass unnoticed by a non-specialist onlooker. Careful examination and photography of the fractured artefact should follow, concentrating on any relevant details on external surfaces that are visible to the eye without any magnification. The photographic record should provide information on size and condition of all pieces, and should show the relationship of any fracture to its component parts. As many pictures should be taken as is thought necessary to define and isolate key features on samples. At a later date such pictures, as an aide-memoire, may well become invaluable.
Rapid advances in digital imaging technologies have greatly improved many aspects of forensic photography. Digital imaging makes it possible to capture, edit, and output images faster than processing conventional film. It is also possible to import individual frames of video for enhancement. Techniques that used to be applied in the darkroom through trial and error can now be used on a computer, and the results are immediately visible on screen (8).
On the other hand, conventional film still preserves more data than many high resolution digital images, so is still useful for record purposes. And analysis of old photographs in cold cases is an important area of research. They can, of course, be scanned to produce digital images, and enlarged to show details of interest.
In an investigation of degraded rope used for stabilizing polytunnels used in agriculture, there were visible colour differences between a new coil and the failed polypropylene rope (Fig. 2.12). Tensile tests showed that the old rope failed at between 25% and 50% of the new samples. Closer inspection showed that fraying occurred in the outer strands, possibly by degradation induced by exposure to strong sunshine (Fig. 2.13), a conclusion that could only be tested (and confirmed) by infra-red spectroscopy. The rope had been used in South Africa where sunshine levels are generally much higher than in the UK.


2.4.3 Radiography
Use of X-rays to reveal a hidden interior to a solid object is of course well known, and can be vital during investigations as a non-destructive way of analyzing unique samples (9). Soft X-rays as used in hospitals (ca 40 keV) are the ideal source for polymer products, since they share similar densities to human flesh and bone. Since the absorption of the rays is primarily related to the atomic weight of the material, the method should distinguish the position of heavier objects within a soft matrix, or lighter objects in a heavy matrix (such as cracks).
A source of radiation is directed toward a sample, with a sheet of radio-graphic film having been previously placed behind the object (Fig. 2.14). The density of the image formed on the film is a function of the quantity of radiation transmitted through the object, which in turn is inversely proportional to the atomic weight, density and thickness of the object. A contact radiograph of an injection moulded vehicle panel containing 22% by volume of 13 mm diameter glass fibres is shown in Fig. 2.15 (a), along with a photographically enlarged radiograph of the same panel at a different point of flow (Fig. 2.15 (b)).


The same method can be used for tracing cracks, although care is needed in examining in several different sample orientations, since they can be easily missed if the cracks and beam are not exactly parallel. The method was crucial in a previous case involving gas moulded chair arms, arms with hollow interiors but of irregular shape (6).
2.5 Forensic microscopy
Simple visual examination of a failed specimen is fast, cheap and the eye has good ability to perceive both depth and colour, but resolution is limited and subjective. Higher magnification inspection is needed using microscopy.
Methods include stereo microscopy, reflected light microscopy and scanning electron microscopy (SEM). For non-metallic materials an environmental scanning electron microscope (ESEM) is essential. Samples can be examined without the need for a conductive coating to stop charging of the surfaces. One big advantage of scanning electron microscopy is that it can be combined with energy dispersive X-ray analysis (EDX) to obtain information on elemental distribution. On the other hand, sample manipulation is more difficult and all colours are lost using SEM/ESEM.
2.5.1 Optical microscopy
Reflected light microscopy is used to study the microstructure of opaque materials. Contrast in the image results from differences in reflectivity of the microstructure. The maximum magnification achievable is limited to about × 1000. For polymeric materials, thin sections can also be examined in transmitted mode with polarizing filters to give information on the forming process, provided of course that the material is not filled with an opaque reinforcement like carbon black. It is often useful, when possible, to polish and etch a section to reveal hidden details. But the method is partially destructive, so permission must be granted if the sample is unique.
By far the most useful tool, however, is stereomicroscopy. Stereo microscopes take advantage of the brain’s ability to superimpose two images from different angles and perceive spatially accurate 3D objects. In the stereomicroscope this is achieved by transmitting two images from the sample inclined by a small angle (10–12°) to yield a stereoscopic image when the sample is viewed through the eyepieces. Stereomicroscopes allow images to be obtained with excellent depth perception but limited resolution. The images can be recorded through a digital camera onto a PC (where the image is taken through a single camera and thus the 3D effect is lost). However, stereomicroscopes are essential for examining fracture surfaces in detail and have a similar advantage to visual examination in that they carry good colour information. That capability is vital in inspecting samples for trace evidence, such as smears of paint or contaminant.
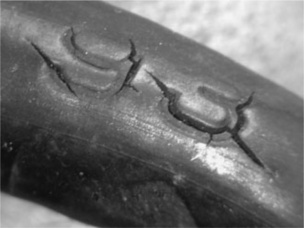
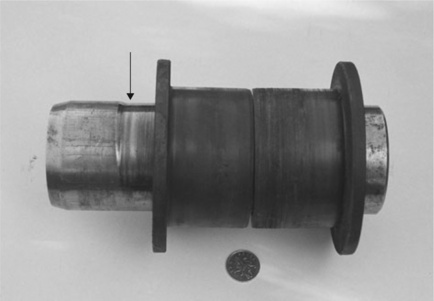
But an even less costly way of examining samples is the digital microscope. It has become common, owing to its ease of use compared with conventional microscopes. It works without conventional optics such as eye-pieces, and plugs into a computer via the USB port. The image is seen immediately on the computer screen, where it can be saved and filed. It consists of a small CCD camera with an in-built light source and works at up to about × 200, filling a gap between macroscopy using a conventional 35 mm camera, and stereomicroscopy. Figure 2.16 shows, for example, ozone cracks in a high-pressure diesel fuel pipe from a central heating boiler. The pipe sprang a leak when the deepest crack penetrated through to the bore of the textile-reinforced nitrile rubber (NBR) tube. The pipe had lasted for about 10 years before failure, and according to the maintenance engineer who replaced it in March 2009, is a very common problem. The failure was also interesting for showing how such cracks often start from stress raising features on pipes, such as logos impressed into the pipe just after manufacture (Fig. 2.17). The ozone came from switches on the controls, where sparks create the gas at very low levels. Although this failure was detected in time, when it occurs elsewhere there may be much more serious effects, such as fire if the fuel vaporises and ignites, as cases will show in later chapters. Ozone cracks can also bring production lines to a halt if seals in pneumatic systems are attacked.

2.5.2 Scanning electron microscopy
Scanning electron microscopy is widely used for examining materials because there are a wide range of signals that result from the interaction of the electron beam with the solid and the technique gives both high resolution and good depth of focus. A considerable amount of microstructural and microchemical information can be obtained; the spatial resolution is usually less than a micron and can approach 5–10 nm.
When an electron beam interacts with a solid material, a range of signals can be produced from the electron beam–specimen interaction. The signals that are most useful are secondary electrons, which give information on the topography of the material, and backscattered electrons, which give information on the composition of the material. X-rays ejected from the sample surface are characteristic of the atomic species from which they are produced. They give valuable information on the microchemistry of the surface and X-rays are often used in a forensic investigation to identity contaminants or inclusions, or simply to check whether the material has the correct composition.
One of the drawbacks of scanning electron microscopy is that generally the sample needs to be electrically conducting in order to prevent imaging artefacts from charge build-up on the specimen surface. This is a problem with non-metallic materials which are generally insulating. There are several strategies that can be used to avoid this problem. The traditional method has been to use a conductive coating of either carbon or a metal such as gold.
Gold coating can sometimes provide benefits in a surprising way. The fracture surface of the failed radiator (Fig. 2.9) was examined by breaking open the tank and was inspected using stereomicroscopy (Fig. 2.18). The tide marks produced by the leakage of cooling water can be seen very clearly on the upper free surface, but little detail in the fracture itself. After gold coating, the same surface was examined in the SEM (Fig. 2.19). The surface seemed to show a weld line at the lower edge of the fracture. When re-examined in the stereomicroscope, however, the problem became much clearer (Fig. 2.20). The highly reflective area in right centre is a ‘cold slug’ or the remnants of a granule which has not fully melted and fused, and the weld line at the base of the fracture is very clear. There are smaller remnants of such granules, and there can be no doubt that the tank was made very early in the production run. The first samples are usually flawed because the melt in the barrel of the moulding machine (Fig. 2.1) has not reached the equilibrium temperature. They should always be rejected by the operator, but for some unknown reason, one such sample entered the assembly line.


2.5.3 ESEM
An alternative approach to coating samples in conventional SEM is to use an environmental scanning electron microscope or ESEM. In this microscope differential pumping is used between the detector (which is placed under the pole piece of the final lens) and the column to prevent the gas affecting the beam in the electron column. Gas is bled into the sample chamber and is ionized by the electron beam. The gas ionization process additionally gives signal enhancement from a cascade amplification process (Fig. 2.21).

The imaging gas is usually chosen to maximize the imaging signal and therefore is commonly either air/nitrogen in low vacuum systems or water in environmental scanning electron microscopes. Care has to be taken in the use of these imaging gases with energy dispersive X-ray analysis that the gas doesn’t mask elements that are important for analysis purposes. Additionally, care must be taken to avoid introducing imaging gases that may cause degradation of the sample being examined (10).
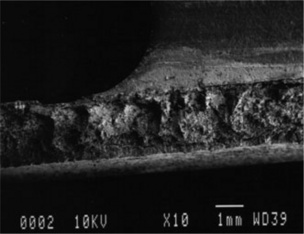
An example where ESEM becomes vital to an investigation is shown in Fig. 2.22. The fracture shown occurred on a diesel fuel pipe connection, and caused a series of accidents in Scotland, in one of which a driver was seriously injured. The fracture surface showed numerous striations typical of incremental crack growth, and they occurred over a period of days, demonstrating that the leak should have been detected before the accident. The case is discussed in a later chapter.

2.6 Types of product defect
Both design and manufacturing engineers generally operate rigorous ‘quality control’ procedures at every stage of design and manufacture. It is therefore unusual for faulty products to enter service. However, on occasion faulty goods do manage to enter service with an inherent defect.
A defect is an imperfection that renders a product unsafe for its intended use and, as suggested above, is introduced either at the design stage, or at the point of manufacture. A design defect exists when a whole class of products are inadequately planned, and often poses unreasonable risks to consumers. A car manufacturer’s design of a vehicle with the fuel tank positioned so that it explodes in low-speed collisions is defective, for example. When the design is defective, even products perfectly manufactured are defective. On the other hand, a production or manufacturing defect arises when a sound design plan is not followed and the product is improperly manufactured. Such ‘manufactured-in’ defects can be patently obvious, or of a latent nature:
• ‘Patent defects’ are defects which are plainly visible or which can be discovered by reasonable inspection or customary tests - hence the saying ‘patently obvious’. Visible surface cracking or blow holes are two examples of patent defects.
• ‘Latent (or hidden) defects’ are defects which are not plainly visible and which cannot be determined by reasonable inspection or customary tests, and which are unknown when the item is accepted. Internal voids or sub-surface cracking are examples of latent defects.
2.6.1 Mechanical defects
Mechanical failure arises from application of external forces that cause a product or component to deform, crack, or break when the yield strength of the material is exceeded. The applied force may be tensile in nature, compressive, torsional, or impact - with the force being applied over short or long time spans, and at varying temperatures and/or humidity conditions. Any engineered system or individual component can fail from application of a single overload force. Single (or traumatic) overload can produce either a ductile or a brittle fracture mode. Ductile and brittle failures are terms that simply describe the amount of macroscopic plastic deformation that preceded fracture.
A ductile failure is one where there is substantial distortion or plastic deformation of the failed part. Normally, a component will fail in a ductile manner when it plastically deforms, and the steadily reducing cross-section can no longer carry the applied service load. Ductile failure can be identified from:
• the high degree of deformation and distortion that will be present around the fracture zone
• tearing of material accompanied by appreciable gross plastic deformation and exhibit necking.
The term ‘brittle fracture’ is used when a part is overloaded and breaks with no visible distortion and little or no plastic deformation. Here, a crack will form:
In a brittle overload failure, the crack will begin at a point of maximum stress, and then grow across the section. Separation of the two halves isn’t quite instantaneous, but crack speeds are very high, approaching the speed of sound in the material. One of the results of this is that the direction of the fracture path is sometimes indicated by chevron marks that point toward the origin of the failure. The type of fracture, ductile or brittle, should be compared with the nature of the material. Brittle fractures often appear in normally ductile materials. This indicates that either the load was applied very rapidly or some change has occurred in the material, such as low temperature embrittlement or degradation, where the material will no longer act in a ductile manner (11,12).
At ambient and elevated temperatures, most materials can fail at a stress which is much lower than its ultimate strength. This group of failure modes are time-dependent, and termed creep deformation and creep rupture. More generally, materials or components undergoing continuous deformation over time under a constant load or stress are said to be creeping. Elastic, plastic, and viscoelastic deformation can all be included in the creep process, depending on the material, service temperature and time of deformation.
2.6.2 Fatigue
There is a particularly insidious mechanical failure mode that is responsible for a high proportion of in-service failure. Fatigue is the progressive, localized, and permanent structural damage that occurs when a material is subjected to cyclic or fluctuating strains under nominal stresses that have maximum values lower than the yield strength of the material. These stresses are always below the normal strength of the material, and yet will still cause catastrophic failure. Cracks are initiated at stress concentrations in the product and grow progressively until the affected part can no longer support the applied load (13).
Any tight radius can act as a stress raiser (Chapter 1), severely curtailing service lifetime of a product or device. This can be illustrated by considering a failure that overtook an upmarket, therefore expensive, vacuum cleaner. It had been in use for some eighteen months when a spring catch unexpectedly failed in a brittle way. The catch held an extension tube. A large number of this particular model of vacuum cleaner were failing prematurely, and at an identical position. The catch in question had been injection moulded in ABS, normally a tough and ductile polymer, and flexed about a tight radius each time the pipe was removed and replaced, inflicting two cycles per use. Observation of the fracture surface revealed a multi-start low-cycle fatigue failure (Fig. 2.23) that had initiated from a tight radius moulded as part of the catch profile. The intensified stress at the initiation sites induced brittle cracks which then grew slowly at each load application. The obvious solution to this failure was a simple design change – an increase in the bend radius was all that was required to alleviate the problem.

2.6.3 Friction and wear
There is a further mechanical mode that can result in premature service failure – wear. Friction is the resistance to motion between two surfaces that are forced to slide relative to each other. Frictional properties of materials in intimate contact will result in wear of surfaces when such contacts slide, impinge or oscillate relative to each other. Friction and wear are of considerable importance when considering the efficiency and/or operating lifetime of a product or component – friction will result in wasted power and generate heat, whereas any ensuing wear will lead to poor working tolerances, loss of efficiency and may ultimately lead to premature failure (14). The wear process has been defined as ‘the progressive loss of substance from the operating surface of a body occurring as a result of relative motion at that surface’. Wear is relatively gradual, with the exception of galling. Here, excessive friction between high spots will results in localized welding. Subsequent splitting creates further roughening of rubbing surfaces, accelerating the breakdown process. In contrast to outright breakage, product or machine performance may degrade slowly rather than cease suddenly, so defining a point of failure may not always be obvious. Products or components that have ostensibly failed by ‘wear’ are often encountered, and it is often necessary to establish if the rate of wear was acceptable and reflected good engineering practice or not. Fretting is a problem caused by hard particles trapped at a bearing surface and attacking the weaker of the bearing surfaces. It can produce very rapid rates of wear, sometimes with unexpected results.
A swing bridge at a marina on the south coast ceased operation when the bearings wore so severely as to stop deck movement. When extracted, the steel pins showed abnormal and localized wear, while the ultra-high molecular weight nylon 6 sleeves showed little damage. The bearings were not sealed against the environment, and salt, sand and other debris had entered, becoming embedded in nylon surfaces. The sleeves then acted as a very effective abrasion agent and wore the pins excessively (Fig. 2.24). The sleeve size was too great and correctly dimensioned parts were used to solve the problem.
Thermal failure of products can and will occur from exposure to extremely hot or extremely cold environments. At abnormally high temperatures the product may warp, twist, melt, or even burn. In addition, polymers (like most materials) tend to become brittle at low temperatures, when even the slightest load excursion may cause the product to crack or shatter. Thermal fatigue can arise when products are subjected to cyclical temperature fluctuations.
2.6.4 Environmental failure
Plastics exposed to aggressive environments are susceptible to many types of attack. Ultraviolet rays, humidity, ozone and heat are major environmental factors that seriously affect many polymers. The effect can be anywhere from simple loss of colour, slight crazing and cracking, to a complete breakdown of the polymer structure (15,16).
When ultraviolet attack occurs, the material may have a colour shift, become chalky on its surface, and/or crack. There are a number of methods to reduce this problem, such as the addition of carbon black to the polymer will usually absorb most UV radiation. Chemical inhibitors are available for most polymers, which improve the UV resistance.
Figure 2.25 shows ABS mill bobbins which were made by injection moulding flanged ends, and then solvent welding to extruded tube. They were designed to replace the original wooden bobbins. The problem lay in the solvent, methylene chloride, a very powerful organic fluid which created environmental stress cracks in the flanges. The brittle cracks were not noticed at the time and grew slowly, then when the bobbins were fully loaded on the spinning line, they suddenly broke, spewing nylon fibre across the factory floor. Multiple cracking occurred radially, and the fracture surfaces showed no signs of ductility whatsoever, a characteristic of environmental stress cracking or ESC. The polymer involved, ABS, is amorphous and especially sensitive to ESC if injection moulding was poor. There was indeed evidence of poor moulding practice, such as numerous weld lines visible in the product surfaces. It was thus likely that tools were cold, and so frozen-in strain higher than normal. High barrel temperatures could also oxidize the reinforcing butadiene particles which make ABS a tough material. Once those particles are degraded and destroyed, the polymer becomes brittle. Nowadays, such bobbins are moulded in polypropylene or HDPE to a different design, usually as a one- or two-piece product rather than three separate mouldings welded together. Snap-fit parts eliminate the need for welding.

2.7 Molecular analysis of polymer properties
Since polymers are chain molecules, measurement of molecular weight is an important aspect of characterization. However, the groups of atoms within the chain are just as important in determining polymer properties, so identifying those groups is also often critical. Spectroscopy is the main method, and there are several different and independent spectroscopic techniques (17). The extra and unusual groups introduced by oxidation can be identified in the same way, although their levels are often initially low and so care is needed in sampling and recording spectra.
2.7.1 Sampling
Taking specimens is a vital aspect of spectroscopy, and techniques like chromatography, and many different forms can be used. They include:
Thin slices can be examined directly in IR spectroscopy but material must be thin enough for the incoming IR beam to penetrate, so are normally in the range 10-100 microns. Slices can be made using a microtome, effectively a device which uses a steel blade to cut the mounted sample in a controlled and accurate way. An ultramicrotome uses a glass or diamond blade to cut even thinner slices for electron microscopy. Thin films can be cast using a suitable strong solvent such as methylene chloride (CH2Cl2) to create the polymer solution. Casting onto a ceramic tile makes a good planar film which can be removed easily, although vacuum treatment is usually essential to remove the last traces of solvent. Attenuated total reflection or ATR is a way of examining surface spectra in the infra-red, where the surface of a flexible polymer can be pressed against a single selenium crystal.
Liquid samples are routinely and easily examined by all techniques, but may not be representative of the solid material, and key information lost. The spectra must also be adjusted for that of the solvent, and makes interpretation more difficult. On the other hand, it is effectively the only route for several methods such as GPC, UV and NMR spectroscopy. Liquids are usually examined as a thin film on sodium chloride plates inserted into the IR beam, and finely divided solids can be mixed with a paraffin liquid such as Nujol to give a paste which can be smeared over the discs.
Examining solid samples is preferable for most failure studies, since variations from place to place can be more easily monitored, and thin films or sections are easy to prepare. However, cast thin films allow filler to be filtered or it settles, and the polymer can be examined alone. Fillers are usually present in commercial samples, and add to the complexity of IR spectra by obscuring large areas of absorption.
Great care is needed in sampling because it is necessarily destructive, so analysis of unique specimens may be impossible unless ATR can be used. Where large numbers of failed products are available, then sampling is usually not a problem. Varying the position of sampling can locate external exposed areas of a product where UV radiation may have affected the polymer, and then compared with internal parts which have always been in darkness. Heat affected zones in welds can be studied by careful sampling, using bulk material as the standard for comparison.
2.7.2 Chromatography
GPC, or gel permeation chromatography is unique to polymers. It is the best method for characterizing the complete molecular weight distribution of a polymer. GPC can determine several important weight parameters, including the most fundamental characteristic of a polymer – its molecular weight distribution. Weight and distribution values are of importance, as mechanical strength is directly related to molecular weight, and will influence many of the characteristic physical properties of a polymer. Subtle batch-to-batch differences in these measurable values can cause significant differences in the end-use properties of a polymer.
The technique uses a polymer solution in suitable organic solvent that is introduced into a column containing a cross-linked gel. As the solution passes down the column, the smaller chains are absorbed by the gel, leaving the longer chains to be eluted first. The smaller chains are then released, so giving a distribution curve for the sample. This is why the method is sometimes known as ‘size exclusion chromatography’ (Fig. 2.26). Since different polymers behave in different ways, each must be calibrated in the solvent chosen for analysis (often THF, tetrahydrofuran), usually using a set of monodisperse polymers. The molecular mass distribution will typically show a single peak and a tail either side. Degradation of chain length that occurs in oxidation will show as a lateral shift of the whole curve to lower molecular mass. The method was used where a polypropylene tank failed in service (18). GPC analysis showed material embrittlement when compared to virgin material and a sample taken from a tank that had not failed (Fig. 2.27).


GPC is not the only method available, however. Viscometry, osmometry and light scattering are other routes to measuring molecular weight, but are time-consuming compared with the rapid results from GPC (Table 2.1). Other forms of analysis include pyrolysis gas chromatography or PGC, where the products of thermal decomposition can be separated and examined. Since polymers have widely different ways in which they degrade when heated, the spectrum of products can be distinctive for a particular material.

2.7.3 Infra-red spectroscopy
Infrared spectroscopy is a key method for qualitative analysis of organic and many inorganic compounds. It relies on the absorption of infra-red light by molecules, while other spectroscopic methods relate to other parts of the spectrum of radiation (Fig. 2.28). The energy, E of different forms of radiation is given by the formula:

where h is Planck’s constant (= 6.626 × 10− 34 Js), v the frequency of radiation, λ the wavelength and c the velocity of light (= 299, 792 ms− 1). So the higher the frequency, the more energetic the radiation, with X-rays more energetic than visible light for example. Infra-red radiation is commonly present in sunshine and firelight, and is relatively benign compared with the more energetic UV light. The visible spectrum occurs between about 380 nm (violet) and 780 nm (red) or between 0.38 micron and 0.78 micron in wavelength (19).
FTIR (Fourier Transform Infrared) is simply a sophisticated form of spectroscopy where the thin sample can be scanned repeatedly so as to improve resolution. IR spectroscopy is used to characterize all polymers as well as solvents, pigments, fillers and additives, which is why it is so useful in polymer investigations. The method is based on the principle that interatomic vibrations absorb at specific frequencies of infra-red radiation (20). The frequency of radiation absorbed is governed by the types of bonding present, so the C–H bond stretching absorbs at a quite different frequency (ca 3000 cm− 1) to that of the bond bending at about 1500 cm− 1 (Figure 2.29).

The simplicity of the absorption spectrum of a medium density polyethylene (MDPE) cast film is shown in Figure 2.30. The spectrum is limited to the region 600 to 1700 cm− 1, so the C–H absorption peak is omitted, and the main peak near the centre at 1480 cm− 1 represents the C–C stretching mode. The peak to the right-hand side represents branch points in the linear chain where a secondary carbon bond exists, that is one where a carbon is linked to three carbon atoms rather than two. It changes the way the joint vibrates, so absorption occurs at a slightly different wavenumber. The other absorption peak of interest is that at just above 1700 cm4. The correlation table (Figure 2.29) shows it to be a carbonyl absorption peak, and it should not occur at all in MDPE. It has been formed by oxidation, which may occur by several possible mechanisms, but especially by processing at too high a temperature and/or exposure to UV radiation such as sunlight:

Such groups now represent points of weakness which can initiate chain breakage by further oxidation. Carbonyl groups can absorb UV, so scission is possible:
Each chain end has an aldehyde group which is again susceptible to further oxidation to carboxylic acid. The conventional way of protecting sensitive polymers is to use additives, especially anti-oxidants and UV absorbers, often small aromatic molecules added at a low level (1−3%) to the compound. Another, less costly, additive used to protect outdoor applications is carbon black. In most applications, carbon black in concentrations of 1% is known to protect PE from the effects of UV radiation. Figure 2.31 shows the almost identical spectrum of a sample of LDPE, a type of polyethylene made by an entirely different process. It shows a slightly lower degree of branching and oxidation, judging by the slightly lower absorption peaks at the 1400 cm− 4 position and the carbonyl wavenumber. But like the MDPE spectrum, it shows a high level of carbonyl groups, more than enough to cause serious loss of strength and cracking in the bulk materials, as will be discussed in a later chapter. It needs only a very small degree of oxidation to initiate cracking because chain cleavage affects overall molecular weight so quickly and deleteriously. The challenge for IR spectroscopy is to detect those very low levels of carbonyl groups, often masked by background noise, in a suspect polymer.

2.7.4 Fingerprint spectroscopy
But more complex polymers increase the number of absorption peaks very quickly, and it is not always possible to identify all the individual peaks. Introduction of aromatic groups, as for example in polystyrene or polycarbonate, increases the number of peaks below about 1500 cm− 1 greatly. The region below 1500 cm− 1 is often known as the fingerprint region owing to the multiplicity of peaks which can have a characteristic pattern of use in pinpointing a specific polymer or additive in a set of samples. The pattern of absorbencies can identify the basic form of polymer, using spectral libraries to pin-point a material more accurately (21). With commercial polymers, the fingerprint region is frequently obscured by fillers, but they can be removed by solvent extraction of the polymer, since most inorganic fillers like calcium carbonate, talc and carbon black are totally insoluble in organic fluids.
2.7.5 Beer-Lambert law
As the amount of light absorbed is proportional to concentration of a chemical species, this method can also be used quantitatively (19). It is done by using the Beer-Lambert law, an empirical law which relates absorption to variables like percent transmission, T, film thickness, t, concentration, c and extinction coefficient, ε:
For a single film sample, the only two variables are the transmission and concentration, so for two different groups, 1 and 2, then:
In other words, the relative peak height is directly proportional to the relative concentration. A peak which is constant throughout (such as C–H) can be chosen as the arbitrary standard, so a measure of the unknown group is possible. This provides a quick and easy way of estimating relative amounts of specific groups in a given sample. The main problem is one of drawing a common base line, because the background is often very variable, as shown by the polyethylene spectra just illustrated. So some care is needed in recording and then analysing spectra to record quantitative data.
In a recent study of oxidation in a plasticizer, polybutene, the extent of oxidation was tracked by measuring the carbonyl peak height as a function of the concentration of an added anti-oxidant when the samples were aged at a constant rate. The plasticizer is used in a new type of flexible sealant for window glazing, but needs protection against oxidation during processing.
2.7.6 UV spectroscopy
At the opposite end of the visible spectrum is the ultraviolet or UV region (Fig. 2.28). It is a much more energetic part of the spectrum of light, as may be judged by the effect of UV on skin and many polymers. Entities which absorb UV radiation include the carbonyl group, and virtually all aromatic groups (containing benzene rings and related structures). So any polymers containing such groups can be analysed using UV spectroscopy. The method is used mainly with solvent extracts, such as when checking a polymer for the presence of protective additives.
For example, a sample of polyethylene taken from a cracked PE product was finely divided and extracted with a non-solvent for the polymer, methanol or MeOH. It involved warming the solvent and polymer mixture, and then decanting the solvent. A cracked MDPE mancab was treated in the same way as a standard sample known to contain a stabilizer. The two UV spectra are compared in Fig. 2.32, the standard showing the clear trace of an aromatic additive, while the mancab exhibited very little absorption. The known additive is 2-hydroxy-4-octoxy-benzophenone, a UV absorber and protective chemical for PE. Its structure is shown in Fig. 2.33. With two benzene rings linked by a carbonyl group, the compound absorbs UV light very strongly, which is what it is meant to do for its protective action. The long side chain inhibits migration from the polymer. In general UV spectra are very simple compared with IR spectra, yielding relatively few absorption peaks (19). There are compilations of standard spectra to check attributions.


2.7.7 NMR spectroscopy
NMR is sometimes a useful analytical tool for determining the content and purity of a sample, as well as its molecular structure. It is achieved by detecting atomic nuclei with spin in molecules, by absorption at resonance (19,22). The nuclear magnetic field felt by a molecule is modified by the chemical environment (a chemical shift) so protons can be differentiated in different parts of molecules. The method is particularly valuable for polymeric investigation, enabling different stereoisomeric forms to be identified for example. The sensitivity of the technique allows ‘fingerprinting’ of unknown materials. Here, the unknown compound can either be used to match against spectral libraries or to infer the basic structure directly. Once the basic structure is known, NMR can be used to determine molecular conformation in solution as well as studying physical properties at the molecular level such as conformational exchange, phase changes, solubility, and diffusion. However, resolution is dependent on applied field strength; the stronger the magnetic field, the greater the resolution.
The method proved valuable in solving an identity problem with building plasters. A company had developed a secret ingredient for improving the viscosity response of its plaster. It was polyacrylic acid (PAA) from a particular manufacturer and was added at a level of 0.1%. It extended the period when a high viscosity is needed of the wet plaster during final application to a wall. Its repeat unit is:
and the sodium salt has the structure:
The salt form of the polyelectrolyte was normally used because of its solubility in water, and this polymer is used widely where high water absorption is needed, such as in nappies and plant mulches.
A manager at the factory left suddenly and started up making a similar product which then competed with the original plaster. The director of the first factory suspected that the new product used the same additive, and had used proprietory information when he was employed there. He sued the new company, but had to prove that the added ingredient was identical with his own. FTIR of solvent extracts from each plaster proved unequal to the task of matching the additives. The problem lay in the complexity of additives used, especially another ingredient, bone glue, present to the extent of 4%. It is a complex mixture of natural biopolymers, such as degraded protein, and effectively masked the PAA additive. But if a selective solvent to extract only the PAA could be found then the problem might be resolved. Dimethyl formamide or DMF of formula
was found to be such a selective solvent for PAA, but the IR spectra still proved of low resolution. Deuterated DMF was needed to lower spin levels, with the result shown in Fig. 2.34. The lower spectrum (at 600 MHz) shows pure PAA used by the first company, and the upper shows the DMF extract of the plaster from the second company. The major resonance peaks are identical, albeit of different intensity, but the deciding factor was the nearly identical background. The minor peaks showed that even the impurities in the PAA were identical, proving that the same source of the additive was used in each plaster (Fig. 2.35). The case did not proceed to trial but was settled out of court.


2.7.8 Other methods
A key indicator of acid or alkaline conditions is the pH, defined as:
where [H+] is the concentration of hydrogen ion, or rather the concentration of the hydroxonium ion since free protons are hydrated to form [H3O+] in aqueous solutions. Pure water has a pH of 7.0, while acids have lower values, and alkaline solutions greater values, up to pH = 14. Measurement is straightforward using an electronic pH meter with a glass electrode. Estimating pH can be useful in degradation studies where oxidation of a polymer or plasticizer occurs and produces small molecule carboxylic acids, so pH in trial oxidation studies can be used to follow degradation. It may also be essential when judging the potential for polymer hydrolysis, because the reaction normally increases with either strong acids (very low pH) or strong alkalis (high pH).
Step-growth polymers are most sensitive to hydrolysis, and include polyesters such as PET and polycarbonate, polyamides such as nylon 6,6 and polyoxides such as acetal. The latter are degraded in acid conditions (low pH), while PET and polycarbonate are hydrolyzed under alkaline conditions (high pH).
2.7.9 Thermal analysis
Thermal analysis is the application of a precision controlled temperature program that allows quantification of a change in a material’s properties with change in temperature (23). The range of thermal analysis procedures available is shown in Table 2.2. Of these methods, differential scanning calorimetry (DSC) is probably the most important. The technique measures the enthalpy of a substance while it is being heated up at a controlled and constant rate. Valuable information concerning a material’s composition and its response to temperature may be obtained. Any temperature excursion can be attributed to physical or chemical events within the sample substance, as listed in Table 2.3.
Table 2.2
| Weight changes | Energy changes | Dimensional and mechanical changes |
| Isobaric | Differential thermal analysis (DTA) | Penetration Thermal mechanical analysis (TMA) |
| Isothermal | ||
| Thermo-gravimetric analysis Derivative thermo gravimetric | Calorimetry Differential calorimetry (DSC) | Modulus Dynamic mechanical thermal analysis (DMTA) |
| Dilatometry Expansion Contraction |
Table 2.3
| (a)Physical | |
| 1st order transition | Melting Crystallization Crystal-crystal transition Liquid-crystal transition |
| 2nd order transition | Glass transition Glass transformation |
| (b) Chemical | |
| Curing Cross-linking Vulcanization Polymerization Oxidation Degradation |
Thermal analysis is one of the key routes available for characterization of polymeric materials. Differential scanning calorimetry is a technique used to examine the thermal properties of materials under carefully controlled conditions. Only milligram amounts of material are needed, so although the method is destructive, sampling is minimal. The sample is heated at a constant rate (typically 10 °C per minute), and the heat flow into or from the sample automatically recorded by the instrument. Heat is absorbed when a sample melts (an endothermic change), and the melting point (Tm) is often characteristic of the chemical composition of the material under study. The method is exceptionally useful for polymer investigation, where additional information includes the glass transition temperature (Tg, the temperature when the plastic becomes elastomeric) and the decomposition temperature, when the material decomposes. While metals and alloys melt at a sharply defined temperature, polymers melt over a range of temperatures, and that range is also sensitive to heating rate, molecular weight of the polymer, as well as changes in chemical composition (24). Figure 2.36 shows schematically the various types of information provided by DSC. Figure 2.37, for example, shows the DSC curve of polyethylene terephthalate, a polymer used widely in packaging. The polymer is crystalline, with a melting point at about 248 °C and a Tg centred at about 84 °C. In most packaging, the polymer is transparent because the crystallites are smaller than the wavelength of light.


The variable degree of crystallinity in polymers is illustrated by the behaviour of various grades of polyethylene (Fig. 2.38). The highest melting points and degrees of crystallinity are shown by HDPE, as one might expect from the greater densities shown by the material. There follow MDPEs and finally low density polyethylenes, with correspondingly lower melting points. The degree of crystallinity can be calculated from the area under the curves using an appropriate base line, with the results shown in the table (Table 2.4). Polypropylene shows a high Tm of about 176 °C, but it is commonly copolymerized with ethylene, the extent of the lowering described by the equation:
Table 2.4
Crystallization properties of polyethylenes
| Sample type | Tm °C | Crystallinity/% |
| LD | 106 | 32 |
| LD | 113 | 39 |
| MD | 115 | 44 |
| MD | 118 | 50 |
| HD | 132 | 76 |
| HD | 133 | 79 |

where T0m is the homopolymer melting point, Tm the melting point of the copolymer (both expressed in degrees Kelvin) with XE the mole fraction of ethylene units. ΔHf is the heat of fusion of the homopolymer (taken as 10.97 kJ mol− 1) and R the gas constant (= 8.314 J K− 1 mol− 1). Only a small amount of added ethylene units will lower the melting point. Thus 5 mole per cent of added ethylene lowers the melting point by about 8° to 168 °C. A similar effect occurs with the glass point, which with this copolymer is important for its resistance to freezing temperatures.
2.8 Integrity of results
Care is needed to ensure that all analytical data retain their integrity. One test for integrity is reproducibility: can another expert perform the same test and achieve the same result? It means that all experimental conditions must be recorded and published, or passed on to other experts. It is also a test worth performing on one’s own results, to check that the spectrum really is showing what it is meant to show and not an artefact. Use of automatic recording instruments demands that calibration tests are performed at regular intervals to check machine integrity. For DSC, a low melting metal, indium of known melting point of 156.6 °C is analyzed during routine calibration. A standard spectrum of polystyrene is used for the same purpose in FTIR spectroscopy, as it possesses numerous absorption peaks at known wavelengths. Internal standards such as tetramethyl silane (TMS) are routinely used in NMR to measure chemical shifts of an unknown compound. Several different techniques that measure the same quantity can also used to corroborate results independently. Many of the more recent methods can also be checked by an inter-laboratory test, where a compound of known composition is sent to each lab and analyzed blind. This has been done for GPC, and revealed frighteningly large discrepancies, showing that confidence can be put on a set of results obtained on one instrument when recorded at the same time, but comparison of results from different instruments may be dangerous.
The importance of the reproducibility test was highlighted recently during the investigation of failed electric plugs. The Noryl casings were cracking and exposing live wires to the fingers of the user, making the manufacturer directly liable for any injuries. The plugs in question had been moulded at a factory in China, and it was our opinion that the process itself had caused widespread cracking of the transformer plugs. However, a forensic group in Japan disputed our conclusion. They claimed that too much fire retardant had been added to one batch of the material in Europe, so weakening the moulded plug casing. They based their conclusions on alcoholic extracts of the plugs analyzed using FTIR. When we analyzed the same plugs using SEM-EDX (a method quite independent of FTIR), we could not corroborate their findings, and requested checks on their method. We never received their experimental details, and the original conclusion of faulty moulding was finally accepted. Quality checks in the factory have been improved to prevent a re-occurrence of the problem.
When unique polymer samples are collected, the need for preservation is paramount. All samples should be protected using polyethylene bags, and for fragile specimens, stored in the dark at a low temperature, such as in a refrigerator. Handling should be minimal, preferably using plastic gloves to prevent contamination from sweat, especially if EDX is used for elemental analysis.
The same general principles apply to all the techniques of analysis and inspection described in this chapter, and if not applied rigorously, can lead to the kind of ambiguity and contradiction which led to the dispute in the first place. Although lawyers will often want the bare minimum of testing to be undertaken in a dispute, they do not have to appear in a witness box to defend their results.
2.9 Conclusions
There are several points to make concerning failures of engineered products. First, it is surprising how much can be gleaned from the material evidence of failure, especially when linked to witness or other documentary evidence. In effect, the investigator will try to explain the failure by sifting the evidence carefully so as to reveal key or critical parts that show how the incident occurred. On many occasions, this may be limited to a bundle of documentary evidence, where the expert will be required to ‘tease-out’ relevant information on the matter in hand. Fracture surfaces are very revealing if preserved intact. Every so often, the microstructure of a small particle will reveal its origin, and hence allow a sequence of events to be constructed. Often the sifting process will be long and painstaking (particularly when a large and complex device, such as an aircraft, fails), but at other times it may be the speed of reaction to unfolding events which solves the problem in hand. Thus a photograph taken ‘just in time’ can short-circuit an investigation, particularly when the evidence is deliberately removed or tampered with at a later time.
Secondly, there is no doubt that experience and a working knowledge of typical failure modes of products can help elucidate the problem. To recognize how a component or system failed, an understanding of how it works (and was manufactured) in the first place is essential. Reverse engineering of a product can help failure investigation. By stepping back through the transformation stages, the investigator will then be in a better position to determine most probable or expected point of failure within a component or system. This is ‘the weakest link’ principle in action (as described in Chapter 1). Then when it shows abnormal features, another cause of the failure must be sought. Although there are many possible experimental techniques which may be used with polymers, most investigations quickly reduce to a handful of methods. Preeminent among them is microscopy of failed surfaces, optical followed by ESEM, together with DSC and FTIR spectroscopy.
Although the cost of any failure investigation increases as the complexity and depth of analysis become more sophisticated, the resultant benefit will be a far more complete recognition of the true origins of demise. However the concept of ‘cost’ should not be limited to the ‘monetary’ value of the investigation. A wider view should be taken that will encompass any business aspects associated with the failure in question. Consumers expect higher cost products to translate into higher quality goods that have a lower failure rate and longer lifespan than that of lower cost equivalents. This will apply to components and materials alike. When components and materials fail to meet stated performance specifications or service requirements, the consequences can be loss of manufacturing time and customer business. In general, lost business revenue will far outweigh costs of investigation. Moreover, any failure occurring in-service may have legal ramifications (possible litigation) in addition to business implications (loss of customer goodwill), along with potential loss of company reputation.
The choice of methods controls investigative cost, with some far exceeding others. NMR, for example, is always more expensive than FTIR, which in turn is greater than optical microscopy or simple macroscopy. Many reports referred to us for a second opinion have often used the right methods but ignored failure modes to which polymers are particularly susceptible, especially ESC and SCC. Others are biased to the client, never a way of solving problems. The costs of those reports are wasted, which is often why second opinions are sought.
Society is always looking for someone to ‘blame’ for any misadventure, and is far more eager to undertake litigation as a process to redress any perceived loss, damage or injury associated with failure of a product. Rapid and effective use of appropriate failure analysis at the outset of investigation can short circuit potential market place pitfalls, thus facilitating positive customer retention along with continued company growth. However, it is vital that appropriate expertise is tapped, especially in specialist areas like polymers. Although many forensic engineers will claim expertise in metal failures, it may not qualify them for examining polymer failures, where the basic failure modes vary significantly from those of metals.
2.10 References
(1) Cracknell, P., Dyson, R., Handbook of thermoplastic injection mould design, Chapman and Hall, 1993.
(2) Maier, C., Advances in Injection Moulding Technology, RAPRA Review reports No 72, 1994.
(3) Crawford, R.J., Plastics Engineering, Butterworth-Heinemann, 3rd edn, 1998.
(4) Mills, N., Plastics: Microstructure and Engineering Applications, Edward Arnold, 2nd edn, 1993.
(5) , International Encyclopedia of CompositesLee S.M., ed. VCH Publishers, 1991.
(6) Lewis, Rhys, Peter, Reynolds, Ken, Gagg, Colin, Forensic Materials Engineering: Case Studies. CRC Press. 2003.
(7) Holister, G., Experimental Stress Analysis, Cambridge University Press, 1967.
(8) Blitzer, H.L., Jacobia, J., Forensic digital imaging and photography, Academic Press, 2002.
(9) Halmshaw, R., Non-Destructive Testing, Edward Arnold, 2nd edn, 1991.
(10) Kitching, S., Donald, A.M. Beam damage of polypropylene in the environmental scanning microscope: an FTIR study. Journal of Microscopy. 1998; 190:357–365.
(11) Andrews, E.H., Fracture in Polymers, Oliver and Boyd, 1968.
(12) Williams, J.G., Stress Analysis of Polymers, Longman, 1973.
(13) Hertzberg, R.W., Fatigue in Polymers, John Wiley, 1988.
(14) Bowden, F.P., Tabor, D., Friction and Lubrication of Solids, CUP, 1995.
(15) Wright, David, Failure of Rubber and Plastic Products, RAPRA, 2001.
(16) Ezrin, M., Plastics Failure Guide, Hanser-SPE, 1996.
(17) Crompton, T.R., Characterisation of Polymers, Smithers RAPRA, 2008.
(18) Erzin, M., Lavigne, G., Dudley, M., Pinatti, L. Case studies of plastics failure related to molecular weight or chemical composition. ANTEC. 2005; 2005:3469–3474.
(19) Dodd, R.E., Chemical Spectroscopy, Elsevier (1962); Pavia, DL, Lampman and Kriz, GS, Introduction to Spectroscopy, 3rd edn, Thomson, 2000.
(20) Conley, R.T. Infra-red Spectroscopy, 2nd edn, Allyn and Bacon (1975); Günzler H and Gremlich HU. An Introduction, Wiley: IR Spectroscopy; 2002.
(21) Hummel, D.O., Polymer and Plastics Analysis, 2nd edn, Hanser Verlag, 1978.
(22) Günther, H., NMR Spectroscopy: Basic Principles, Concepts, and Applications in Chemistry, 2nd edn, WileyBlackwell, 1995.
(23) Wunderlich, B., Thermal Analysis of Polymeric Materials, Springer, 2005.
(24) Brydson, J., Plastics Materials, 7th edn, Butterworth, 1997.