Chapter 17. Trace BIFs, the dbg Tracer, and Match Specifications
Any respectable programming language that has deployments consisting of millions of lines of code running in thousands of installations worldwide must provide built-in low-level tracing mechanisms on which to build tools that can be used for live troubleshooting. Languages that don’t provide these tools put a huge burden on developers and support engineers alike, as they have to either develop this infrastructure from scratch themselves or troubleshoot their systems in a black-box environment.
In Erlang, Ericsson’s experiences of tracing live telephony switches are reflected in the trace BIFs, which, from being part of the first version of the language, have evolved through the years to become the foundation for a set of tools that give full visibility to the changing state of the system and, as a result, drastically reduce bug resolution times and troubleshooting efforts.
Introduction
Imagine you receive a bug report from a live system, where you get
a badmatch error when
pattern matching the result of the call ets:lookup(msgQ, MsgId).
You expect your program to pattern-match on an atom denoting a message
type, but instead it terminates when coming across the tuple {error, unknown_msg}.
You can quickly establish that the database got corrupted and set
about trying to find the ets:insert/2
call that wrote the entry into the ETS table. As messages entering the
system are tested at the system boundary, this message should not have
made it as far as the insert call. You
could add a case statement ensuring
that the error tuple is never inserted in the table, but this would be
considered defensive programming, as this message was either tagged
incorrectly or should not have made it this far into the system in the
first place. Not only that, but you also do not know which
particular ets:insert/2 call caused the problem.
In large systems, you would expect to find quite a few of them.
In a huge and complex system, without any knowledge of the module in
which the entry was corrupted, you would have to find the tuple {error, unknown_msg}, potentially having to
search through millions of lines of code. Once you found the tuple,
inserting an io:format/2 statement that prints the error and process information
would not solve the problem, as in live systems, processes come and go and
millions of entries are inserted and deleted from ETS tables each hour. In
addition, because this is a live system with strict revision control, code
changes must be tested and approved before being deployed. This option,
even if it’s tempting, would result in a slow turnaround time. Don’t get
wound up on release procedures and slow turnaround times from the quality
assurance team, however, as you can do better!
In Erlang, the first thing a developer or support engineer would
consider doing is to turn on the trace facility for all calls to the
ets:insert/2 function. You can trace
both local and global calls—that is, calls to functions in the same module
and in other modules—without having to trace-compile (i.e., recompile) the
code. The trace events can include the function
call itself, its arguments, its result, its calling function, and a
timestamp. When tracing is enabled, you can generate a trace event every
time the traced function is called. This trace event is either printed in
the shell or piped to a socket where a program at the other end receives
it, formats it, and stores it in a readable logfile.
But you still have a problem, because in a live system, millions of
calls are made to ets:insert/2 every
hour. Millions of trace messages would give you lots of unnecessary
information and would probably affect performance. You are interested in
trace events only if the second argument, the message type, is invalid.
So, what do you do? You implement a match specification that, for every
call, will inspect the parameters passed to it. You write the
specification in such a way that you generate a trace event only if your
parameter inspection comes across the tuple {error, unknown_msg} instead of a valid message
type. In this trace event, you ensure that the calling
function is displayed, giving you the function where the
ets:insert/2 call originated. You can
then start tracing this calling function and inspecting its arguments,
finding the final clue to the origin of the invalid message, and as a
result, locating the bug. What is more, you can do all of this in a live
system where thousands of simultaneous transactions are being concurrently
executed, without affecting the performance and without having to
recompile the code.
If this sounds too good to be true, keep reading. Inspecting arguments in local and global calls, turning process traces on and off based on very specific triggers, and having full visibility over process state changes is possible with no extra effort on behalf of the developer. In Erlang, you achieve these results by using the dbg tracer tool, a user-friendly encapsulation of the trace BIFs and match specifications. This is another example of simple but powerful and well-thought-out constructs that reduce development and support efforts and bug turnaround times.
The first section of this chapter covers the low-level trace BIFs, as well as the message-based foundation for tracing in Erlang. This is followed by an introduction to the dbg tracer tool built on the BIFs; although this is probably the tool you will use, the first section will introduce you to the way in which tracing works in Erlang, as well as the terminology used in tracing.
The Trace BIFs
The built-in function erlang:trace/3
enables and disables the
low-level trace mechanisms in the Erlang runtime system. It provides you
with a means to monitor concurrency, code execution, and memory usage.
Tools such as the debugger and the process manager use this BIF to collect
and display trace events. You prefix the BIF with the name of the erlang module that contains it, as it is not
autoimported.
The beauty of the trace BIF is that you can use it without having to trace-compile the code. You can use it in live systems, resulting in an incredibly powerful troubleshooting tool that gives full visibility of what is going on.
Trace events are sent as messages of the following format:
{trace, Pid, Tag, Data1 [,Data2]}where [,Data2] denotes an
optional field dependent on the trace message type. Trace events that are
generated include the following:
Global and local function calls
Garbage collection and memory usage
Process-related activities and message passing
At any one time, only one process may receive trace events from another process. This is known as the tracer process. The tracer process that receives the trace events is the one that made the call to:
erlang:trace(PidSpec, Bool, TraceFlags).
In this call, PidSpec defines
which processes you want to trace. It is either a process identifier or
one of the atoms existing, new, or all:
The
existingatom enables tracing for all existing processes, but will exclude the tracer process and any process spawned after the call.If you pass
new, the call will trace all processes spawned after the trace BIF call.The
allatom will instead trace all processes created before and after the trace call, excluding the tracer process itself.
Calling erlang:trace(self(), Bool,
TraceFlags) generates a bad argument error, as the tracer
process cannot be traced. The reason the process receiving the trace
messages cannot be traced is to avoid infinite cyclic loops. Imagine you
are tracing received messages. Every time your process receives a message,
a trace message will be generated, resulting in yet another trace message.
Moreover, this will happen at a rate that no program would be able to
handle.
If you want a process other than the one calling the trace/3 BIF to receive the trace events, you
pass the {tracer, Pid} tuple as an
element in the TraceFlags list (which
we’ll described shortly). In this tuple, Pid has to be a process or port
identifier.
The second argument to the trace BIF is the atom true or false, specifying whether you want to enable or
disable particular aspects of your tracing. These are described by a list
of trace flags, denoted by atoms[40] and used to specify which trace events you want to generate
or suppress, according to the Boolean value of the second argument:
true to generate and false to suppress. We describe the trace flags
in detail in subsequent sections. The return value of the erlang:trace/3 call is an integer denoting the
number of traced processes.
Process Trace Flags
The send flag traces all messages sent by a process, and 'receive' generates events when messages are
added to the mailbox of the traced process. Because receive is a reserved word in Erlang, you must
enclose it in single quotes, thus generating an atom. Setting
the send or 'receive' flag to true generates the following trace
events:
{trace, Pid, send, Message, To}
{trace, Pid, send_to_non_existing_process, Message, To}
{trace, Pid, 'receive', Message}
By now, you must be itching to try the trace BIF in the shell. In the following sections, we will use this program as an example:
-module(ping).
-export([start/0, send/1, loop/0]).

start() -> spawn_link(ping, loop, []).

send(Pid) ->
  Pid ! {self(), ping},
  receive  pong -> pong end.

loop() ->
 receive
   {Pid, ping} ->
      spawn(crash, do_not_exist, []),
      Pid ! pong,
      loop()
  end.
The start function spawns
a child process that waits in a receive-evaluate loop. Upon receiving a
ping message, sent as a result of the ping:send/1 call, the
child process spawns a new process that immediately terminates
abnormally, as the module in which it should be executing does not
exist.
This abnormal termination will result in a crash report being
printed. (Remember, spawning a process never fails.[41] Instead, what fails is the newly spawned process, as the
function it is supposed to execute is undefined.) Finally, the child
process responds to the message by sending a pong message back. It is
received in the ping:send/1 call and
is returned as a result of that function.
Running the preceding example in the shell and turning on tracing
of all send and receive events, we get:
1>Pid = ping:start().<0.55.0> 2>erlang:trace(Pid, true, [send, 'receive']).1 3>ping:send(Pid).pong =ERROR REPORT==== 6-Sep-2008::19:16:00 === Error in process <0.40.0> with exit value: {undef,[{crash,do_not_exist,[]}]} 4>flush().Shell got {trace,<0.55.0>,'receive',{<0.39.0>,ping}} Shell got {trace,<0.55.0>,send,pong,<0.39.0>} ok 5>erlang:trace(Pid, false, [send, 'receive']).1
Note how commands 2 and 5 return the integer 1, namely the number of processes that are
being traced. You can set trace flags on processes at any time, either
before they are created, using the all or new
flag, or after they have been created, using the all or existing flag or the flag’s process identifier. And, as the trace
messages are being sent to the shell process, which is the process that
executed the trace/3 call, you can
retrieve them using the flush/0 shell
command.
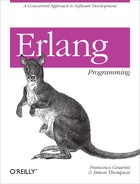
At any particular time, a process can be in one of three states
(see Figure 17-1). It could be
running code, it could be
suspended waiting for its turn to execute, or it
could be in a receive clause,
waiting for a message to arrive. A process is said
to be preempted when its state changes from running
to suspended, and scheduled when it is moved from
the suspended queue ready to execute.
By enabling the running flag, you can
trace state transfers of the module, function, and arity as well as the
pid of the process from when it started running (in) to when it stops running (out). The trace events generated always come
in pairs, and are of the following format:
{trace, Pid, in, {M, F, Arity}}
{trace, Pid, out, {M, F, Arity}}Pman, the process manager, uses the procs flag to trace
process-related events, such as process spawning and termination,
process linking, and registration. The trace events generated by the
procs flag include the
following:
{trace, Pid, spawn, Pid2, {M, F, Args}}
{trace, Pid, exit, Reason}
{trace, Pid, link | unlink, Pid2}
{trace, Pid, getting_linked | getting_unlinked, Pid2}
{trace, Pid, register | unregister, Pid2}

Function calls can be traced using the call flag; we discuss
this in more detail in the section Tracing Calls with the trace_pattern BIF.
Inheritance Flags
Use of the set_on_spawn
flag specifies that any child process will inherit the flags of
its parent, including the set_on_spawn flag itself (see Figure 17-2). As a result, any
process spawned by the child process will also inherit all of the flags
of the child. If instead you use the set_on_first_spawn
flag, you specify that any process that is spawned will inherit the
flags of its parents except the set_on_first_spawn flag. Any process the child
will spawn will therefore not inherit the flags. In
other words, set_on_spawn is
transitive, whereas set_on_first_spawn is not.
Let’s use the ping example to see the set_on_spawn and procs flags in action. Sending the ping
message to the process spawns a child that terminates immediately. The
tracing process should receive the spawn trace event from the first
process and the exit message with the undef runtime error from the second
process:
1>Pid = ping:start().<0.31.0> 2>erlang:trace(Pid, true, [set_on_spawn, procs]).1 3>ping:send(Pid).pong =ERROR REPORT==== 6-Sep-2008::19:50:33 === Error in process <0.40.0> with exit value: {undef,[{crash,do_not_exist,[]}]} 4>flush().Shell got {trace,<0.31.0>,spawn,<0.34.0>,{crash,do_not_exist,[]}} Shell got {trace,<0.34.0>,exit,{undef,[{crash,do_not_exist,[]}]}} ok
The set_on_link and
set_on_first_link trace flags are
similar to the set_on_spawn flag, but
instead they control the flags that are inherited when linking takes
place.
Garbage Collection and Timestamps
Memory usage and the amount of time spent garbage collecting are notoriously tricky to predict. The Erlang system uses a generational garbage collection mechanism, described in Chapter 2. The collector has two generations of data: “current” and “old.” Current data that survives a garbage collection will become old. The premise behind this approach is that much of the data stored in the heap is short-lived and will not survive to the first garbage collection, whereas data that survives its first collection tends to be much longer-lived. It therefore makes sense to garbage-collect in the current data more frequently than in the old data.
Using the garbage_collection
flag, you can receive trace events relating to garbage collection
initiation and termination. The events produced are of the following
format:
{trace, Pid, gc_start, Info}
{trace, Pid, gc_end, Info}
where Info is a list of tagged
tuples containing the following:
heap_sizeThe used part of the current heap
heap_block_sizeThe size of the memory block used to store the heap and the stack
old_heap_sizeThe used part of the old heap
old_heap_block_sizeThe size of the memory block used to store the old heap
stack_sizeThe actual stack size
recent_sizeThe size of the data that survived the previous garbage collection
mbuf_sizeThe message buffer (or mailbox) size
All heap and message buffer sizes provided in the tagged tuples are in words.[42]
Now, what should you do if you want to calculate the time spent
garbage collecting, or if you want to have an accurate record of exactly
when a specific trace event is generated? You should use the timestamp flag, which
will add a timestamp to all messages. The format is the same as the one
returned by the BIF now(), namely {MegaSeconds, Seconds,
Microseconds} passed since January 1, 1970. All trace
messages will now have the trace_ts
tag and will contain an extra field at the end containing the
timestamp:
1>Pid = ping:start().<0.31.0> 2>erlang:trace(Pid, true, [garbage_collection, timestamp]).1 3>ping:send(Pid).Pong =ERROR REPORT==== 6-Sep-2008::20:30:41 === Error in process <0.40.0> with exit value: {undef,[{crash,do_not_exist,[]}]} 4>flush().Shell got {trace_ts,<0.31.0>, gc_start, [{mbuf_size,0},{recent_size,0},{stack_size,2},{old_heap_size,0}, {heap_size,231}],{998,578633,990000}} Shell got {trace_ts,<0.31.0>, gc_end, [{mbuf_size,0}, {recent_size,228},{stack_size,2},{old_heap_size,0}, {heap_size,228}],{998,578633,990001}}
The flag cpu_timestamp makes
all trace timestamps relative to the CPU time, not the wall clock. To
use this flag, the target machine needs to support high-resolution CPU
measurements and the Pid argument to
the trace BIF must be all.
Tracing Calls with the trace_pattern BIF
You use the erlang:trace_pattern/3
BIF to enable tracing of local and global function calls. You must use
this BIF in conjunction with the erlang:trace/3 BIF,
called with the call and return_to flags. Tracing will be enabled on the
intersection of the sets created through the calls to
the two trace BIFs (see Figure 17-3). Using trace/3, you define which processes you want to
monitor. Using trace_pattern/3, you
define the subset of functions you are tracing. An event will be generated
only if a traced process executes a
traced function.
The trace messages generated by the intersection of these two BIFs will be of the following form:
{trace, Pid, call, {M, F, Args}}
{trace, Pid, return_to, {M, F, Args}}
where call is generated when the
function F in module M with argument Args is called. The return_to event is generated when the call
returns and the execution of the function is completed. When tracing
recursive calls, the return_to event is
sent only when the recursive base case has been reached, and not for every
iteration of the function. You can use the return_to flag only in conjunction with the
call flag.
Using the arity flag in
conjunction with the call flag, all
event tags containing an {M, F, Args}
tuple will instead return function arity information, {M, F, Arity}. This is useful if you are not
interested in the arguments passed to a function and you want to minimize
the size of the messages passed as a result of the call trace.

When calling:
erlang:trace_pattern(MFA, Condition, FlagList)
you define the functions you want to trace in the first argument,
where you specify the module, function, and arity of the calls you want to
result in a trace event. The MFA format
is one of the following:
{Module, Function, Arity}
{Module, Function, '_'}
{Module, '_', '_'}
{'_', '_', '_'}
Wildcards are allowed using the '_'
atom, so using {Module, '_', '_'}
will enable the tracing of all calls of
all arities defined in Module. Wildcards need to follow the preceding
pattern, however; combinations of the type {'_', Function, '_'} are not allowed. The modules we are passing
to erlang:trace_pattern/3 have to be
loaded before the BIF is called. Recompiling your code or reloading the
module after having set the flags will clear the trace patterns. You need
to rerun the trace command BIFs to reenable the tracing.
The Condition further controls
the tracing. It can take a Boolean value: passing true will enable tracing of
all functions defined in MFA, whereas
false will disable
it. You can also pass a match specification, the same
ugly but extremely powerful terms describing a simple program that we
discussed in Chapter 10. We will look at them
in more detail in the section Match Specifications: The fun Syntax.
Finally, the FlagList defines the
type of traced function, further filtering what has been defined in
MFA. Passing global traces only exported functions, whereas
local traces both exported and
nonexported calls.
The visibility of your systems gained through these extremely
powerful BIFs greatly reduces the time spent troubleshooting, making the
turnaround time for patches very short when comparing Erlang to other
programming languages. Are you curious and want to experiment with trace
function calls from within the shell? Let’s look at an example and
experiment with the possible range of values you can pass to the BIFs.
When doing so, do not forget to prefix the BIF calls with the erlang module name. Let’s go back to the ping example, explained
in the section Inheritance Flags:
1>l(ping).{module,ping} 2>erlang:trace(all, true, [call]).25 3>erlang:trace_pattern({ping, '_', '_'}, true, [local]).5 4>Pid = ping:start().<0.120.0> 5>ping:send(Pid).pong =ERROR REPORT==== 4-Apr-2009::19:33:25 === Error in process <0.122.0> with exit value: {undef,[{crash,do_not_exist,[]}]} 6>flush().Shell got {trace,<0.120.0>,call,{ping,loop,[]}} Shell got {trace,<0.120.0>,call,{ping,loop,[]}} ok
In this example, we are tracing all function calls made within all
processes. We intersect them with all local function
calls in the module ping. Remember, this
option contains local and nonlocal calls. To understand the calls that we
see, let’s number the lines in the ping.erl module:
1 -module(ping).
2 -export([start/0, send/1, loop/0]).
3
4 start() -> spawn_link(ping, loop, []).
5
6 send(Pid) ->
7   Pid ! {self(), ping},
8   receive  pong -> pong end.
9
10 loop() ->
11   receive
12     {Pid, ping} ->
13       spawn(crash, do_not_exist, []),
14       Pid ! pong,
15       loop()
16   end.
The functions we are tracing will be start/0, send/1, and loop/0; there are other function calls in the
module (e.g., spawn_link/3 on line 4,
self/0 on line 7), but these are calls
to functions that are not defined in the ping module.
What is the effect of calling ping:start()? This
starts a process with pid Pid that will
execute loop/0, giving us the first
call to a function in the traced module, resulting in the first trace
message seen as a result of the flush()
in command 6. This call is global, as it is called from outside the module
as a result of the spawn/3 BIF.
When we then call send(Pid), the
code on line 7 sends a message to Pid
(which, incidentally, contains a call to self/0), and this message is handled in the body
of the loop/0. After receiving the message, it
calls spawn/3 and finally loop/0 on line 15. Calling loop/0 is a local call which gives rise to the
second trace message found when the flush() was executed.
What would you expect the global calls to be,
if you do the same trace but replace local with global in command 3, as shown here?
erlang:trace_pattern({ping, '_', '_'}, true, [global]).Running the same tests gives you a trace message, namely the one
generated as a result of the spawn/3
BIF. But if you are tracing all global calls in all processes, why did
ping:send/1 not generate a trace event?
It is, after all, a global call. The reason is that the process
receiving the trace messages cannot be traced. If you want to
generate trace events for the process calling the trace BIF, you have to
redirect these messages to another process. You do so by passing the
{tracer, Pid} option to the trace/3 BIF, specifying the pid of the process
you want to send the messages to.
The dbg Tracer
You probably realize that although the trace BIFs are extremely powerful and handy, they are also very low-level and are not very user-friendly. After all, they are there to provide a base on which to build other tools such as the dbg tracer.
The dbg tracer is a text-based debugger providing a user-friendly interface to
the trace and trace_pattern BIFs, but using the tracing
principles and mechanisms introduced in the preceding section. You can use
the dbg tool as a complement to the process manager we discussed in the
section The Process Manager in Chapter 4,
especially when you are tracing on text-based terminals and do not have
access to the display or you have to divert the output. The dbg tool has a
small impact on system performance, making it a suitable candidate for
tracing large live systems.
Getting Started with dbg
The dbg:h() call provides
you with a list of helpful functions; to find out more details about any
of these functions, you can pass their names to dbg:h/1. The last thing you want to do when
under pressure debugging a live system after a support call in the
middle of the night is to have to look at the Erlang manual pages. The
help function always comes in handy:
1>dbg:h().The following help items are available: p, c - Set trace flags for processes tp, tpl, ctp, ctpl, ctpg, ltp, dtp, wtp, rtp - Manipulate trace patterns for functions n, cn, ln - Add/remove traced nodes. tracer, trace_port, trace_client, get_tracer, stop, stop_clear - Manipulate tracer process/port i - Info call dbg:h(Item) for brief help a brief description of one of the items above. ok 2>dbg:h(p).p(Item) -> {ok, MatchDesc} | {error, term()} - Traces messages to and from Item. p(Item, Flags) -> {ok, MatchDesc} | {error, term()} - Traces Item according to Flags. Flags can be one of s,r,m,c,p,sos,sol,sofs, sofl,all,clear or any flag accepted by erlang:trace/3 ok
The call dbg:p(PidSpec,
TraceFlags) allows you to specify which processes you want to
trace and which trace events you want them to generate. PidSpec can be one of the following:
PidA particular process ID.
allWill trace all processes, spawned before or after the call to the debugger.
newWill trace all processes spawned after the call to the debugger.
existingWill trace all processes existing before the call to the debugger.
AliasA registered process alias other than
all,new, orexisting.{X,Y,Z}Denotes the process represented by the process ID
<X.Y.Z>."<X.Y.Z>"can also be used; it is the result of thepid_to_list/1BIF.
TraceFlags is a single atom or
a list of flags. You can pass any flag accepted by the trace BIFs
alongside the following flag abbreviations and aggregations:
sTraces sent messages
rTraces received messages
mTraces sent and received messages
pTraces process-related events
cTraces global and local calls according to the trace patterns set in the
dbg:tp/2callsosandsofsDenote the
set_on_spawnandset_on_first_spawnflags, which we described in the section Inheritance FlagssolandsoflDenote the
set_on_linkandset_on_first_linkflags, which we described in the section Inheritance FlagsallSets all flags
clearClears all set trace flags
You must once again be itching to try out the dbg tracer and
generate trace events. In the following example, we will trace all
message-related events from the ping module that we introduced in Inheritance Flags.
We start our ping process and a separate tracer process. The
tracer process will receive and display all of the trace events,
including those generated in the shell. In command 5, we enable the
trace events for all messages sent and received by the ping process
after which we call the ping:send/1 function.
In the trace printouts that follow, you can see that upon sending a ping
message, the shell process has sent a pong message back in
return:
3>Pid = ping:start().<0.41.0> 4>dbg:tracer().{ok,<0.43.0>} 5>dbg:p(Pid, m).{ok,[{matched,nonode@nohost,1}]} 6>ping:send(Pid).pong (<0.41.0>) << {<0.29.0>,ping} 7> (<0.41.0>) <0.29.0> ! pong 7> =ERROR REPORT==== 6-Sep-2008::21:40:31 === Error in process <0.47.0> with exit value: {undef,[{crash,do_not_exist,[]}]} 7>dbg:stop().ok
You can see from the trace printout right after command 6 that the
process within the parentheses is where the trace event originated.
Process <0.41.0> receives the
message {<0.29.0>, ping},
denoted in the trace by the <<
symbols, and responds by sending the message pong to process <0.29.0>.
Use this example to experiment with various trace flags, and while
doing so, note how the tracer has to be started and stopped. Are the
flags you set in dbg:p/2
automatically cleared when you stop the tracer using dbg:stop()?
Using the same ping process,
let’s now trace all process-related activities using the set_on_spawn flag. Because of this, the
process <0.55.0> inherits all
of the flags, and as a result, it generates the exit trace event:
8>dbg:tracer().{ok,<0.51.0>} 9>dbg:p(Pid, [p, sos]).{ok,[{matched,nonode@nohost,1}]} 10>ping:send(Pid).pong (<0.41.0>) spawn <0.55.0> as crash:do_not_exist() =ERROR REPORT==== 6-Sep-2008::21:43:26 === Error in process <0.55.0> with exit value: {undef,[{crash,do_not_exist,[]}]} (<0.55.0>) exit {undef,[{crash,do_not_exist,[]}]} {ok,[{matched,nonode@nohost,1}]} 11>dbg:stop().ok
Note that in both of the preceding examples, no trace information
is logged regarding activities of the tracer process itself. And, if you
have not figured it out, dbg:stop/0
will not clear the trace flags. For this purpose, use dbg:stop_clear/0.
Tracing and Profiling Functions
The function dbg:c(Mod, Fun, Args,
TraceFlags) is ideal for trace and profile functions executed
from the shell. If the TraceFlags
argument is omitted, all flags are set. In the
example that follows, we trace all activity related to an io:format/1 call, in
this case, io:format("hello~n").
This tracing shows the inner workings of the input/output
mechanism, under which messages are sent to the group leader. The
calling process is suspended when it goes into a receive statement, and the process is
scheduled as soon as a response from the group leader returns:
1> dbg:c(io, format, ["Hello World~n"]).
Hello World
(<0.53.0>) <0.23.0> ! {io_request,<0.53.0>,<0.23.0>,
                          {put_chars,io_lib,format,["Hello World~n",[]]}}
(<0.53.0>) out {io,wait_io_mon_reply,2}
(<0.53.0>) << {io_reply,<0.23.0>,ok}
(<0.53.0>) in {io,wait_io_mon_reply,2}
(<0.53.0>) << timeout
ok
Using dbg:c/3 is ideal if you
want to monitor memory usage and time spent garbage collecting in a
particular function, as it isolates the call in a single process. It is
not the best way to trace side effects using the set_on_link and set_on_spawn flags, as all flags are cleared
as soon as the function returns.
Tracing Local and Global Function Calls
So far, so good, but one of the really powerful features of the trace
BIFs, and probably the one used most often is the ability to generate
trace events for local and global function calls. In the dbg module, you use the following to enable
the trace for global calls:
dbg:tp({Mod, Fun, Arity}, MatchSpec)And you use this for local calls:
dbg:tpl({Mod, Fun, Arity}, MatchSpec)You use these in conjunction with the dbg:p/2 call, where you specify the traced
process together with the c flag. The
trace events generated through the intersection of the two sets are the
same as those described in the section Tracing Calls with the trace_pattern BIF.
Just as for the trace BIFs, you can define Module, Function, and Arity as '_', where formats of the type {'_', Function,'_'}, in which a wildcard comes
before a nonwildcard, are not allowed. We will cover match
specifications with dbg soon, but for
the time being, we will use [].
The return value of tp/2 and
tpl/2 has the format {ok, Matches}, where Matches is a list of tuples reporting the
Erlang nodes on which the trace was enabled and the number of functions
for which the trace was turned on at each node.
Call tracing is disabled using dbg:ctp({Mod, Fun,
Arity}). Calling this function will disable function tracing
regardless of whether the calls are local or global. This is the call
you will probably be using most of the time. Should you want to disable
the trace on only a particular global call pattern set with dbg:tp/2, however, use dbg:ctpg({Mod, Fun,
Arity}); local traces are disabled using dbg:ctpl({Mod, Fun,
Arity}).
All of the calls used to enable and disable function tracing
return a tuple of the format {error,
Reason} or {ok,
MatchDescription}. MatchDescription is a list of tuples of the
form {matched, Node, Number}, where
Number denotes how many function
calls were enabled or disabled on the particular Node. You can clearly see this in the
following example.
Also note how we are now receiving trace events generated in the
shell. In the examples using the trace BIFs in the section Tracing Calls with the trace_pattern BIF, tracing on the
shell could not be enabled because the shell was itself the process
receiving the trace events. The messages are now being sent to a tracer
process which is not the shell, and so trace events for global calls
such as start/0 and send/1 have become visible:
1>dbg:tracer().{ok,<0.100.0>} 2>dbg:p(all,[c]).{ok,[{matched,nonode@nohost,25}]} 3>dbg:tp({ping, '_', '_'}, []).{ok,[{matched,nonode@nohost,5}]} 4>Pid = ping:start().<0.105.0> (<0.97.0>) call ping:start() (<0.105.0>) call ping:loop() 5>ping:send(Pid).(<0.97.0>) call ping:send(<0.105.0>) pong =ERROR REPORT==== 7-Sep-2008::12:47:07 === Error in process <0.107.0> with exit value: {undef,[{crash,do_not_exist,[]}]} 6>dbg:ctpg({ping, '_', '_'}).{ok,[{matched,nonode@nohost,5}]}
You should spend some time getting acquainted with the tracer and
its interface, as this is one of the most powerful tools available with
the Erlang runtime distribution. When reading the manual page for dbg,
you will discover that there are many variants of the tp, tpl,
ctp, ctpl, and ctog functions. Don’t worry about them unless
you like using shortcuts. It is probably hard enough to remember the
ones we have discussed in this chapter, let alone all of their variants.
The good news is that the ones we described are all you need, and they
allow you to express all combinations covered in the other variants. It
is a trade-off between having a good memory and remembering all of the
variants, or typing in a few extra characters. And as a fallback, all
you need to revert back to is dbg:h().
Warning
When you are tracing live systems, you should use the dbg tracer with extreme care. If you turn on too many trace events in a busy system, you run the risk of generating so many shell printouts that it becomes impossible to type in the command necessary to stop the trace. As a result, the tracer process becomes unable to keep up with the generated event messages. They queue up, and very quickly, the Erlang runtime system runs out of memory. Support engineers (and one of the authors[43] of this book) have caused service outages in national fixed phone and mobile data networks because of dbg. Use it in a safe test environment as carelessly as you want, but when debugging live systems, make sure you know what you are doing, and exercise extreme care!
Distributed Environments
Tracing can take place in distributed environments, with all of the trace output being redirected to a single tracer. When you enabled or cleared a trace, you must have noticed from the examples that the return value of the calls was of the following format:
{ok,[{matched,nonode@nohost,5}]}.As we were not running distributed nodes, all local traces were on
the node nonode@nohost. When running the
traces in a distributed environment, you would instead get a list of all
nodes on which the traces were enabled. If the tracer was unable to
connect to a remote node, the result for that particular node would be
{matched,Node,0,RpcError}.
The call dbg:n(Node) adds a
distributed Erlang node to the traced list and dbg:cn(Node) removes it from the list. To list
the nodes on which you are running a trace, you use dbg:ln(). Once nodes
have been added, setting trace items, flags, and function patterns will
result in all traced nodes being affected. Process identifiers passed
to dbg:p/2 can be on
other nodes. The only thing dbg:p/2
does not handle is globally registered names.
Redirecting the Output
In all of the dbg tracer examples we have looked at so far, the trace events have been sent to a tracer process that formatted and printed them out in the shell. This might not always be the best way to handle debugging information. You might instead want to collect statistics, measure garbage collection, or forward the output to a socket or a file.
The good news here is that dbg allows you to define your own
fun to handle the trace messages generated by the trace
BIFs. If you start the tracer tool using dbg:tracer(process, {HandlerFun, Data}), all events are passed as
arguments to HandlerFun, a user-defined fun of arity 2. The trace message is the first
argument and the user-defined Data is
the second. The fun returns data that
is passed back to it in its next iteration, and so this value can be
seen as an accumulator, keeping track of total
resource use, for instance.
In the following example, we will be monitoring the memory usage
of the shell process. Our HandlerFun
will store the memory usage data when it starts garbage collecting,
providing information on whether memory is allocated or released. We’ll
test our tracer by running some memory-intensive applications on lists.
A positive delta value means memory has been freed in the (current) heap
and the old heap, and a negative value means memory has been allocated.
All sizes are in words. Notice how memory is allocated in the old heap
while being freed in the current heap. This will be the longer-lived
data that has survived a garbage collection in the current heap and is
being moved to the old heap.
The following example is long; any typos will result in you having to type everything from scratch. Be smart; either use an editor to type the example and paste it in the shell, or download it from the book’s website:
1>HandlerFun =fun({trace, Pid, gc_start, Start}, _) -> Start; ({trace, Pid, gc_end, End}, Start) -> {_, {_,OHS}} = lists:keysearch(old_heap_size, 1, Start), {_, {_,OHE}} = lists:keysearch(old_heap_size, 1, End), io:format("Old heap size delta after gc:~w~n",[OHS-OHE]), {_, {_,HS}} = lists:keysearch(heap_size, 1, Start), {_, {_,HE}} = lists:keysearch(heap_size, 1, End), io:format("Heap size delta after gc:~w~n",[HS-HE]) end. #Fun<erl_eval.12.113037538> 2>dbg:tracer(process, {HandlerFun, null}).{ok,<0.32.0>} 3>dbg:p(self(), [garbage_collection]).{ok,[{matched,nonode@nohost,1}]} 4>List = lists:seq(1,1000).[1,2,3,4,5,6,7,8,9,10,11,12,13,14,15,16,17,18,19,20,21,22, 23,24,25,26,27,28,29|...] Old heap size delta after gc:0 Heap size delta after gc:6020 5>RevList = lists:reverse(List).[1000,999,998,997,996,995,994,993,992,991,990,989,988,987, 986,985,984,983,982,981,980,979,978,977,976,975,974,973,972|...] Old heap size delta after gc:-676 Heap size delta after gc:3367
Redirecting to sockets and binary files
You have seen how to write your own funs to handle trace messages. Using the same mechanism, you can forward trace outputs to a socket or a binary file. This gives you the advantage of reducing the load on the traced node, particularly as a result of any I/O in the shell. It is this I/O which can get so intensive, making it extremely hard to correctly type in the command needed to stop the tracer!
How do you redirect the output? In the dbg:tracer/2 call,
instead of the process argument we
demonstrated in the previous sections, you pass the port atom. The call:
dbg:tracer(port, PortFun)
starts a tracer that will pass the trace messages to an Erlang
port. PortFun is a fun
encapsulating the opened port and returned by the call dbg:trace_port(ip,
Port), where Port is
either the port number or the tuple {PortNumber, QueueSize}. QueueSize
limits the size of the undelivered message queue, dropping
trace events if they are not picked up by the remote socket client.
This option will open a listener port, buffer the messages, and send
them as soon as a client connects.
To connect the client, call dbg:trace_client(ip,
Arg), where Arg is either the PortNumber
(if the tracer is running on the same host) or the tuple
{HostName, PortNumber} if it is
running on a different machine, the preferred option if tracing is
expected to impose a heavy load. This call will connect to the
listener port where the trace is running and retrieve the trace
events.
If you want to send your trace events to a binary file, bind the
variable PortFun to the return
value of dbg:trace_port(file,
FileOptions). The FileOptions describes the way in which the
trace is to be stored in the filesystem. FileOptions can specify either a filename,
or a wrap files specification, which will limit
the amount of file space used. By default, using {FileName, wrap, FileSuffix} will result in
eight wraparound files, each 128 KB in size. To change the default
values, use {Filename, wrap, FileSuffix,
WrapTrigger, WrapCount}, where WrapTrigger is the size in kilobytes or the
tuple {time, Milliseconds}.
Suffix is the file suffix and
WrapCount is the number of files
created before wrapping around.
You can retrieve the messages with the trace_client/2 call, where the first
argument is the atom file, reading
all of the trace events written so far, or follow_file, which continually reads and
processes trace events written after the call. The second argument is
the FileName as passed in the
FileOptions argument you passed to
the dbg:trace_port/2 call.
If you want to handle your own trace events, received through
either a file or a socket, you can use the dbg:trace_client(Type, Arg, {HandlerFun,
Data}) call. It starts a client that will apply HandlerFun to each incoming trace event in
turn. Type and Arg are the same as in the earlier
descriptions of trace_client/2,
whereas the {HandlerFun, Data}
tuple is the same as in tracer/2.
The call dbg:stop_trace_client(Pid), where Pid is the return value of the tracer/2 call, stops the client.
In the following example, we start a local tracer that redirects trace events to IP port 1234 on a different Erlang node running on the same host. A tracer client will pick up the events and process them. When dealing with systems carrying live traffic, it is a good practice to redirect your trace events either to a file, which you process on a different machine, or to a socket, where a client on a remote machine picks up the message traffic:
1>PortFun = dbg:trace_port(ip, 1234).#Fun<dbg.12.21848437> 2>dbg:tracer(port, PortFun).{ok,<0.33.0>} 3> dbg:p(all, [c]). {ok,[{matched,nonode@nohost,25}]} 4>dbg:tp({ping, '_','_'}, []).{ok,[{matched,nonode@nohost,5}]} 5>dbg:tpl({ping, '_','_'}, []).{ok,[{matched,nonode@nohost,5}]} 6>Pid = ping:start().<0.39.0> 7>ping:send(Pid).pong =ERROR REPORT==== 14-Sep-2008::12:25:23 === Error in process <0.41.0> with exit value: {undef,[{crash,do_not_exist,[]}]}
The output is received by a tracer client process in a different Erlang shell:
1>Pid = dbg:trace_client(ip, 1234).<0.40.0> 2> <0.30.0>) call ping:start() (<0.39.0>) call ping:loop() (<0.30.0>) call ping:send(<0.39.0>) (<0.39.0>) call ping:loop() 2>dbg:stop_trace_client(Pid).ok
Match Specifications: The fun Syntax
We introduced the powerful (but ugly) match specifications in Chapter 10. As you might recall, a match specification consists of an Erlang term describing a small program that expresses a condition to be matched over a set of arguments. Match specifications are limited in functionality, and in the case of the trace BIFs, they mainly deal with the filtering and manipulation of trace events. If they match successfully, a trace event is generated and some predefined actions can be executed. Match specifications are compiled to a format close to the one used by the emulator, making them more efficient than functions. But apart from being more efficient, the specifications are complex to write, and at first glance, they look incomprehensible.
Luckily, you can generate match specifications covering a majority
of simple but useful cases using the dbg:fun2ms/1 call. It converts specifications
that are described using fun syntax
into match specifications. The results are as efficient as writing the
match specifications by hand, but they are much easier to read, write,
modify, and debug. We are using dbg:fun2ms/1 to turn an anonymous fun into a
match specification, which is used when setting trace flags on local and
global calls. We start by introducing this higher-level approach, but for
those who need to harness the full power of the trace BIFs, we follow this
by looking at the match specifications themselves.
Generating Specifications Using fun2ms
Remember the bug we described in the beginning of the chapter? The one
where we corrupted the ETS table with the tuple {error, unknown_msg}? We can re-create the
error in the following way: first, we use the dp:fill() call to
create and corrupt the ETS table. The crash in the system that occurred
when reading the corrupted table will then be generated by calling
the dp:process_msg()
function, which takes the first element in the ETS table and processes
it. In the real world, we would not know either of these functions, and
would have to rely on higher-level tests that would eventually lead to
these calls being made by a worker processes. In this example, we are
calling them from the shell, as that will facilitate demonstrating the
step-by-step debugging procedures that have to be undertaken to solve
the bug using match specifications:
1>dp:fill().true 2>dp:process_msg().** exception error: no case clause matching [{2,{error,unknown_msg}}] in function dp:process_msg/0
The error message tells us immediately that there is a case clause error in the process_msg/0
call. Following the call flow in the dp:process_msg() function discovered by the
exception error printed in the shell, we immediately notice that the
pattern {_,{error,
unknown_msg}} is missing in the case clause:
-module(dp).
-compile(export_all).

process_msg() ->
  case ets:first(msgQ) of
  '$end_of_table' ->
      ok;
    Key ->
      case ets:lookup(msgQ, Key) of
        [{_, {event, Sender, Msg}}] ->
          event(Sender, Msg);
        [{_, {ping,  Sender}}] ->
            ping(Sender)
      end,
      ets:delete(msgQ, Key),
      Key
  end.

event(_,_) -> ok.
ping(_)    -> ok.

fill() ->
  catch ets:new(msgQ, [named_table, ordered_set]),
  dp:handle_msg(<<2,3,0,2,0>>).
The entry {2, {error,
unknown_msg}} should not have been inserted in the table in
the first place, so we can assume that the case clause is correct and that adding the
{error, unknown_msg} clause will not
solve the bug. What we need to find out is who inserted it in the table,
and stop it from happening again. The corruption must have originated in
an ets:insert/2 call, but as there are many in the system, we need to
pinpoint which one it is by creating a match specification that
generates a trace message only if the tuple element being inserted is
{error, unknown_msg}. This match specification, when
used together with the trace patterns of the modules, functions, and
arguments, will trigger a trace event whenever the call with those
arguments is made.
The function dbg:fun2ms/1 takes
a literal fun as an argument and returns a match
specification describing the properties in the fun. By “literal fun,” we
mean a fun that is typed in and
passed as a parameter, not a fun that
is bound to a variable which is then passed as an argument, or a
fun that results from applying a
higher-order function. We could also call this an “explicit” or a
“manifest” fun. The fun takes one parameter, which is either a
variable or a list of variables, all of which can be pattern-matched or
used in guards. You can use the variables in the fun body, but the last expression has to be
either a predefined call that is converted to an action, or a term that
is ignored.
The Erlang precompiler takes the literal fun and translates it to a match
specification. You can type match specifications directly in the shell,
but if you include them in your modules, you must include the header to
the ms_transform.hrl file. It is
part of the standard library application, and is most easily included as
follows:
-include_lib("stdlib/include/ms_transform.hrl").Armed with this knowledge, let’s generate a match specification
which when passed to the dbg:tp/2 function will
trigger an event if the second argument to a call is of the form
{_, {error, unknown_msg}}. This would
include the call ets:insert(msgQ, {1, {error,
unknown_msg}}):
dbg:fun2ms(fun([_, {_,{error, unknown_msg}}]) -> true end).Do you see how we are pattern matching in the fun? The atom true returned by the literal fun is ignored,
but we have used the pattern-matching facilities of the fun syntax to express the required
pattern.
Let’s try it out in the shell. Remember, you cannot bind the
fun to a variable; it is a
literal fun
expression that is handled by the precompiler, and as such, it has to be
entered explicitly as an argument to the call. Note also that the
call db:fill/0 puts only
one incorrect entry in the ETS tables, but it could have put in
thousands of entries, most of which could have been correct. As a result
of our tests, however, we want to generate only one trace event that is
triggered when the second element of the second argument is the tuple
that corrupts our table:
3>dbg:tracer().{ok,<0.58.0>} 4>Match1 = dbg:fun2ms(fun([_,{_,{error, unknown_msg}}]) -> true end).[{['_',{'_',{error,unknown_msg}}],[],[true]}] 5>dbg:tp({ets, insert, 2}, Match1).{ok,[{matched,nonode@nohost,1},{saved,1}]} 6>dbg:p(all,[c]).{ok,[{matched,nonode@nohost,25}]} 7>dp:fill().true (<0.54.0>) call ets:insert(msgQ,{2,{error,unknown_msg}})
We now know the pid of the calling process, but it did not make us any wiser. As processes are created for every incoming message and are terminated as soon as the message has been queued, there would be no point in tracing it. What we really need is the function that calls this insertion (the caller function).
Luckily, we can request this information by telling the match
specification to generate an event that contains information about the
caller function. We do this by making our fun return one of a set of predefined literal
functions, all of which are also handled by the precompiler. In our
case, we would use message(caller()):
dbg:fun2ms(fun([_,{_,{error, unknown_msg}}]) -> message(caller()) end).The literal call message(Data)
sends a message with the Data to the
tracer process; to display it in the shell instead, use display(Data). In our example, we passed the
literal function caller() as Data. We will cover other valid data options
shortly. Right now, let’s focus on identifying the caller and see
whether it helps us solve the bug:
8>Match2 = dbg:fun2ms(fun([_,{_,{error, unknown_msg}}]) ->8>message(caller())8>end).[{['_',{'_',{error,unknown_msg}}],[],[{message,{caller}}]}] 9>dbg:tp({ets, insert, 2}, Match2).{ok,[{matched,nonode@nohost,1},{saved,2}]} 10>dp:fill().true (<0.34.0>) call ets:insert(msgQ,{2,{error,unknown_msg}}) ({dp,handle_msg,1})
Note how after the ets:insert/2
trace message, the calling function ({dp,handle_msg,1}) is now also displayed by
the tracer. This is as a result of the message(caller()) call in our literal fun. We now know that ets:insert/2 with the wrong data is being
called by the dp:handle_msg/1
function. We look at the code, follow the call flow, and immediately
find that the {error, unknown_msg}
tuple is created in the dp:handle/3 function
as a result of the MsgType argument
being anything other than the integer 1 or 2:
handle_msg(<<MsgId, MsgType, Sender:16, MsgLen, Msg:MsgLen/binary>>) ->
  Element = handle(MsgType, Sender, Msg),
  ets:insert(msgQ, {MsgId, Element}).

handle(1,   Sender,  Msg)  -> {event, Sender, Msg};
handle(2,   Sender,  _Msg) -> {ping,  Sender};
handle(_Id, _Sender, _Msg) -> {error, unknown_msg}.
We can now run a trace on the handle/3 function, generating events only if
the MsgType is not the integer 1 or
2. We bind MsgType in the fun head and test it in a
guard. Binding of variables is allowed only in the
function head: using = in your match
fun will result in an error being
returned, and the match specification failing to compile.
We can easily add this condition by adding a guard to our literal
fun:
dbg:fun2ms(fun([Id, Sender, Msg]) when Id /=1, Id /=2 -> true end).
Remember that a semicolon between guards means that at least one of the
guards is required to succeed, and a comma means they all must succeed. The guards allowed in
literal funs are the same as in
conventional guards. They include:
- BIFs used in type tests
is_atom,is_constant,is_float,is_integer,is_list,is_number,is_pid,is_port,is_reference,is_tuple,is_binary,is_function,is_record- Boolean operators
not,and,or,andalso,orelse- Relational operators
>,>=,<,=<,=:=,==,=/=,/=- Arithmetic operators
+,-,*,div,rem- Bitwise operators
band,bor,bxor,bnot,bsl,bsr- Other BIFs allowed in guards
abs/1,element/2,hd/1,length/1,node/1,2,round/1,size/1,tl/1,trunc/1,self/0
If a runtime error occurs as a result of a bad argument when pattern
matching in the function head, or because of invalid arguments used in
the guard operations, the match fails. If a runtime error occurs in the
match specification body, the match specification simply returns the
atom 'EXIT'. The trace event is
generated and any return value is ignored.
By using the not equals (/=)
conditional guard to test for invalid integers in the shell, we will get
the final clue to resolve the bug!
11>Match3 = dbg:fun2ms(fun([Id, Sender, Msg]) when Id /=1, Id /=2 -> true end).[{['$1','$2','$3'],[{'/=','$1',1},{'/=','$1',2}],[true]}] 12>dbg:tpl({dp, handle, 3}, Match3).{ok,[{matched,nonode@nohost,1},{saved,3}]} 13>dp:fill().(<0.44.0>) call dp:handle(3,2,<<>>) (<0.44.0>) call ets:insert(msgQ,{2,{error,unknown_msg}}) ({dp,handle_msg,1}) true
Looking at the preceding trace events, we now know that dp:handle/3 is called with message type 3, and
the hardware ID of the sender is 2. Looking at the software revision on
the hardware denoted by the ID 2, we realize it is not supported by our
software, resulting in the data being corrupted. Problem solved!
You can include the calls in a literal fun and they
will be translated to actions during the parse transform in the
precompiler. Some of these actions you already saw in the examples, but
we include all of them here for reference:
return_trace()Generates an extra event upon completing the traced call, including the return value of the function. When generating this extra trace event, tail-recursive properties of the traced function calls are lost.
exception_trace()Behaves in the same way as
return_trace, but if a runtime error occurs, anexception_frommessage is generated.display(Data)Generates a side effect by printing the
Datapassed to it. TheDatacan be either one of the arguments bound in thefunhead or the return value of one of the other literal functions described in this section.message(Data)Generates a trace event with the
Data. TheDatacan be either one of the arguments bound in thefunor the return value of one of the other literal functions described in this section.message(false)Is a special case of
message/1, where no trace event is generated for thecallandreturn_totrace flags. This is useful if you are interested in side effects, such as those generated by thedisplay/1literal.message(true)Is another special case of
message/1, where the trace on the{Module, Function,Arity}behaves as though no match specifications are associated with it. Its only use is to override themessage(Data | false)call.enable_trace(TraceFlag)Enables a
TraceFlagon the process that triggered the match specification. You can pass only one flag at a time, but nothing is stopping you from having several calls each with their own trace flag in thefunbody. TheTraceFlagis as defined in the trace BIFs; no abbreviations used by the tracer tool are allowed. Executing this call in a match specification is the equivalent of callingerlang:trace(self(),true,[TraceFlag]).enable_trace(Pid, TraceFlag)Is the same as
enable_trace/1, except that it will enable the trace flag on thePid, which is either a process identifier or a registered name.disable_trace(TraceFlag)Disables a
TraceFlagon the particular process that triggered the match specification. The same restrictions toTraceFlagapply as in theenable_trace/1literal call.Executing this call in a match specification is the equivalent of calling
erlang:trace(self(), false, [TraceFlag]).disable_trace(Pid, TraceFlag)Is the same as
disable_trace/1, except theTraceFlagwill be disabled on the specifiedPid.trace(Disable, Enable)andtrace(Pid, Disable, Enable)allow you to enable and disable many flags at the same time.silent(true)Turns off all call trace messages originating until a match specification with
silent(false)in its body is matched.set_tcw(Int)Sets a unique trace control word that you can retrieve using the
erlang:system_info(trace_control_word)BIF call. It is a free-to-use status value used by some advanced tools (possibly user-defined), allowing these tools to influence the actions taken based on its value.
You can pass the following calls as arguments to the display/1 and message/1 literal functions:
caller()Returns the
{Module, Function, Arity}tuple, allowing you to identify the calling function.get_tcw()Returns the trace control word which was previously set using
set_tcw/1.object()Returns a list with all of the arguments passed to the match specification.
bindings()Returns a list of all bound variables in the match head.
process_dump()Returns the process stack properly formatted as a string in the form of a binary. You can pass it as an argument to
message/1, where you have implemented your own tracer process. Passing it todisplay/1will not work, as it is unable to print binaries.self()
Odds and ends with fun2ms
When generating match specifications using fun2ms, you must follow certain
restrictions, as the functionality in match specifications is limited.
Now that you are armed with the knowledge of how match specifications
work, these restrictions are easier to understand.
You cannot call Erlang functions in the fun body. Guards and functions allowed in
the match body will be translated as is, so even if they compile
correctly, using them might cause the match specification to return an
error. All variables defined as arguments to the fun are replaced by
match specification variables in the order in which they occur. If you
look at some of the match specifications we have generated, a fun head such as that which occurs in the
following:
fun([Id, Sender, Msg])when Id /=1, Id /=2 -> true end).
translates to ['$1','$2','$3']. Every occurrence of these
variables is replaced in the match specification conditions and body,
so in the preceding example, the guards would translate to a condition
of the format [{'/=','$1',1},{'/=','$1',2}] and guards
such as is_integer(Id) would be
translated to a condition resembling [{is_integer, '$1'}].
Variables bound outside the scope of the fun and not appearing in the head are
imported, either from the shell or from the function where the match
specification is generated. They are translated to constant
expressions of the format {const,
Constant}, where Constant
is the literal value of the Constant. Generating the match specification
using the following function:
foo(A) -> dbg:fun2ms(fun([B,C]) when B == A -> A end).
and calling foo(10) will
generate a specification of the following format:
[{['$1','$2'], [{'==','$1',{const,10}}], [{const,10}]}].You can bind variables only in the fun head, and even here, you can do so only
restrictively. For example, a fun
of the form fun({A,[B|C]} = D),
where D is bound at the top level
to all of the arguments, is allowed, whereas fun({A,[B|C]=D}) is not. In the first case,
if you are interested in printing or returning all of the arguments,
you would be better off using the literal function object(), which is translated to '$_', a term that expands to all of the
arguments. If you are interested only in the variable bindings and you
ignore the “don’t care” variables, use the literal function bindings(), which translates to '$*' in the lower-level match
specification.
Literal term constructions are translated in order to turn them
into valid match specifications; tuples are converted to a one-element
tuple containing the tuple itself, and constant expressions are
converted to the form {const,
Constant}. Records and operations on records are converted
to tuples and element calls. The is_record/2 guard is converted to {is_record, Var, Arity}, where Var is replaced by a variable of the format
'$0' and Arity is the size of the tuple. List pattern
matches are converted to use the {hd,
List} and {tl, List} constructs. As conditional constructs
such as case, if, and catch are not allowed in match
specifications, they are not allowed in funs either.
Remember that when dealing with the fun2ms call in a module, the module must
always include the ms_transform.hrl header file. If you don’t
include it, the code might compile without any warnings, but the match
specification will not be translated, possibly resulting in a runtime
error. Translations to match specifications are done at compile time,
so runtime performance is not affected by using these literal
functions.
Difference Between ets and dbg Match Specifications
There are differences between the match specifications used by
the ets and the dbg modules. If the pseudo function triggering
the translation is ets:fun2ms/1, the
fun’s head must contain a single
variable or a single tuple with its guards acting
as filters. The body of the fun, and
as a result, the body of the match specification, constructs terms and
returns values that are the result of the select/2 call. This is done without generating
any side effects or binding variables. Even though you can use ets match specifications from the shell, you
will usually find them embedded in program code.
If the pseudo function is dbg:fun2ms/1, on the
other hand, the fun’s head must
contain a single variable or a single list. The
specification body will contain imperative commands that result in side
effects manifesting themselves as printouts, the manipulation of trace
flags, or extra data appended to the trace events. The return value of
the generated specification is ignored. Trace BIF specifications are
most commonly used from the shell, even if nothing is stopping you from
integrating them in your programs.
What unites the two is the need for efficient filtering with low overheads that do not affect the real-time properties of the system. If what you have seen so far does not scare you, let’s look at these match specifications in more detail. A warning for the faint of heart: what we will describe in the next section, although powerful, is not pretty.
Match Specifications: The Nuts and Bolts
When covering the help function dbg:fun2ms/1, we went into a high-level
explanation of its results, namely match specifications. The
specifications are tuples with three elements of the format [Head, Conditions, Body]:
The head is used to bind and match variables and terms.
In the conditions, logical tests are applied on the variables. You can define your own logical tests or use predefined guards.
In the body part of the specification, we list a possibly empty set of predefined actions that have to be taken if the match in the head is successful and the logical conditions are met.
The objective of this section is to ensure that you understand the
match specifications that result from the dbg:fun2ms/1 and ets:fun2ms/1 calls, and possibly implement some
simpler ones for yourself.
The Head
The head is a list of variables, literals, and composite data types. All
variables in the head are of the form '$int()', where int() is replaced by an integer of the format
'0' or '1', ranging from 0 to 100,000,000. The atom
'_' denotes the “don’t care”
variable, and can be used if you are not interested in matching parts of
a particular argument. If you instead want to match on all values and
all arities without any variable bindings, you just use '_', giving a specification of the form
['_', Conditions, Body]. You might be
tempted to write [[], Conditions,
Body] instead, but beware, as this will only match functions
of arity 0.
In the following example, we create a specification that matches
on functions of arity 2. We bind the first argument to the variable
'$1'. The second argument has to be a
tuple where the first element is bound to the variable '$2' and the second element is the tuple
{error, unknown_msg}. The match
specification for such a case is as follows:
[{['$1',{'$2',{error,unknown_msg}}],[],[]}]In the preceding code, the conditions and the body are denoted by
empty lists, as no logical checks and side effects are needed. Look at
the example in the section Generating Specifications Using fun2ms, where we were
looking for debug messages, and see what dbg:fun2ms/1 produced.
In the following example, we use dbg:tp/2 to start a trace on all calls to the
ets:insert/2 function. The match
specification that we pass as the second argument ensures that trace
events are triggered only if the second argument is a tuple of size 2,
where the second element is the tuple {error,
bad_day}:
1>dbg:tracer().{ok,<0.32.0>} 2>dbg:p(all,[c]).{ok,[{matched,nonode@nohost,25}]} 3>dbg:tp({ets,insert,2}, [{['$1',{'$2',{error,bad_day}}],[],[]}] ).{ok,[{matched,nonode@nohost,1},{saved,1}]} 4>ets:new(foo,[named_table]).foo 5>ets:insert(foo, {1, monday}).true 6>ets:insert(foo, {1, {error, bad_day}}).true (<0.30.0>) call ets:insert(foo,{1,{error,bad_day}})
Instead of '$1' and '$2', we could have used “don’t care”
variables, as we are not doing anything with the values of the arguments
in the conditions or body.
It is possible to repeat variables within specifications. In the
specification [{['$1','$1'],[],[]}],
we match calls to functions of arity 2 where the arguments are the same.
The specification would trigger a trace event if the call to foo(1,1) was being traced. The match
specification head [{'$1','$2'},
['$1','$2'|'_ ']] would match
functions of arity 2 where the first argument is a tuple with two
elements and the second argument is a list whose first two elements are
identical to those in the tuple. For instance, the call foo({1,2},[1,2,3]), if traced, would trigger
an event.
Conditions
The conditions list allows several logical tests on variables to be
combined. If they are positive, the match is successful and the trace
event is triggered. All variables must be bound, but unlike in the head,
literal and compound data types must be described using a special
syntax. To represent a tuple, it is necessary to use either {const, Tuple} or {Tuple}, where Tuple is a literal or the variable
representing the tuple. Lists are deconstructed into a head and tail
using {hd, List} and {tl, List}, where List is the representation of the list.
Boolean functions include functionality similar to the BIFs you are allowed to use in guards and in logical, Boolean, relational, and arithmetic operators. As match specifications are Erlang terms, however, all of these operators have to be represented as atoms, and operations themselves are grouped together in tuples.
Guards are of the format {Guard,
Variable}, where the Guard
can be any one of is_atom, is_constant, is_float, is_integer, is_list, is_number, is_pid, is_port, is_reference, is_tuple, is_binary, is_function, or is_seq_trace.
For example, to test for a list, you would use a guard of the following form:
{is_list, '$0'}.The guard to check for a record uses is_record and is of the following
format:
{is_record, '$1', RecordType, record_info(size, RecordType)}In the preceding code, the RecordType has to be a hardcoded literal
giving the record type required.
The conditional expression constructs take the following form:
{Construct, Exp1, Exp2, ...}In the preceding code, the first element of the tuple is the
logical construct and the remaining ones are (possibly nested)
conditional expressions or guards. The logical construct {'not', Expression} evaluates to true if the Expression evaluates to false. For any other result, it evaluates to
false.
The 'and', 'or', 'xor', andalso, and orelse constructs all take a tuple of size 3
or more, where the first element is the construct and the remaining ones
are the logical expressions. Using 'and' or 'or' will evaluate all expressions in the
construct, whereas andalso and
orelse will stop evaluating as soon
as one expression returns false or
true, respectively. For 'xor' to evaluate to true, one of its expressions must evaluate to
true and the other to false. Here is an example of a conditional
expression where all three expressions have to evaluate to true:
{'and', {'not', '$1'}, '$2', {'or', '$3,'$4'}}.Comparison operators take tuples with three elements, where the first
element is one of the operators '>', '>=', '<', '=<', '=:=', '==', '=/=', or '/=', and the remaining two contain
expressions whose result is compared. Combining guards, conditional
expressions, and comparison operators could give you something similar
to the following format:
{'and', {is_integer, '$0'}, {is_integer, '$1'}, {'>=', '$0', '$1'}}.The following BIF operations are also allowed in conditional
expressions. They behave like their counterpart BIFs and consist of a
tuple of size 2 or 3, depending on how many arguments the BIF requires.
The operations abs, hd, tl,
length, node, round, size, trunc, 'bnot', 'bsl', and 'bsr' all take one argument. Using element, '+', '-',
'*', 'div', 'rem', 'band', 'bor', and 'bxor' require a tuple with the operator and
two arguments. The BIF operations {self} and {get_tcw} return the process identifier of the
calling process or the trace control word. Even if they are most
commonly used in the match specification body, they are also allowed as
arguments to conditional expressions.
Enough with the syntax and semantics, as it is becoming too much to digest in one go. The best way to tackle it all is to look at some examples and try out some of your own. Can you figure out what triggers the following match specification? Try to do this before you read on:
[{['$1', '$2', '$3'],
[{orelse,
{'=:=','$1', '$2'},
{'and',
{'=:=','$1', {hd, '$3'}},
{'=:=','$2', {hd, {tl, '$3'}}}
}
}],
[]
}]Let’s break up the preceding code bit by bit. The head tells us
the function is of arity 3. The condition is an orelse; the first condition here is '$1' '=: =' '$2', requiring that the first
argument be exactly equal to the second. If this fails, we try the
conjunction (and) of {'=:=','$1', {hd, '$3'}}and {'=:=', '$2', {hd, {tl,'$3'}}}. From this we
can deduce that '$3' has to be a list
whose first element {hd, '$3'} is
equal to the first argument '$1' and
whose second element (the head of the tail) is equal to '$2', the second argument. In Erlang terms,
the third argument would be a list where '$3' =
['$1','$2|'_']. Traced calls that would trigger a match would
include foo(1,2, [1,2,3]) and
foo(true, true, false). As an
exercise you could try to define a fun that will be transformed to this
using dbg:fun2ms/1.
As you can see from the example, quite a few operators and constructs are allowed. They all work in the same way as the corresponding guards, BIFs, and operators. The rule of thumb is that if they are allowed in guards, they will be allowed in match conditions.
In case of bad arguments, where the data of the wrong type is bound to the variables that are passed to these operations, the condition fails. The process executing the match specification does not crash.
Let’s look at a few more examples. The first one takes two
arguments and will match if '$1' is
greater than or equal to 0 and '$2'
is less than or equal to 10. Calling the traced function foo(0,10) or foo(5,5) would successfully trigger the trace
event:
[{['$1', '$2'],
[{'and', {'>=', '$1', 0},
{'=<', '$2', 10}}],
[]
}]The next example will match if the first argument to the function
of arity 2 is the atom enable or
disable and the second argument is
the tuple where the first element is another tuple, {slot, 1, 3}. Note how we have used the
{const, Term} construct in the
example to denote the atoms enable
and disable, and then encapsulated
these tuples in another tuple.
As conditions and the body of match specifications consist of
tuples, we have to either use the {const,
Term} construct, or insert the tuple in a tuple (as in
{{slot, 1,3}}) to differentiate a
“real” tuple from a conditional construct and the BIF and comparison
operators:
[{['$1', '$2'],
[{'and', {'orelse',{'=:=', '$1', {const, enable}},
{'=:=', '$1', {const, disable}}},
{'=:=', {element, 1, '$2'}, {{slot, 1, 3}}}
}],
[]
}]We would use the preceding specification if we were tracing
specific operations on boards in slot 1 placed in subrack 3. Examples of
functions that would trigger a trace event include the function calls
board:action(enable, {{slot, 1,3},
disabled}) and board:action(disable, {{slot, 1,3}, unknown}).
As you will see in the next section, upon triggering the
specification, we could turn on a particular trace flag in the body part
of the specification. Before looking at how to do it, let’s try to clean
up the preceding example, adding a second match specification to the
list. In a live environment, both match specifications would yield the
same result, but the example that follows allows only tuples of size 2.
Using the equivalent of the element
BIF, we are stating that the second argument has to be a tuple with at
least two elements:
[{[enable, {{slot, 1, 3}, '_'}],
[],
[]},
{[disable, {{slot, 1, 3}, '_'}],
[],
[]}
]The Specification Body
If the match is successful and the conditions evaluate to true, we can specify a set of actions,
including sending trace events, printing terms, enabling and disabling
trace flags, and returning trace information. The same rules as those
given in the previous section apply here to variables and literals;
actions must always be defined in tuples, even if they take no
arguments. The same rules as earlier also apply to '$_' and '$$': namely, '$_' returns the whole parameter list, and
'$$' returns the list of all bound
variables.
In the following example, if the first match specification is
successful, the procs flag will be
added to the list of trace flags; if the second match specification is
successful, it will remove that flag from the list:
[{[enable, {{slot, 1, 3}, '_'}],
[],
[{enable_trace, procs}]},
{[disable, {{slot, 1, 3}, '_'}],
[],
[{disable_trace, procs}]}
]The syntax of the specification body to enable and disable calls
is of the form {enable_trace, TraceFlag} and
{disable_trace, TraceFlag} where
TraceFlag is a single flag as defined
in the section The Trace BIFs. The enable_trace and disable_trace actions have the same effect of
calling the following BIF:
erlang:trace(self(), Flag, [TraceFlag])
where Flag is replaced by the
atom true or false, respectively enabling or disabling the
TraceFlag.
The following actions can be executed in the match specification body:
{message, Args}Appends the
Argsto the trace events. TheArgscould be variables, arguments, or return values of other actions such asprocess_dump.{message, false | true}Is a special case where messages of the
callandreturn_totrace flags are not sent if the flag isfalse. Passingtrueresults in a regular trace message and is the same as not having a body at all.{return_trace}Causes a trace message to be sent upon the return of this function. If the function is tail-recursive, this property is lost.
{exception_trace}Behaves in the same way as
return_trace, with the exception that if the traced function exits because of a runtime error, anexception_fromtrace message is generated.{silent, true | false}Turns trace messages on and off for that process, but not the tracing itself.
{display, Term}Displays a single
Termon stdout, and should be used only for debugging purposes!{set_tcw, Value}Sets the trace control word of a node, returning the previous value. Calling
erlang:system_flag(trace_control_word, Value)will have the same effect as executing the command in the specification body.{enable_trace, TraceFlag}Enables any of the trace flags accepted by the trace BIF. For every
TraceFlagthat you want to enable, you need a separateenable_tracecall. This would have the same effect as callingerlang:trace(self(), true, [TraceFlag]).{disable_trace, TraceFlag}Disables the
TraceFlag. Executing this function in the match specification would be the equivalent of calling the functionerlang:trace(self(), false, [TraceFlag]).{trace, DisableList, EnableList}Will disable the flags defined in the
DisableListwhile atomically enabling the ones defined in theEnableList. The flags are the same as those that can be used in theerlang:trace/3BIF, but you may not include thecpu_timestampflag. You may, however, include the{tracer, Pid}specifying whichPidshould receive the trace events. If defined in both lists, flags (including thetracerdirective) in theEnableListtake precedence over those in theDisableList.{trace, Pid, DisableList, EnableList}Is the same as the function with two arguments, but also allows you to define a process identifier or a registered alias on which the flags should be enabled or disabled. The aggregation of the flags is atomic.
The following calls are used to return values, most commonly used
as an argument to the message and
display actions just
described:
{process_dump}Returns textual information on the process, formatted as a string and stored as a binary.
{caller}Returns the calling function in the format
{Module,
            Function
, Arity}. The trace event will returnundefinedif the function cannot be determined.{get_tcw}Returns the trace control word previously set. This call has the same effect as calling the BIF
erlang:system_info(trace_control_word).{pid}Returns the pid of the process executing the match specification.
In the following example, we append the process dump to the trace
message, pick it up in the tracer fun we have defined ourselves, convert
it from a binary to a string, and print it out. Note that the process
stack of the shell is deeper. We have removed some of the trailing
functions. Also, note how in the head section of the match specification
we pass in '_', denoting a function
of any arity:
1>DbgFun = fun({trace, _Pid, _event, _data, Msg}, _Acc) ->1>io:format("~s~n",[binary_to_list(Msg)])1>end.#Fun<erl_eval.12.113037538> 2>dbg:tracer(process, {DbgFun, null}).{ok,<0.33.0>} 3>dbg:tp({io,format,1}, [{'_',[],[{message,{process_dump}}]}]).{ok,[{matched,nonode@nohost,1},{saved,1}]} 4>dbg:p(all,[c]).{ok,[{matched,nonode@nohost,25}]} 5>io:format("Hello~n").Hello =proc:<0.30.0> State: Running Spawned as: erlang:apply/2 Spawned by: <0.24.0> Started: Tue Oct 07 13:17:07 2008 Message queue length: 0 Number of heap fragments: 0 Heap fragment data: 0 Link list: [] Reductions: 8879 Stack+heap: 2584 OldHeap: 2584 Heap unused: 1271 OldHeap unused: 2584 Stack dump: Program counter: 0x01b0e904 (shell:eval_loop/3 + 44) CP: 0x01b02388 (erl_eval:do_apply/5 + 1304) 0x01473450 Return addr 0x01b0f15c (shell:exprs/6 + 368) y(0) [{'DbgFun',#Fun<erl_eval.12.113037538>}] y(1) [] y(2) none 0x01473460 Return addr 0x01b0ec40 (shell:eval_exprs/6 + 80) y(0) [] y(1) [] y(2) [{'DbgFun',#Fun<erl_eval.12.113037538>}] y(3) {value,#Fun<shell.7.51306786>} y(4) {eval,#Fun<shell.24.79061235>} y(5) 13 y(6) [] y(7) [] y(8) []
In this last example, we are trying to find the caller of the
io:format/2 function in the shell. We
see the output formatted as the tuple {erl_eval, do_apply, 5} right after the call
in command 4:
1>dbg:tracer().{ok,<0.32.0>} 2>dbg:p(all, [call]).{ok,[{matched,nonode@nohost,25}]} 3>dbg:tp({io, format, 2}, [{'_', [], [{display, {caller}}] }]).undefined {ok,[{matched,nonode@nohost,1}, {saved,1}]} 4>io:format("Hello~n",[]).{erl_eval,do_apply,5} Hello (<0.30.0>) call io:format("Hello~n",[]) ok
Saving Match Specifications
Look at the preceding example, more specifically the return value of the dbg:tp/2 call. It returns {ok,[{matched,nonode@nohost,1},{saved,1}]}.
You already know about the first inner component, {matched, nonode@nohost, 1}; it tells you that
on this particular node, one function was matched. The {saved, 1}, however, tells you the match
specification in the call was saved with this identifier, that is, the
number 1. The dbg tracer assigns integers to all match specifications,
allowing you to use this integer instead of the specification
itself.
The help functions for retrieving and manipulating these calls include the following:
dbg:ltp()dbg:dtp()anddbg:dtp(Id)Delete the stored match specifications (with a particular identifier)
dbg:wtp(FileName)anddbg:rtp(Filename)Write and read match specifications from a file:
5>
dbg:tp({io,format,2},[{['_'],[],[{enable_trace, procs}]}]).{ok,[{matched,nonode@nohost,1},{saved,2}]} 6>dbg:ltp().1: [{'_',[],[{display,{caller}}]}] 2: [{['_'],[],[{enable_trace,procs}]}] exception_trace: x x: [{'_',[],[{exception_trace}]}] ok
Starting with the R13 release of Erlang/OTP, there is a presaved
match specification with the identifier exception_trace alias x. It is presaved as the match specification
[{'_',[],[{exception_trace}]}] and
can be used in calls such as dbg:tp({M, F, A}, x). It deserves a special mention, as it is
probably one of the most commonly used specifications when debugging.
Further Reading
As you might have realized, the functionality for tracing live Erlang programs, although powerful, can be complex at times. In this chapter, we provided you with a comprehensive overview of what is available, which should enable you to handle the vast majority of cases you come across. But as you will probably be dealing with live systems running nonstop under high load, you never know what to expect.
There are two functions, set_seq_token/2 and
get_seq_token/0, in the dbg:fun2ms/1 fun body call, which we have not
covered. They are translated to the sequential trace actions set_seq_token and get_seq_token in the match specification body.
Together with the API exported by the seq_trace module, they allow users to follow message propagation paths
across processes. If process A sends a message to process B, which as a
result sends messages to processes C and D, this propagated message call
chain is traced. If you are interested in learning more about them, read
the manual page for seq_trace. This
topic alone would deserve an additional chapter.
If you want to read more on the trace BIFs, the first point of call
should be the erlang module manual
page, where all the BIFs are described. If you are interested in exploring
match specifications, the ERTS User’s Guide dedicates
a whole chapter to them, including a complete grammar tutorial. If you
instead prefer to stay clear from match specifications and opt for match
specification transforms using the fun2ms functions, the ms_transform manual page is probably your best
bet. The match specification functions you pass to fun2ms, however, are documented in the
ERTS User’s Guide. And finally, the dbg manual page covers the dbg tracer
tool.
Exercises
Exercise 17-1: Measuring Garbage Collection Times
Using the trace BIFs, write a program that monitors the number of microseconds a process spends garbage collecting in a specific function. Once the function has completed its execution, print out the time. To ensure that the readings are not affected by previously allocated memory, spawn a new process for every reading.
Test your programs with a tail-recursive function and a non-tail-recursive function, which do the same thing. This will allow you to monitor the impact that garbage collection has on the time of non-tail-recursive functions handling lists of different sizes.
Hint: use timer:now_diff/2 to
calculate the time difference.
You could use the following as a tail-recursive function:
average(List) -> sum(List) / len(List).

sum([]) -> 0;
sum([Head | Tail]) -> Head + sum(Tail);

len([]) -> 0;
len({_ | Tail]) -> 1 + len(Tail).
And, you could use this as a non-tail-recursive function:
average(List) -> average_acc(List, 0,0).

average_acc([], Sum, Length) -> Sum / Length;
average_acc([H | T], Sum, Length) -> average_acc(T, Sum + H, Length + 1).
When you execute your code, it might look something like this:
1>List = lists:seq(1,1000).[1,2,3,4,5,6,7,8,9,10,11,12,13,14,15,16,17,18,19,20,21,22, 23,24,25,26,27,28,29|...] 2>gc_mon:measure(gc_test, average, List).Gc monitoring terminated Microseconds:8 ok
Exercise 17-2: Garbage Collection Using dbg
Rewrite the solution to Exercise 17-1 using dbg and your own tracer
fun. When doing so, add counters to
measure how much memory is reclaimed during execution of the process.
Pay special attention to the different memory types.
Exercise 17-3: Tracing ETS Table Entries
A crash report was logged. Further investigation shows that an ETS table
called countries gets corrupted by
the entry {'EXIT', Reason}. The tuple
is written instead of a record of type countries. The table is updated thousands of
times per day, and it would thus not be appropriate to trace all table
entries as the overhead and amount of data to be filtered would be too
large.
Create a match specification that is triggered every time the
tuple {'EXIT', Reason} is passed as
the second argument to the ets:insert/2 function. When you get the match
specification to work, start a separate Erlang node on which your tracer
receives and prints all trace messages.
When it works, rewrite the match specification that triggers on
both {'EXIT', Reason} and {'EXIT', Pid, Reason} using conditional
clauses.
Exercise 17-4: Who Is the Culprit?
Determine which of the two authors of this book managed to single-handedly cause a nationwide outage of a mobile data network through the careless use of the dbg tracer tool.
[40] All trace flags are atoms except the {tracer, Pid} tuple described in the
preceding paragraph.
[41] Unless you reach the system limit of the maximum number of allowed processes.
[42] If you do not recall what we mean by the heap and the old heap, review the sidebar Memory Management in Erlang in Chapter 2. We covered the process stack in Chapter 3.
[43] We have left it as an exercise for you to figure out which one of the authors was responsible.