How do I express a design's functions in engineering terms?

WE NOW finish defining the client's design problem and move into engineering practice by (1) establishing the functions that the design must perform, and (2) writing specifications that express those functions in quantitative, engineering terms that enable us to ensure that those functions are performed. Since specifications detail or specify how the performance of those functions can be assessed, they have much in common with the metrics we use to assess the achievement of objectives, and very similar approaches can be taken to writing requirements for a design's features and behaviors.
6.1 ESTABLISHING FUNCTIONS
Asked what a bookcase does, a child might answer, “It doesn't do anything, it just sits there.” An engineer, however, would say that the bookcase does at least two things: It resists the force of gravity exactly to support the weight of the books, and it enables the organization of those books with dividers or by its shelf lengths. Thus, this bookcase doesn't “just sit there.” Understanding functionality is essential to successful design. There are consequences, often tragic, for failing to understand and design for all of a design's functions: recall the Hyatt Regency failure we discussed in Chapter 1. We will now explore how we talk about what designs do and then describe ways to establish functions.
6.1.1 Functions: Input Is Transformed into Output
We begin with our dictionary definition from Chapter 1:
- function n: those things a designed device or system is supposed to do.
For our work as designers, it is helpful to take a systems view and relate doing something to transforming an input into an output. Of course, this is also reminiscent of elementary calculus in which we write y = f(x) to denote how the function f(x) transforms the input of the independent variable x into an output of a dependent variable y. For most of our purposes, engineering functions involve the transformation or transfer or flow of energy, materials, or information. We frequently view such transformations through the prisms of the conservation and balance principles that we detail when we discuss physical modeling in Chapter 9.
We see energy in mechanical, thermal, fluid, or electrical forms, and we see energy transformed as it is stored, transmitted, converted, or dissipated. We also view energy transformation or transfer to include forces transmitted or used to support (conservation of momentum or balance of forces), current flows (conservation of charge), and so on. We must account for all of the energy going into and coming out of a device or a system. This does not mean that the device or system is an ideal one in which energy is conserved. Rather, it means that energy can't simply disappear, even when it is dissipated.
Similarly, materials flow occurs in a variety of ways: moving or flowing through some conveyance (like a pipe), being transferred or located in a container, being separated into constituents, or added to, mixed in with, or located within one or more materials. Thus, cement, aggregate, and water are mixed to create concrete, which is then typically moved (while being mixed), poured, finished, and allowed to set and harden.
Finally, information flow includes the transfer of data in any of several forms: tables and charts on paper, data transmitted over the Internet or by wireless, and electrical or mechanical signals transmitted to sense or measure behavior or control response. The transformation of information occurs when, for example, a room temperature measured by a thermometer is transmitted to a wall thermostat that then instructs a heater or an air conditioner to change what it is doing. We might even think of the energy that is required to turn data into information and information into knowledge.
6.1.2 Expressing Functions
Given that functions are the things that a designed device must do, the statement of a function typically couples an action verb to a noun or object: lift a book, support a shelf, transmit a current, measure a temperature, or switch on a light.
The object in a verb–noun formulation function may start off with a specific reference to a particular design idea, but it is usually best to look for more generality. For example, while one bookcase function is “support books,” bookcase shelves often support trophies, art, or even piles of homework. Thus, a more general, more useful statement of the function to be performed is to “resist forces due to gravity,” which can in turn be associated with any objects weighing less than some predetermined weight (i.e., force): support a given number of kilograms (or pounds). When describing functions, then, we should use a verb–noun combination that best describes the most general case.
Similarly, we also should avoid tying a function to a particular solution. If we were designing a cigarette lighter, for example, we should avoid “applying flame to tobacco” because it eliminates car lighters that use electrical resistance in a wire. That specific formulation also eliminates using the lighter to ignite paper, wood, or charcoal briquettes.
We can also categorize functions as being either basic or secondary functions. A basic function is the specific, overall function that must be performed, and secondary functions are (1) other functions needed to perform the basic function or (2) those that result from doing the basic function. Secondary functions maybe categorized further as either required or unwanted functions. Required secondary functions are those needed for the basic function. For example, the basic function of an overhead projector is to project images. This requires several secondary functions, including converting energy, generating light and focusing images. The projector also produces unwanted secondary functions such as generating heat and generating noise. Of course, such undesirable by-products may also spawn new required functions, for example, quieting noise or dissipating generated heat. This last example also suggests that we should try to anticipate all secondary functions, lest they turn into undesirable unanticipated side effects that may significantly affect how a new design is perceived and accepted.
6.2 FUNCTIONAL ANALYSIS: TOOLS FOR ESTABLISHING FUNCTIONS
We now provide several tools to do functional analysis, that is, to establish the functions that our design must perform. Our starting point will be the notion of the design as transformer of inputs to outputs: We define the boundary between our device and its surroundings, and then examine the inputs to and outputs from the device that cross that boundary. We (1) track the flow of energy, materials, or information through the device's boundary, and (2) detail how those inputs are used, converted, or otherwise processed to produce the desired functions. The device itself, contained within the specified boundaries, may be a “black box” if we've no idea what's inside, or a “transparent” box if we do. We will also describe three other tools used to establish functions: enumeration, dissection or reverse engineering, and function–means trees.
6.2.1 Black Boxes and Glass Boxes
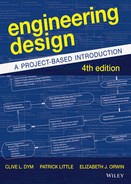
One tool for understanding the connections between inputs and outputs is the black box: a graphic of the system or object being designed, with inputs shown entering the box on its left-hand side and outputs leaving on the right. All of the known inputs and outputs should be specified, even undesirable byproducts that result from unwanted secondary functions. For example, consider the black box for a power drill shown in Figure 6.1. We can think of the power drill (system) as a box that transforms the controlled power input into a rotating chuck, in which we can insert a drill bit to drill a hole or a screwdriver blade to drive a screw. At the top level, we can think of a power drill as having just three inputs: a source of electrical power (electrical energy), a supporting force (mechanical work) that holds or grasps the drill, and the control of speed and direction (information) of the drill chuck's rotation. The drill has two outputs: a rotating chuck and a force holding the drill. (We will ignore heat generation and losses in this example.)

Figure 6.1 A “black box” for a power drill with inputs and the output is encapsulated in one basic function: provides powerto a screw. We take the cover of this black box in Figure 6.2.
A top-level black box such as that shown in Figure 6.1 almost certainly prompts more questions than answers: How does this actually happen? What functions are performed in a power drill? Can we identify all of the (many) subfunctions performed inside of the power drill's black box? We begin to answer these questions by taking the cover off this black box and turning it into a glass box or a transparent box (Figure 6.2). (We will see another set of answers to these questions when we dissect this drill later in the chapter.) The glass box exposes several new boxes within the original (black) box, each of which represents a subfunction that must be performed to support the drill's overall functionality. These new boxes include a power cord (8) transmitting electrical power into the drill, where a switch (6) both directs that power and transmits information about its level to a universal motor. The universal motor converts the electrical power into mechanical power and transmits that power and information about its level to the transmission. The transmission increases the torque output by, in this particular drill, reducing the speed of power transmission from the 30,000 rpm of the rotor (1) in the universal motor to a (peak) output of 2500 rpm for the rotating chuck (13). Note that even in this brief description, it is often difficult to describe everything that happens at the same level of detail. If we were assembling this drill from known components or parts, we might have enough information to stop at this level. The recurring theme is that black boxes are made transparent when we ask how inputs are transformed into outputs, to the level that we need to fully achieve the top-level functionality of our design.
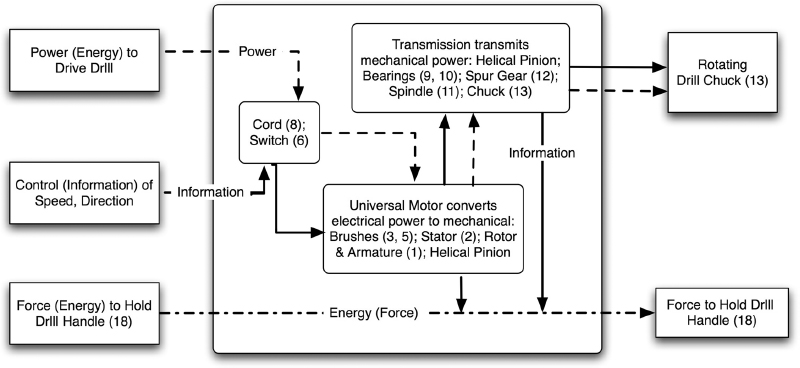
Figure 6.2 The cover on the black box of Figure 6.1 has been removed, “drilling down one level” to make it transparent (i.e., a glass box), thus exposing a large number of secondary functions that are needed to perform the top-level functions. Compare this with the exploded view of the drill in Figure 6.3.
It is important that we reflect the underlying physics and express the inputs in those terms when we're applying the black-to-glass box approach. In the drill example, we didn't just hold and point the drill, we provided a force to hold it and information to both direct it and control its speed. Similarly, if we were doing this exercise for an old-fashioned radio, we would recognize that tuning a radio means selecting a particular frequency in the radio frequency (RF) spectrum, not just turning a dial.
The black-to-glass box idea can also be used effectively for systems or devices that do not have a physical box or housing. The only requirements for using black and glass boxes are that the device's boundary is specified and all of the inputs and outputs are identified.
We must be careful when we set the boundary of a system or subsystem whose functions we are identifying with the black-to-glass box tool because there is a trade-off. If we set boundaries too broadly, we may incorporate functions that are beyond our control, for example, generating household electric current for the drill or radio. If we draw boundaries too narrowly, we may limit the scope of the design. For example, the radio output could be an electrical signal that is fed to speakers, or it could be the acoustic signal coming from speakers. So, is the boundary drawn to include the speakers, or not? Such decisions should have been resolved during problem framing, when the problem's scope was set.
6.2.2 Dissection or Reverse Engineering
Our second functional analysis tool reflects the curiosity that most engineers feel. When confronted with a button, knob, or dial, they ask, “What does this do?” And they follow up with “How does it do that?” or “Why would you want to do that?” Questions like these, as well as following thoughts on how we might do it better or differently, form the core of dissection or reverse engineering. We reverse engineer a device or system that does some or all of what we want our design to do when we take it apart: We dissect, deconstruct, or disassemble it. We do this to find out in detail just how it works so we can then apply what we learn to our own design problem. We may not be able to use that design for any number of reasons: It may not do all the things we want, or may not do them very well; it may be too expensive; it may be protected by a patent; or it may be our competitor's design. But even if all of these reasons apply, we often can gain insight into our own design problem by looking at how others have thought about the same or similar problems. (Remember: Design problems are open-ended because they typically have several acceptable solutions!)
Reverse engineering is, in principle, a simple process. We look at the parts (e.g., gears, levers, circuit elements) that are used in a design or a device, and ask what functions those parts perform. We then look for alternative ways to do the same thing(s). For example, a button on an overhead transparency projector, when pushed, turns on the projector. To perform the function of turning the projector on or off, we might consider toggle switches or bars along the front of the projector.
We showed in Figures 6.1 and 6.2, respectively, black and glass boxes for a considerably more complicated device, a power drill. In Figure 6.3 we show an exploded view of a DeWalt™ corded power drill (Model D21008K). The individual pieces in that exploded view are the physical counterparts of the major subsystems we detailed in the glass box. We see an actual power cord (8) and a switch (6) connected to pieces of a motor (3, 5, 2, 1) and of a transmission (9, 10, 12, 11, 13). We ask what these pieces do, and find that the cord transmits electric energy, the switch controls the input of that energy, the motor turns the electrical energy into mechanical energy, which the transmission uses to control the drill's torque output. This “visual” inspection, actually the dissection or reverse engineering of the drill, produces the same functional analysis that we found with the black-to-glass box analysis.
We have already noted that there are often good reasons why we can't use a particular device or design we're dissecting. First, that device or design was developed to meet the goals of a particular client and a target set of users, and they may have had different concerns than we have. We have to remember to stay focused on our client's project. Second, adapting a new subfunction or new means for a function from the dissected device might limit how we think about our project. For example, if we become captive to a really nifty switch for turning on the power to a stand-alone overhead projector, we might not think about incorporating a projector's controls with a room-based approach, where the controls are integrated and mounted in a wall panel or on a lectern or a keyboard. This is a reinforcement of what we said earlier: We should try to define functions as broadly as we can, and with as much attention to the physics as possible. If we restrict ourselves to the most immediate expression of functions found in someone else's design, we limit our creative possibilities—and we may well run into serious intellectual property and ethical issues.
Finally, while we treat the terms reverse engineering and dissection as equivalent in the context of engineering design, in other fields dissection may be seen as purely descriptive: We dissect something just to reveal its underlying physical structure. In reverse engineering, we try to be analytical as we look at the same physical structure in order to identify the means to make functions happen, that is, we are trying to analyze both the functions of a device and how those functions are (and can be) implemented.
6.2.3 Enumeration
Another basic method of determining functions for a designed object is to simply enumerate or list all of the functions that we can readily identify. This is an excellent way to begin functional analysis because it leads us immediately to the basic function(s) of the device. It may be problematic for determining secondary functions, however, because a lot of specific engineering background might be required. Consider the drill in Figure 6.3: It would hard to be much more specific than our black box for the drill (Figure 6.1) without knowing about gears, motors, switches, and so on. Thus, we might get “stumped” very early in this process. However, enumeration is more than just making a list. Successful enumeration requires thoughtful questioning—much in the spirit of design as questioning—so we now provide some useful “tricks” to extend our enumerative thinking.

Figure 6.3 An exploded view of the major subsystems in a DeWalt™ corded power drill, Model D21008K, showing several major subsystems: switch (6); universal motor consisting of brushes (3, 5), stator (2), rotor and armature (1), helical pinion; transmission consisting of helical pinion, bearings (9, 10), spur gear (12), spindle (11) and chuck (13); and the clam shell cover in the upper left. Courtesy of Black & Decker Corporation.
One such trick is to imagine that object X ceases to exist by asking, “What happens if there is no X?” If a bridge disappeared entirely, for example, any cars on the bridge would fall into the river or ravine over which the bridge crosses. This suggests that one function of a bridge is to support loads placed on the bridge. If the abutments ceased to exist, the deck and superstructure of the bridge would also fall, which suggests that another function of the bridge is to support its own weight. (This may seem silly until we recall that there have been more than a few disasters in which bridges collapsed because they failed to support even their own weight as they were being built! One of the most famous of such infelicitous bridge designs is the Quebec Bridge over the St. Lawrence River: It collapsed in 1907 with a loss of 75 lives, and again in 1916 when its closing span fell down.)
Similarly, if the connections of a bridge to various roads disappeared, traffic would not be able to get on the bridge, and vehicles on the bridge could not get off. This suggests that another function that a bridge serves is to connect the river/ravine crossing to a road network. If the bridge's road dividers were deleted, vehicles headed in one direction could collide with vehicles headed in the other. Thus, another bridge function is to separate traffic, a function that can be accomplished in several ways: New York's George Washington Bridge puts different traffic directions on different levels. Other bridges use median strips.
Another way to determine an object's functions is to ask how it might be used and/or maintained over its life. For example, to maintain our bridge we'd want to provide access to both inspectors and painters, which could be done with several means (e.g., ladders, catwalks, elevators). Similarly, we might think about the lifecycle of our juice container design. We can easily list the functions performed by a juice container because we use them all the time:
- contain liquid;
- get liquid into the container (fill and seal the container);
- get liquid out of the container (empty the container);
- close the container after opening (if it is to be used more than once);
- resist forces induced by temperature extremes;
- resist forces induced by handling in transit; and
- identify the product.
We note that the functions of containing liquid and of filling and emptying the container are distinct, which is consistent with our experience: Liquid is poured in before the container is sealed by a permanent top, and emptying may be enabled by a pull tab. These functional distinctions (i.e., between filling, containing, and emptying) emerge when we considered the container's lifecycle.
At the heart of our approaches to function enumeration lie the dual needs to ask thoughtful questions and to properly use verb–noun pairs to express each and every function of the designed object.
6.2.4 Function–Means Trees
No matter how much we are warned against “marrying your first design” or cautioned against trying to solve design problems before we fully understand them, we often jump to early design ideas because of the functions we do see. Consider a handheld lighter. Here we use a flame to ignite leafy materials (i.e., tobacco), as opposed to an auto's lighter, which uses resistance heating. The handheld lighter likely requires that we shield the flame against wind, a secondary function we do not need for the auto's lighter. A function–means tree is a tool that helps us sort out secondary functions in cases where different means or implementations can lead to different subfunctions.
A function–means tree is a graphical representation of a design's basic and secondary functions. The tree's top level shows the basic function(s) to be met. Each succeeding level alternates between showing:
- the means (in trapezoids) by which the primary function(s) might be implemented, and
- the secondary functions (in rectangles) necessitated by those means.
We show a function–means tree for a handheld lighter in Figure 6.4. Note that the top-level function has been specified in the most general terms possible. At the next level, a flame and a hot wire are given as two different means. These two means imply different sets of secondary functions, as well as some common ones. Some of these secondary functions and their possible means are given in lower levels.
Once a function–means tree has been developed, we can list all of the functions that have been identified, noting which are common to all (or many) of the alternatives and which are particular to a specific means. Functions that are common to all of the means are likely to be inherent to the problem. Others are addressed only if the associated design concept is adopted after evaluation.
A function–means tree is also useful because it begins the process of relating what we must do to how we might do it. We will return to this issue in Chapter 7 when we introduce the morphological chart as a tool to help us generate design alternatives. The “morph” chart lists the functions of the designed device and the possible means for realizing each function in a matrix format. The effort we put into the function–means tree (now) will really pay off (then)!
As with all tools, function–means trees must be used carefully. First, a function–means tree is not a substitute either for framing the problem or for generating alternatives. It may be tempting to use the outcome of the function–means tree as a complete description of our available alternatives, but we will almost certainly restrict the design space much more than we have to. Second, a function–means tree should not be used alone, that is, without using some of the other tools described above. Sometimes people adopt a tool because it somehow “fits” with their preconceived ideas of a solution, a mistake akin to “marrying your first design” or reinforcing preconceived ideas. Because the function–means tree allows us to work with appealing means or implementations, we may overlook functions that might have turned up with a less “solution-oriented” technique.
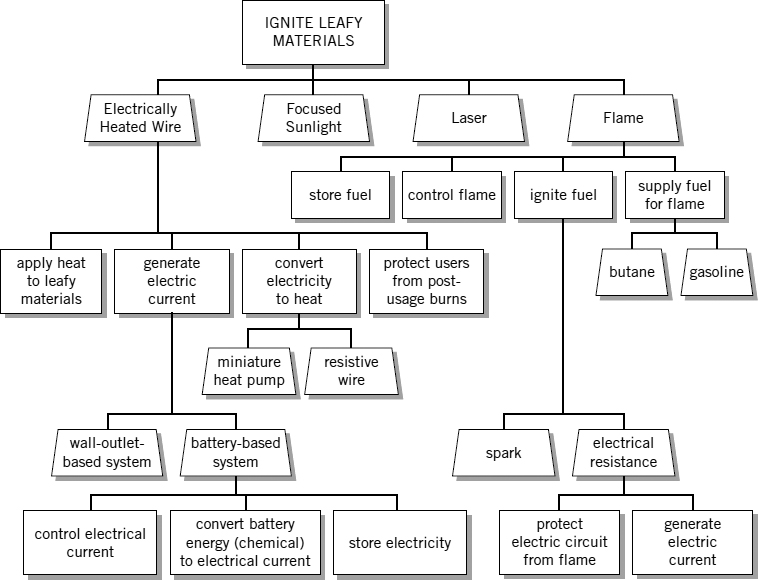
Figure 6.4 A function–means tree for a lighter: functions in rectangles, means in trapezoids. Note that means produce different subfunctions.
6.2.5 Remarks on Functions and Objectives
It is often easy to mistake objectives for functions and functions for objectives. This happens because objectives sometimes express a functional need. For example, a bookshelf design might have as an objective that it hold the complete Harry Potter and The Lord of the Rings series of fables, whereas the specifications include both a function (i.e., support the weights of those collected sets) and a requirement that the shelf has the feature of being long enough to accommodate all 10 volumes in hardback editions (7 of Harry Potter, 3 of The Lord of the Rings).
We pointed out in our discussion of objectives trees in Section 4.1.2 that we are nearing the end of the objectives tree when the why question turns toward how, meaning that functions may begin emerging as ways to achieve objectives. We can reduce the confusion between objectives and functions if we keep in mind that objectives are expressed as are or being adjectives while functions are expressed as active do or doing verb–noun pairs. In fact, as we noted in our discussion of the objectives tree for the juice container in Section 4.1.3, another way that we might identify functions is by examining and rewriting detailed subobjectives because they suggest functions. So the subobjective Shock Resistant suggests the function Resist Shock. Recognizing the similarities and the differences of objectives and functions is quite important, as a lot of serious design practice will confirm.
6.3 DESIGN SPECIFICATIONS: SPECIFYING FUNCTIONS, FEATURES, AND BEHAVIOR
We noted in Section 6.1 that determining the functions of a designed object or system is essential to the design process. Functional requirements don't mean much if we don't consider how well a design must perform its functions. For example, if we want a device that produces musical sounds, we must specify how loudly, how clearly, and at what frequencies the sounds are produced. Earlier, in Chapter 1, we had noted that design specifications or requirements specify in engineering terms a design's functions, as well as its features and behaviors. Such requirements, often called “specs,” provide a basis for determining a design because they are the targets against which we measure our success in performing or achieving them. Design specifications are presented in three forms that represent different ways of formalizing a design's functional performance and its features and behaviors for engineering analysis and design:
- Prescriptive specifications specify values for attributes of design. Thus, for our children's juice container we might say, “A juice container must be made of at least 50% recyclable plastic.” For a ladder design we might say that “A ladder step shall be made from Grade A fir, have a thickness of at least 0.75 in., have a length that does not exceed 80 in., and be attached to the side rails through a full-width groove at each end.”
- Procedural specifications specify procedures for calculating attributes. So we would say: “The juice container must be disposable as stipulated by EPA standards.” In a ladder design we might specify: “The maximum bending stress σmax in a ladder step shall be calculated from σmax = Mc/I and shall not exceed the allowable stress σallow.”
- Performance specifications specify performance levels that a function must demonstrate to be successful. Then we would say: “A juice container must contain 75 ml.” And for the ladder project we'd say: “A ladder step shall support an 800 lb gorilla.”
In addition, if a system or device has to work with other systems or devices, then we must specify how those systems interact. We call these particular requirements interface performance specifications.
6.3.1 Attaching Numbers to Design Specifications
It is normally the designer's job to express functions in engineering terms so that engineering principles can be appropriately applied to the design problem at hand. As designers, we have to cast functions into terms that enable us to measure how well a design realizes a specific function. That means that we have to establish both a range over which a measure is relevant to our design and the extent to which ranges of improvements in performance really matter.
When we talk about measuring the performance of a function, we are describing something that is conceptually the same as the metrics we introduced to measure the achievement of objectives. The thinking is very similar, so some of what we detailed in Chapter 4 about constructing metrics might be useful in this context, as what we say below is also relevant to thinking more deeply about objectives. But there are some key differences:
- We have reserved the term metrics to apply only to scaling objectives.
- We need a metric for each of the objectives that we will use in evaluating our design choices.
- We use specifications to scale functions.
- We need a specification for every function our design must perform, and designs must meet each and every specification. In fact, in some sense being fully functional can be considered a constraint on the design.
- Metrics are applied in the past tense, to assess whether objectives have been achieved.
- Specifications, such as constraints, are projected into the future, when we specify in advance the functional or behavioral performance that must be achieved in order for a design to be considered to be successful.
How do we determine the range over which a measure is relevant to a design and decide how much improvement is worthwhile? Our conceptual starting point is similar to what economists call a utility plot (see Figure 6.5(a)): It graphs the usefulness of an incremental or marginal gain in performance against the level of a particular design variable.
Figure 6.5 Saturation curves showing that no additional benefit is achieved below some minimal realized level and above saturation. The actual shape of the hypothetical curve (a) is likely to be uncertain in most cases, while the linear approximation (b) is a design team's effort to make the meaning more useful by making the curve crisper.
We usually plot the utility or value of a design gain as the ordinate (y-axis) and normalize it to the range from 0 to 1. We plot the level of the attribute being assessed on the abscissa (x-axis). For example, consider using processor speed as a measure of a laptop computer performance. At processor speeds below 1 GHz, the computer is so slow that a marginal gain from, say, 500 to 750 MHz provides no real gain. Thus, for processor speeds below 1 GHz, the utility is 0. At the other end of the utility curve, say, above 5 GHz, the tasks for which this computer is designed cannot exploit additional gains in processor speed. For example, browsing the World Wide Web may be more constrained by typing or communication line speeds, so that an incremental gain from 5 to 5.1 GHz doesn't change the normalized utility of 1. Thus, the utility plot is saturated at high speeds.
What happens at performance levels between those that have no value and those at or above saturation, say in the range 1–5 GHz for the computer design? We expect that changes do matter in this range, and that we will see incremental or marginal gains with increases in processor speed. In Figure 6.5(a) we show an S- or saturation curve that displays qualitatively the gain achieved as a (qualitative) function of the processor speed: No numerical values are attached to either axis. Thus, while no specific value of gains can be determined from the curve, the S-curve demonstrates zero utility at low processor speeds, shows a measurable increase over a range of processor speeds, and then plateaus (or saturates) at 1 because increased processor speeds produce no gains in utility.
The sort of behavior seen in a utility plot is rather common. We don't always know the precise details of the S-curve: It may not look nearly as smooth as what we have sketched in Figure 6.5(a), so we approximate it by a set of straight lines, as we show in Figure 6.5(b). We still see regions where gains have no utility or are unavailable, as indicated by the horizontal lines at levels 0 and 1. In the range of interest, however, we model our utility level as a linear function of the design variable (e.g., processor speed). We are simply saying, qualitatively, that the linear curve defines a range within which we can expect to achieve gains by increasing the relevant design variable and, conversely, reduce gains by decreasing that design variable.
To take another example, suppose we are asked to design a Braille printer that is quiet enough to be used in office settings. None of the competing designs are quiet enough to be so used. How quiet does this design really have to be? To answer this question, we must determine the relevant units of noise measurement and the range of values of these units that are of interest. We should also find out how much noise is generated by current printer designs and whether listeners can distinguish different designs by their noise levels. If one printer produces the same noise level made by a pin dropped on a carpet, while another generates the noise level of a ticking watch, we would likely view both as quiet enough to be fully acceptable. Similarly, if one printer is as loud as a gas lawn mower, and another as an unmuffled truck, we gain no utility by distinguishing between these two designs as neither would be used in an office. (Note that this example shows a reverse S-curve in which we start at saturation because there is no gain to be made at such low levels of quietness, and then we degrade to a level of no utility for printers that are uniformly too loud.)
Since we measure sound intensity levels in decibels (dB), we know that some dB range is likely to be of interest, but what range? We answer this question by seeing how much noise is produced by other devices, and within different environments. We show sound intensities for various devices and environments in Table 6.1. With such environmental and exposure information in hand, we can identify a range of interest for a performance specification for the Braille printer. New printer designs must generate less than 60 dB of noise in an office, and lower generated noise levels are considered gains, down to a level of 20dB. All designs that generate less than 20 dB are equally good. All designs that produce more than 60 dB are unacceptable. Note that the printer noise levels we're talking about here are well below the limits that OSHA, the U.S. Occupational Health and Safety Administration, prescribes for occupational safety.
TABLE 6.1 Sound intensity levels that are produced by various devices and are measured in various environments. Sound intensity levels are measured in decibels (dB) and are a logarithmic expression of the square of acoustic power. Thus, a 3dB shift corresponds to a doubling of the energy produced by the source, while the human ear cannot distinguish between levels that differ by only 1 dB (or less)

6.3.2 Setting Performance Levels
To set performance levels, we first identify design variables that reflect the functions that must be performed and the units in which those variables are measured. Then, assuming a standard or linearized S-curve, we establish the range of interest for each design variable by identifying the following: a threshold below which no meaningful gains can be made; a saturation plateau above which no useful gains can be achieved; and a range-of-interest zone that lies between the threshold and the plateau. It is within this zone that we map the design gains onto the design variables that are the subject of our performance specification. This works well if we exercise judgment in setting performance requirements based on sound engineering principles, an understanding of what can and cannot be reasonably measured, and an accurate reflection of both client's and users' interests.
Consider once again the juice container. Each of the functions specified in Section 6.2.3 has a range of values that must be specified. Some of those functions and some relevant questions associated with each function are as follows:
- Contain liquid: How much liquid must the container contain, and at what temperatures? Is there a range of fluid amounts that we can put into a container and still meet our specification?
- Resist forces induced by temperature extremes: What temperature ranges are relevant? How might we measure the forces created by thermal stresses on the container designs?
- Resist forces induced by handling in transit: What is the range of forces that a container might be subject to during routine handling? To what degree should these forces be resisted in order for the container to be acceptable?
Note that similar but distinct problems arise for the second and third functions on this list, as they both relate to forces.
We can now specify a set of performance specifications that the container designs should meet by addressing these and similar questions. For example, we might indicate that each container must hold 12 ± 0.01 oz. In this case our requirement has become a constraint because the corresponding utility plot is a simple binary switch: Either we meet this design specification or we don't. (Of course, we could study the container design problem as one in which the variable is a single-size serving, in which case we may find a reverse S-curve showing that a smaller container is better.) We might generate another performance specification by insisting that the containers can be filled by machines at a rate of 60–120 containers per minute (cpm). The threshold of 60 cpm might derive from the volume of sales needed to penetrate a market, while a saturation plateau of 120 cpm faster rate might exceed demand projections.
We might also specify that the designs should allow the filled containers to remain undamaged over temperatures from −20 to +150 °F. Temperatures lower than a threshold of −20 °F are unlikely to be encountered in normal shipping, while temperatures higher than a +150 °F plateau indicate a storage problem. It may be that some designs that appeal in other ways are limited here by either temperature extreme. We have to make a judgment about the importance of this function and its associated performance specification.
We also note that manufacturers or distributors often publish a product's performance specification after the product has been sent to market because users and consumers want to know whether the product is appropriate for their intended use. End users, however, are usually not parties to the design process, and so they depend on published performance specifications to know what they can expect from a product. In fact, designers often examine the performance specifications of similar or competing designs, in a manner much like reverse engineering, to gain insight into issues that may affect end users.
6.3.3 Interface Performance Specifications
As we noted earlier, we use interface performance specifications to detail how devices or systems must work together with other systems. These specifications are particularly important in cases where several teams of designers are working on different parts of a final product, and all of the parts are required to work together smoothly. For example, the design of a car radio must be compatible with the space, available power, and wiring harness of the car.
With such complexity, boundaries between subsystems must be clearly defined, and anything (i.e., energy, material, information) that crosses a boundary has to be specified in sufficient detail to allow all teams to proceed. These specifications may be a range of values of variables, physical or logic devices that support a boundary, or perhaps they are simply an agreement that a boundary cannot be breached (say between subsystems). In each case, designers of artifacts on both sides of a boundary must have a common understanding about where the boundary is and how it might be crossed, if at all. Reaching such understanding is hard because teams on both sides of a boundary are, in effect, placing constraints on their counterparts on the other side. A black-to-glass box analysis can be helpful in developing interface requirements because it allows all of the parties to identify the inputs and outputs that must be matched and so deal with any side effects or undesired outputs.
Interface performance requirements are increasingly important for large firms that, in a highly competitive international arena, are trying to minimize the total time needed to design, test, build, and bring to market new products. Most of the world's major automobile companies, for example, have reduced their design and development times for new cars to less than one-half of what they were a decade ago by having design teams work concurrently, or in parallel, on many subsystems or components. This means the teams must work together, and it puts a premium on understanding and working with interface performance issues.
6.3.4 House of Quality: Accounting for the Customers' Requirements
We now turn to a twofold task, ensuring a design's quality, and as part of that, ensuring that we've paid proper attention to what the customer would like to see in our design. What do we mean by design for quality? One answer is simple: Quality is “fitness for use,” that is, quality is a measure of how well a product or service meets its specifications and requirements. By this definition, much of the problem framing activities discussed heretofore are aimed toward a “quality” design that meets or exceeds objectives, satisfies all constraints, and is fully functional—as well as or better than alternative designs. In that sense, all of our conceptual design work is directed to design for quality.
We also note that while detailing the attributes (i.e., the functions, features, and behaviors) so far, we have taken great care to stay aware of what the client wants, but we haven't paid much attention to what users might need or want in a product. One of the most important notions used by many designers is quality function deployment (QFD), which is expressed in a tool called the House of Quality (HoQ). A HoQ is a matrix that combines a lot of information about stakeholders, desirable characteristics of designed products, current designs, performance measures, and trade-offs. We show the general structure of a HoQ in Figure 6.6; it clearly shows a metaphorical house. The HoQ's Who refers to the stakeholders in the design process: client(s), users, and other affected parties. The What entries correspond to the design's desired attributes (i.e., objectives, constraints, functions) objectives. The Now entries refer to existing products or designs that are typically found during problem definition, and they are used for benchmarking proposed designs. The How elements refer to the metrics for objectives and the specifications for functions. The entries How Much or Target are goals or targets for the What entries. The remaining sections are devoted to the relationships, values, or trade-offs among the elements we've just described. These sections become much clearer if we look at a specific example.

Figure 6.6 An elementary abstraction of a House of Quality that displays and relates stakeholder interests, design attributes, measures, targets, and current products. The HoQ helps designers explore relationships among them. After Ullman (1997).
Consider using a HoQ to explore a housing for a laptop computer (Figure 6.7). A computer maker might want to explore designing computer housings that work for both office computers and laptops. The stakeholders include traveling users, office users, and the manufacturer's production group. In the Who versus Whats section, we see that travelers place a high priority on objectives lightweight and durable, while office users are more interested in inexpensive and adaptable. Then, if we had two existing designs, one a standard laptop case and the other a standard desktop/tower casing, we would see in the Whats versus Hows section that the costs (of raw materials and of assembly) are strongly related to inexpensive, while number of parts relates to inexpensive only weakly. Similarly, the number of cards and ports that can be accepted is also modestly related to inexpensive because they require added assembly work or more parts. Now versus What is the result of benchmarking the two existing design choices: It highlights the possibility that a “universal” housing might be able to satisfy more users in total if it can address the shortcomings of either design. Finally, the roof of the house shows some of the relationships and trade-offs that designers will need to consider. Making the case lighter, for example, is likely to trade off negatively with resistance to forces. Similarly, increasing the number of parts is likely to result in higher assembly costs.
This simple example shows that the house of quality can help tie together many of the concepts we have thus far described. When would we introduce a HoQ into our design process? There's no obvious answer. A HoQ is useful for gathering and organizing information, and for fostering discussions within a design team and with stakeholders. On the other hand, building a HoQ entails a lot of time and effort. So whether, and when, to build a HoQ are decisions that can only be made by a design team in the context of its design problem.
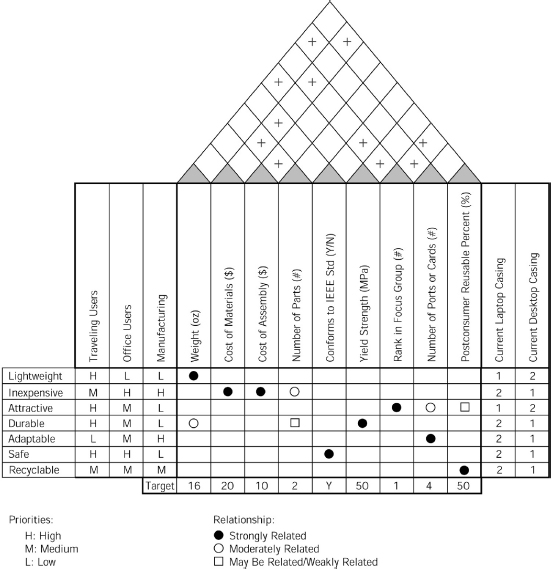
Figure 6.7 A first-draft HoQ for the design of a computer housing for a laptop and an office computer. Note that different users may have different priorities, and the roof of the house helps identify trade-offs between various objectives and features and behaviors.
6.4 FUNCTIONS FOR THE DANBURY ARM SUPPORT
We now continue our case study of how the E4 design teams designed a support arm for a student with CP.
The support arm must perform a number of functions in order to enable her writing and drawing. Teams A and B both used enumeration to develop their lists of functions, which are shown in Tables 6.2 and 6.3. Notice that many of Team A's functions are passive, that is, they are expressed as “enable …” While this is not unusual as a starting point for functional analysis, it is much better to express functions with active verbs because they are easier to translate into performance specifications. For example, “Enable size adjustability” might mean “Adjust size” or “Adjust to a (specified) range of sizes,” or both. In this case, a passive formulation is ambiguous. Similarly, “Enable adjustable orientation” can be more clearly stated as “Adjust orientation,” or as “Adjust to a (specified) range of orientations,” or both.
Some of the functions listed in Table 6.2 are vague, so it is hard to identify means to perform those functions or to specify their actual performance. For example, the function “Resist environmental damage,” could almost be an objective, and does not identify particular environmental threats. (Similar concerns can be raised about “Prevent physical pain” and “Provide comfort.”) To be fair, the team did provide some explanation of their functions. For example, on environmental issues the team wrote: “The device will sustain minimal damage if exposed to water, air moisture, dirt, dust, or other environmental factors in order to maximize the lifetime of the device.” This explanation does provide more detail, but still leaves open “other environmental factors”—and it also suggests another objective, namely, “to maximize the lifetime of the device.” Further, neither the stated function nor its explanation provide any quantification of how much exposure to various damaging agents the device is expected to survive. We don't mean to be unduly critical of our students' work, especially because expressing functions requires some very fine balancing: We have to write functions in sufficiently general terms that don't imply specific solutions, but we also need enough specificity so that their meaning is unambiguous and can be translated into meaningful specifications.
TABLE 6.2 Team A's list of functions for the Danbury CP support arm
| Attach to something secure
Stay secure on arm Support Jessica's arm Decrease the magnitude of exaggeration Enable size adjustability Enable adjustable resistance/support Enable adjustable orientation Resist damage due to mishandling Resist environmentally induced damage Prevent physical pain Provide comfort |
Team B enumerated a sharper, more concise list of functions displayed in Figure 6.3. Most of the functions listed in Table 6.3 also appear in Table 6.2, and the function “Dampen motion,” seems to have the same intent as Team A's “Decrease the magnitude of exaggeration”; it could also be included in their function “Enable adjustable resistance/support” in Table 6.2. Similarly, the three adjustment functions of Table 6.2 (on size, resistance, and orientation) might be viewed as three articulated subfunctions of a single top-level function, “Enable adjustability”—which is more properly cast in Table 6.3 as the seemingly more active “Provide adjustability.” Likewise, the two functions “Prevent physical pain” and “Provide comfort” of Table 6.2 can also be viewed as more detailed expressions of the function “Provide comfort” of Table 6.3.
TABLE 6.3 Team B's list of functions for the Danbury CP support arm
| Attach to arm
Attach to stabilizing point Dampen motion Allow for range of motion Provide comfort Provide adjustability |
It ought to be noted that while “enable” and “provide” are verbs that qualify as literal parts of verb–noun pairings, they are generally passive verbs. Functions are better understood and translated into good specifications when they are expressed in active verbs. For example, a sharper version of “enable adjustability” is “adjust to user size.” Similarly, “cushion forces” is a more crisp formulation of “provide comfort.”
While neither team was specifically asked to produce a formal list of design specifications, Team A did produce specifications for the 11 functions; they are displayed in Table 6.4. While this set of specifications served Team A adequately for this project, they would clearly not be accepted as a formal set of specifications because they are not the rigorous engineering statements needed to specify, measure, and test the functional performance of a design. It is also clear from Table 6.4 (as well as the student team's actual final report) that the team viewed the specifications more with an intent to consider whether a final design was acceptable, which is understandable. But it is important to remember that specifications are used prospectively, to state precisely what has to be done to satisfactorily achieve a function, for example, “a structure must support a weight X,” as opposed to the retrospective “our structure supported weight Y.” (Both teams produced morph charts with their function lists, and they will be presented in Chapter 7.)
TABLE 6.4 The performance specifications for Team A's 11 functions as listed in Table 6.2. Note that the requirements are qualitative, rather than “hard” quantitative specifications
| Functions | Performance Specifications |
| Attach to something secure | |
| Attach securely to arm | Must not permit user to remove arm without assistance or use of free arm |
| Support Jane's arm | Once user raises arm to a specific height above arm rest, this height should be maintained without dropping or requiring user to apply muscle tension unless user chooses to change |
| Decrease the magnitude of the exaggeration of Student X's arm movements | As the user attempts to move her arm from point A to point B, the distance she ends at point B should be smaller than the distance if she were not using the device |
| Enable adjustability of size | Component containing/supporting user arm should have two settings:(1) fit to arm (to not allow play), (2) allow a little play |
| Enable adjustability of resistance/support | Three resistance settings: (1) none, (2) resist sudden jerks, (3) completely resist movement |
| Enable adjustability of orientation | Two stationary positions: (1) arm rest (just above arm rest of wheelchair), (2) work position (above table, next to canvas) |
| Resist damage due to mishandling | Maintain structure and form during mounting, dismount, and transport |
| Resist environmentally induced damage | Performance is not sensitive to dust, water, or paint |
| Prevent physical pain | User should not receive bruises, cuts, or experience strain |
| Provide comfort | Components containing/supporting arm contain some form of cushion or soft padding |
6.5 NOTES
Section 6.2: Further details about engineering functions and requirements can be found in Ullman (1997). The term glass box method was coined in Jones (1992). The function–means tree used was developed by a former HMC colleague, James Rosenberg, to illustrate an example originally proposed in Akiyama (1991).
Section 6.4: The results from the Danbury arm support design project are from the final reports by Attarian et al. (2007) and Best et al. (2007).