
The value of all things, even our lives, depends on the use we make of them.1
Value creation is at the heart of an economic enterprise, defining its capability to serve customers and generate profits and growth. This fact has led to an ever-increasing set of tools and techniques that start with customers, focusing on serving their preferences from the very inception of a product until its disposal. Most of these tools and techniques are based in either marketing or product development, with a constant eye toward helping companies capture more of the value created with their industry chains.
The focus of this book is on one specific, and overlooked, perspective on value creation—management accounting. Using the results of many years of field data collection, analysis, and development, a comprehensive model that captures the essence of the value creation process in diverse organizations is presented. Two key perspectives are taken into consideration in the discussion. First, the book emphasizes how companies can increase the value they create for customers—enhancing their product/service value proposition—by effective design of their products and services. This value needs to be effectively communicated to customers so that they can incorporate it in their buying decision.
The second major perspective is internally focused—helping companies eliminate the nonvalue-added activities that build waste, not value, into their products and services. By removing and minimizing wasteful work, more funds can be reinvested in value-added activities that help grow the top line of the business. It is a win-win solution that starts with understanding how customers perceive value.
The Concept of Value
Value is defined as the sum of perceived benefits received by the customer in return for the sacrifices made in terms of price paid, costs incurred, and effort spent in order to acquire a product or service.2 Value is the result of the amount of resources (time, money, and energy) expended by the final consumer in the entire value chain. Value is not created in the interchange of goods and services between trading partners—it does not exist until a willing consumer validates its existence.3 All trading partners contribute to the final value of a product or service as defined by the consumer, but they do not create value until the final consumer makes the decision to purchase the good or service at a specified price.
These facts place the consumer, as final arbitrator of exchange value, at the center of every business organization. If there is a chain of customers (a supply chain), then companies may have to deal with conflicting demands on their time and resources. How to choose among the demands of trading partners versus those of the final consumer is straightforward—the final consumer wins the debate. Throughout this book the final consumer will be the focus, with the term “customer” meaning the final consumer, not a supply chain partner.
That being said, cost can be incurred by companies in a supply chain that no consumer will pay for. So, it simply makes good business sense to seek to optimize the product and service offerings of the firm from the customer’s perspective regardless of where the company exists in the overall supply chain. Well-run companies can reap the larger shares of the consumer-defined value creation, or revenues, by managing their trading relationships efficiently and effectively. This is called value capture.4
Value from a Customer’s Perspective
Customers have well-defined expectations regarding the benefits they want, and perceive exist, in a product or service. For instance, customers value responsiveness to their questions and concerns when dealing with a product or service provider. Responsiveness is a common value attribute that makes up a customer’s profile, or list of valued product/service features. The customer has an entire list, consisting of multiple attributes that provide the basis for their final assessment of value delivered by a specific product or service. This list of value attributes, and the relative importance of each attribute in the buying decision, creates the opportunities for companies to maximize their reach to the consumer marketplace—to optimize their profit.
Every product or service presents the customer with a range of features, which is called the product’s or service’s value proposition. The value proposition is the sum of all the benefits promised to the customer and is the basis for customers making choices among competing products. The value proposition consists, then, of all of the value attributes embedded in a product or service. When asked to name these attributes, customers have very little trouble. Customers know what they are buying and why. While their reasons can range from something as specific as the size or weight of a product, through functionality, and even on to statements such as the product “makes me look cool,” customers can detail their wants (their value profile) and assess how closely a specific product or service matches their needs and wants.
Figure 1.1 summarizes the value creation process from a customer’s perspective. The expected benefits of the product or service are its value proposition. As noted, the expected benefits gained from these product, service, and cultural attributes depend on how closely they match the customer’s own value profile—their specific wants and needs. To gain these benefits, a customer incurs several types of costs. These not only include the transaction cost, or price paid to acquire the product or gain access to the service—the expected costs include the product’s or service’s life cycle costs (total cost of ownership for its useful life) and the riskiness of the purchase decision.
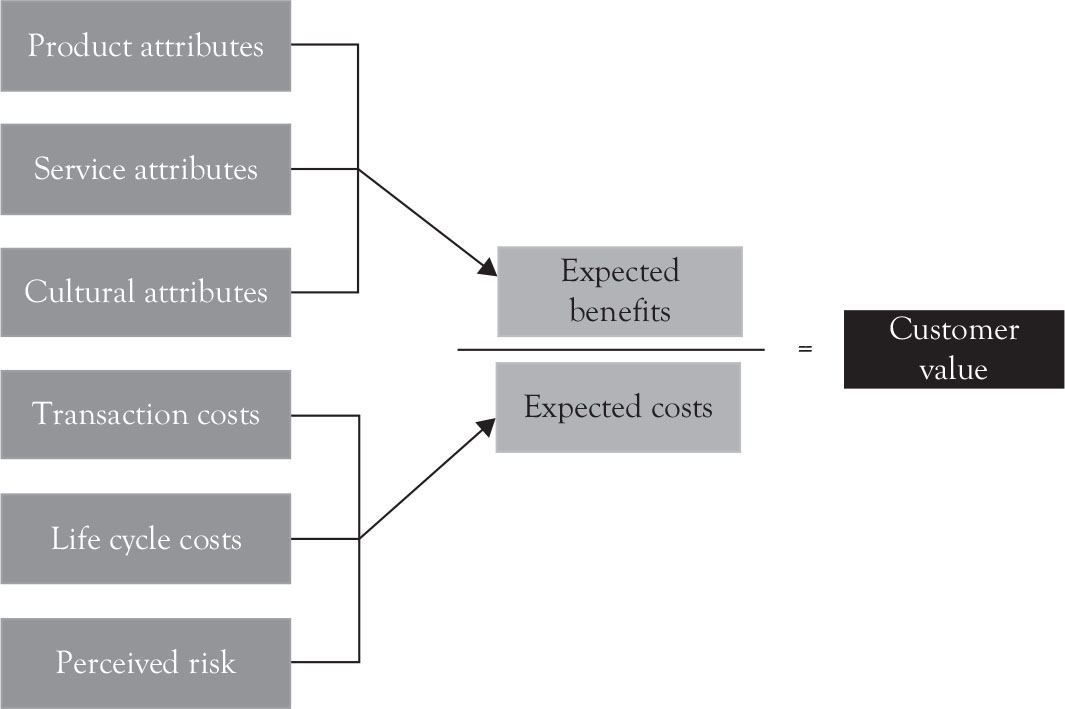
Figure 1.1. Value creation: the customer’s perspective.
The more a customer knows about a product or service, in other words the more often they purchase it, the lower the risk and overall transaction costs of the purchase. For instance, the decision to buy paper towels is shaped by the cumulative experience the customer has had with the specific brand of paper towels. Risk is low and the need to do prepurchase research is also low (low transaction costs), so the decision is easy to make.
When we talk about a major purchase, though, such as the purchase of a kitchen stove, a new car, or a new home, the decision becomes much more complex for the customer. Risk may be high because the decision comes with a high price tag and uncertainty regarding actual functionality and life cycle costs. The customer doesn’t make this decision often, so the search for information prior to purchase ramps up the transaction costs and risk even more. Clearly not all customers are equally informed, but all are faced with a much riskier choice when large ticket items are purchased than when daily usage items are obtained.
Let’s think about a fairly large purchase decision for a customer—choosing the windows for a new or existing home. While there are a broad range of providers of windows, the consumer has narrowed the choice down to two of the top selling brands—Andersen Windows and Pella Windows. The value attributes and relative weightings for the two different companies’ windows are in Figure 1.2.
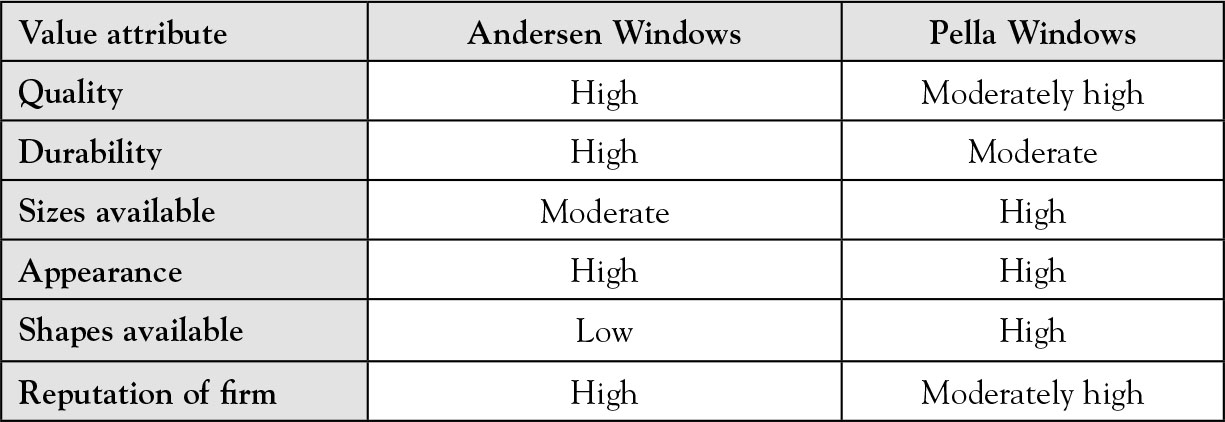
Figure 1.2. Comparative value propositions.
The value attributes driving the decision are the quality of the product, its durability, size selection, overall appearance, shapes available (design), and reputation of the firm. For a customer whose primary focus is on quality, durability, and reputation of the firm, Andersen Windows is the obvious choice. If, on the other hand, the customer is more concerned with choice in sizes and design to add an architectural feel to their home, they would tend to buy from Pella. Since an entire group of windows is purchased at once, the style variables can become quite important to the competiveness of the firm. They also lead to two different companies with two different value propositions for a window. The result is two very different customer value segments.
A Market-based View of a Company’s Value Creation Profile
Armed with this basic terminology, we can now create a different perspective on the challenge faced by a company in the marketplace. This perspective is provided in Figure 1.3. While the customer’s final choice of one product over another is based on the total package of value attributes provided, the choice decision translates this process into a single dimension—the price the selling company receives for the product or service provided.
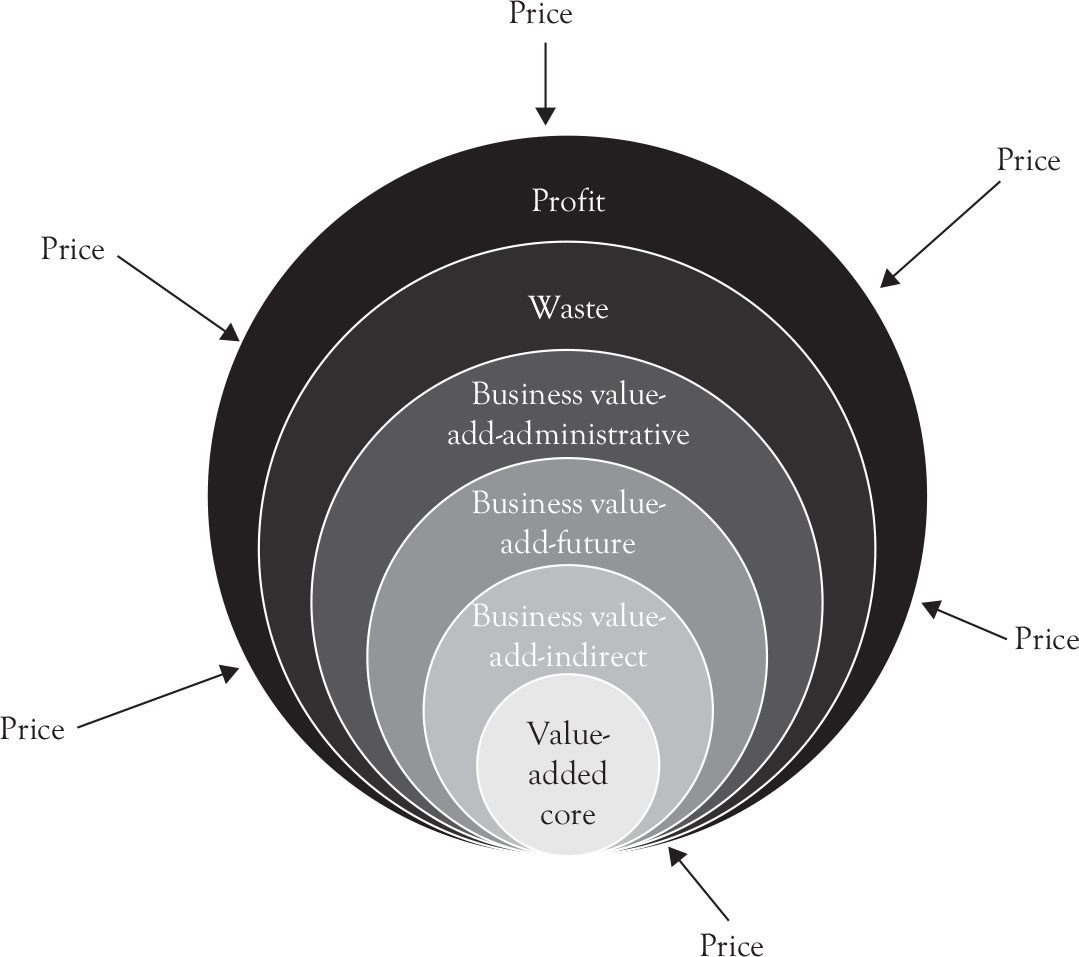
Figure 1.3. Value creation: a market perspective.
We now see several things of interest. First, the value-added core of attributes that customers have used in their purchase decision now makes up only part of the cost the company incurs in providing the product or service. For a well-run company, it is normal for this value-added core of attributes to consume 20–25% of the total costs of the firm. Clearly, there are other things the company spends its scarce resources on. To denote the majority of these, we’ve coined the term business value-add to recognize that there is a reason for the activities, just not one the customer directly values.
The first layer is denoted as “business value-add—indirect.” These are many of the support services that are critical to long-term relationships with a customer but that the customer is not willing to pay for directly. For instance, a company has to issue an invoice when it sells a good or service. The customer doesn’t want to pay the company for the activity of issuing an invoice, but the customer can become very dissatisfied if the invoice is wrong, requiring more investment of their time and effort to correct. The fact that these activities impact overall customer satisfaction with their relationship with a firm have led many researchers to place them in a category called “service logic” and to make them part of the value-added core.5 This amount has been included in value-add by some companies we’ve done research with and excluded by others. The term “indirect” is used simply because the customer tends not to pay attention to these activities unless there is an error—they serve as potential dissatisfiers, not value creators.
The next layer is business value-add—future. Included here are all of the R&D, strategic, and marketing activities of the firm. For investors, these are very important activities, but for the current customer they are not. Why? Because the customer has already made a purchase decision based on existing offerings. It is doubtful if they want to pay the company to have their purchase decision made outdated. New customers are influenced by these new options, which are the life blood of the long-term health of the firm, but they are not of value to today’s customers and hence don’t garner any price.
Attention is next focused on all of the business value-add—administrative activities of the company. Some researchers call these nonvalue-add activities, but it is very difficult to actually implement a system where some peoples’ entire job gets called nonvalue-added. And, in reality, the company cannot exist if someone doesn’t tend to payroll, for instance. These activities are more (or less) required for the business to operate. They are activities, though, which sometimes can be eliminated or reduced by using different procedures or technologies. At the end they should be limited to only the essentials because they will never earn a dollar of revenue for the firm—they are pure cost with no redeeming features for the customer. As we’ll see shortly, we want to capture this information in our management accounting model so we can monitor and control where each valuable dollar earned as revenue is spent.
The next circle in the diagram is termed “waste.” These activities are often the focus of lean Six Sigma efforts, where attention is paid to eliminating unnecessary work wherever it occurs. This is such an important topic that an entire chapter will be devoted to it. For now, waste should simply be thought of as all of the “re’s” and “un’s” (undo, for instance) that customers will not pay for and that will never provide a benefit to anyone involved in the organization. Waste exists everywhere, in every activity, and in every organization. It is the potential gold that can be mined to improve profitability.
The final circle is the profit ring. If the company produces a product or service that is valued by the market, and they haven’t spent too much doing the required work or wasted too much, then there should be some profit left in the transaction with the customer. Note, though, that profit is not guaranteed by the market. Price is set based on attributes and how well they match customers’ desires. It is an ever-shrinking amount. Cost and waste occur. The company must manage its internal activities well in order to actually profit from the price customers are willing to pay for all of the activities a company undertakes in serving them.
Using Value to Create a New Accounting
We have now charted out the economics of the firm in a way that allows us to match our accounting to the realities faced by the firm. Let’s start with the revenue received for a specific product or service. We know this revenue is earned based on the value attributes, and we can use customers’ data to define how important each attribute was to the purchase decision. Armed with this information, we can now break the revenue line down into a set of revenue equivalents, or the amount of the total revenue that is earned by each value attribute. Why do we want this information? We want it because it helps us focus internal attention on those things customers care about. This approach to the accounting model also brings the financial team into sync with the marketing and strategy teams. It creates a common language that shifts the concept of revenue from a one-dimensional outcome to a multidimensional management tool.
In such a value-based cost management system (VCMS), the goal is always to match revenue with its costs. Here is where we begin to flesh out the accounting model to use a market perspective. Using activity-based analysis tools, individuals or managers in the firm are asked to list the activities performed in their area and assign approximate weights to the amount of time (and hence expense) each activity represents in their area. Having defined an activity and its related cost, attention now turns to adding “tags” to the data element to match the market perspective. Specifically, each activity is analyzed to determine what percentage of value-add, business value-add, and waste it has. Note that each activity is analyzed across all five possible dimensions of costs. This is a significant improvement over the existing literature that tends to place an entire activity into either value-added or nonvalue-added categories.
The VCMS model is not complete yet, though. We need to tie these activities to the revenue line using the value attributes. For every activity, then, that has some portion of judged customer value-add in it, the manager or individual assigns that value-added portion across the various attributes, completing the linkage of the accounting model to the marketing model that dominates the rest of the firm. Done with spreadsheet support, this is an exercise that yields tremendous insights into the firm.
Using these techniques, revenue has now been matched to its value-added costs. In addition, knowledge has been gained about the amount of business value-add and waste currently taking place. If a decision has been made to add indirect business value-add costs to the value-added costs, it is a simple mathematical task to revise the numbers.
More has been gained than a simple snapshot of where the money comes in and where it goes, though. Because revenue and costs have both been defined around value attributes, a company can now assess whether it is spending its money in areas that are best suited to customer requirements. This is accomplished by dividing the revenue by attribute by the value-added costs by attribute to get a revenue multiplier. If the multiplier is very low (less than five), it means the company is spending too much money on that attribute. Why five? Since value-added costs have been found across the board, in industry after industry and company after company to be about 20% of total costs, there is an inherent revenue multiplier of five in every profitable organization.
The real challenge comes when the multiplier is very high (eight or above). Here the question becomes two-sided—is this an area where the company has a competitive advantage because they create so much value with minimal cost or is it an area where the firm is under-spending, failing to deliver desired value to its customers? To answer this question, customer satisfaction data becomes critical. If customers are satisfied with the firm’s performance on a key attribute, then a high multiplier signals a competitive advantage. If the satisfaction level is low, though, then the firm is opening itself to lost sales and competitive failure.
This brief overview of the accounting model, which we call a value-based cost management system, is built around value creation. The goal is simply to provide enough working knowledge to understand how each of the subsequent in-depth chapters fits into the overall architecture. Figure 1.4 reviews the steps that are taken in creating a VCMS.

Figure 1.4. Steps to create a value-based cost management system (VCMS).
Completing these seven steps can be done very efficiently and effectively using Excel-based data gathering tools. As we’ll see, we can even add another step, namely placing a process code on each activity to support the integration of the data away from a departmental structure to a process structure. The objective of this book is not only to go into further detail on the basic features of the VCMS, but also to provide a basic implementation plan that includes specific information on how to structure the data collection process to optimize the information it creates for the lowest cost possible.
Using Value-Based Cost Management
One of the remaining questions is a simple “why?” Why should a firm invest any of its scarce resources in generating a new form of accounting information? The answer to this question lies at the very core of accounting in an organization—it is deemed to be the language of business. If it is to serve as a common language, shouldn’t the accounting system use the same set of assumptions the rest of the organization uses? If a company is truly to be customer-centered, it has to collect its information in ways that shed light on whether they are making the best choices to capture customer value. Looking out, not in, has to become the key feature of accounting in a customer-driven organization.
In the companies that have used this approach, new strategic insights have been gained. The benefits of a common language have allowed the information to be accepted and used in everything from operational to strategic decisions and from product and service delivery to the very design of these offerings. With the addition of process coding, companies have been able to unite all of their new management techniques under one umbrella of accounting logic and calculation. Moreover, tracking value multipliers over time allows a company to monitor value creation dynamics, and assess its market opportunities and threats. It is a system that is easy to understand, easy to use, and critical for the long-term health of an organization.
Clearly, a system such as this doesn’t replace the financial accounting model. That exists to support the questions asked by company shareholders and to fulfill other obligations of companies. The goal is not to provide information to external parties but rather to support the initiatives taken by internal managers to better serve their company’s customers—to use accounting information to grow the top line.
Managing customers as assets requires measuring, managing, and maximizing them.6