
12
PACKET ANALYSIS FOR SECURITY

Although most of this book focuses on using packet analysis for network troubleshooting, a considerable amount of real-world packet analysis is done for security purposes. For example, an intrusion analyst might review network traffic from potential intruders, or a forensic investigator might attempt to ascertain the extent of a malware infection on a compromised host.
Performing packet analysis while investigating security incidents is always a challenging scenario because it involves the unknown element of an attacker-controlled device. You can’t walk over to the attacker’s cubicle to ask a question or baseline their normal traffic; all you have to work with is the interaction you can capture between their system and yours. Fortunately, for an attacker to breach one of your systems remotely, they have to interact with the network in some form. Of course, they know that too, so they aren’t lacking in tricks to obfuscate their techniques.
In this chapter, we’ll take the viewpoint of a security practitioner as we examine different aspects of a system compromise at the network level. We’ll cover network reconnaissance, malicious traffic redirection, and common malware techniques. In some cases, we’ll take on the role of intrusion analyst as we dissect traffic based on alerts from an intrusion-detection system (IDS). Reading this chapter will provide you with insight into network security that may prove critical, even if you are not presently in a security-focused role.
Reconnaissance
An attacker’s first step is often to perform in-depth research on the target system. This step, commonly referred to as footprinting, is frequently accomplished using various publicly available resources, such as the target company’s website or Google. Once this research is completed, the attacker will typically begin scanning the IP address (or DNS name) of their target for open ports or running services.
Scanning allows the attacker to determine whether the target is alive and reachable. For example, consider a scenario in which bank robbers are planning to steal from the largest bank in the city, located at 123 Main Street. They spend weeks planning an elaborate heist, only to find out upon arrival at the address that the bank has moved to 555 Vine Street. Worse yet, imagine that the robbers plan to walk into the bank during normal business hours, intending to steal from the vault, only to get to the bank and discover it’s closed that day. Whether robbing a bank or attacking a network, ensuring that the target is alive and accessible is the first hurdle.
Scanning also tells the attacker on which ports the target is listening. Returning to our bank robbers analogy, consider what would happen if the robbers showed up at the bank with absolutely no knowledge of the building’s physical layout. They would have no idea how to gain access to the vault because they wouldn’t know the weak points in the bank’s physical security.
In this section, we’ll discuss a few of the more common scanning techniques used to identify hosts, their open ports, and vulnerabilities on a network.
NOTE
So far, this book has referred to the sides of a connection as the transmitter and receiver or as the client and server. This chapter refers to each side of the communication as either the attacker or the target.
SYN Scan
synscan.pcapng
The type of scanning often done first against a system is a TCP SYN scan, also known as a stealth scan or a half-open scan. A SYN scan is the most common type for several reasons:
• It is very fast and reliable.
• It is accurate on all platforms, regardless of TCP stack implementation.
• It is less noisy than other scanning techniques.
The TCP SYN scan relies on the three-way handshake process to determine which ports are open on a target host. The attacker sends a TCP SYN packet to a range of ports on the target, as if trying to establish a channel for normal communication on the ports. Once this packet is received by the target, one of several things may happen, as shown in Figure 12-1.
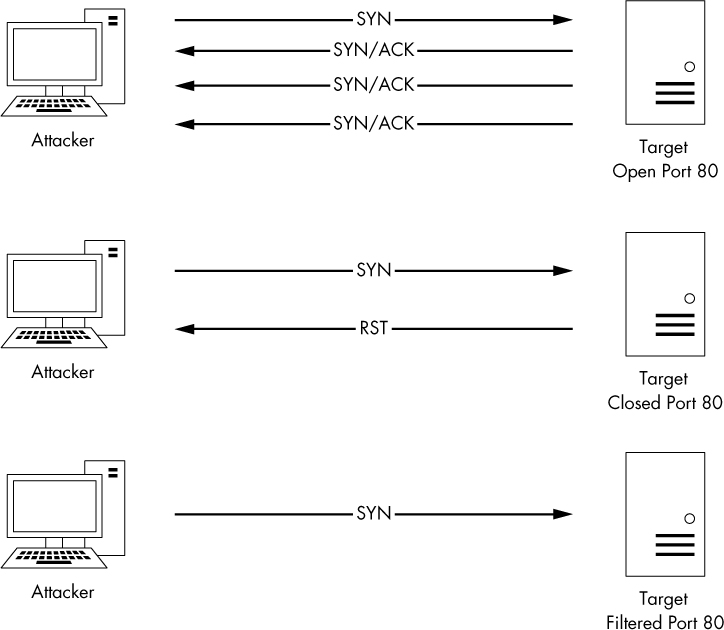
Figure 12-1: Possible results of a TCP SYN scan
If a service on the target’s machine is listening on a port that receives the SYN packet, it will reply to the attacker with a TCP SYN/ACK packet, the second part of the TCP handshake. Now the attacker knows that port is open and a service is listening on it. Under normal circumstances, a final TCP ACK would be sent to complete the connection handshake. In this case, however, the attacker doesn’t want that to happen since they won’t be communicating with the host further at this point, so the attacker doesn’t attempt to complete the TCP handshake.
If no service is listening on a scanned port, the attacker will not receive a SYN/ACK. Depending on the configuration of the target’s operating system, the attacker could receive an RST packet in return, indicating that the port is closed. Alternatively, the attacker may receive no response at all. No response could mean that the port is filtered by an intermediate device, such as a firewall or the host itself. On the other hand, it could just be that the response was lost in transit. Thus, while this result typically indicates that the port is closed, it is ultimately inconclusive.
The file synscan.pcapng provides a great example of a SYN scan performed with the Nmap tool. Nmap is a robust network-scanning application developed by Gordon “Fyodor” Lyon. It can perform just about any kind of scan you can imagine. You can download Nmap for free from http://www.nmap.com/download.html.
Our sample capture contains roughly 2,000 packets, telling us that this scan is of a reasonable size. One of the best ways to ascertain the scope of a scan of this nature is to view the Conversations window, as shown in Figure 12-2. There, you should see only one IPv4 conversation ➊ between the attacker (172.16.0.8) and the target (64.13.134.52). You will also see that there are 1,994 TCP conversations between these two hosts ➋—basically a new conversation for every port pairing involved in the communications.

Figure 12-2: The Conversations window shows the variety of TCP communications taking place.
The scanning is occurring very quickly, so scrolling through the capture file isn’t the best way to find the response associated with each initial SYN packet. Several more packets might be sent before a response to the original packet is received. Fortunately, we can create filters to help us find the right traffic.
Using Filters with SYN Scans
As an example of filtering, let’s consider the first packet in the capture, which is a SYN packet sent to the target on port 443 (HTTPS). To see whether there was a response to this packet, we can create a filter to show all traffic to and from port 443. Here’s how to do this quickly:
Select the first packet in the capture file.
Expand the TCP header in the Packet Details pane.
Right-click the Destination Port field, select Prepare as Filter, and click Selected.
This will place a filter in the filter dialog for all packets with the destination port of 443. Now, because we also want all packets from the source port of 443, click in the filter dialog at the top of the screen and erase the dst portion of the filter.
The resulting filter will yield two packets, which are both TCP SYN packets sent from attacker to target, as shown in Figure 12-3.

Figure 12-3: Two attempts to establish a connection with SYN packets
NOTE
In this section, packets are shown using the time display format Seconds Since Previous Displayed Packet.
Since there is no response to either of these packets, it’s possible that the response is being filtered by the target host or an intermediary device or that the port is closed. Ultimately, the result of the scan against port 443 is inconclusive.
We can attempt this same technique on another packet to see whether we get different results. To do so, clear your previous filter and select packet 9 in the list. This is a SYN packet to port 53, commonly associated with DNS. Using the method outlined in the previous steps or by modifying your last filter, create a filter that will show all TCP port 53 traffic. When you apply this filter, you should see five packets, as shown in Figure 12-4.
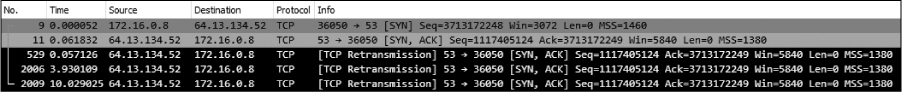
Figure 12-4: Five packets indicating a port is open
The first of these packets is the SYN we selected at the beginning of the capture (packet 9). The second is a response from the target. It’s a TCP SYN/ACK—the response expected when setting up the three-way handshake. Under normal circumstances, the next packet would be an ACK from the host that sent the initial SYN. However, in this case, our attacker doesn’t want to complete the connection and doesn’t send a response. As a result, the target retransmits the SYN/ACK three more times before giving up. Since a SYN/ACK response is received when attempting to communicate with the host on port 53, it’s safe to assume that a service is listening on that port.
Let’s rinse and repeat this process one more time for packet 13. This is a SYN packet sent to port 113, which is commonly associated with the Ident protocol, often used for IRC identification and authentication services. If you apply the same type of filter to the port listed in this packet, you will see four packets, as shown in Figure 12-5.
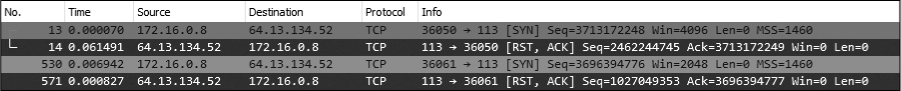
Figure 12-5: A SYN followed by an RST, indicating the port is closed
The first packet is the initial SYN, which is followed immediately by an RST from the target. This is an indication that the target is not accepting connections on the targeted port and that a service is most likely not running on it.
Identifying Open and Closed Ports
Now that you understand the different types of responses a SYN scan can elicit, you’ll want to find a fast method of identifying which ports are open or closed. The answer lies within the Conversations window once again. In this window, you can sort the TCP conversations by packet number, with the highest values at the top, by clicking the Packets column header until the arrow points downward, as shown in Figure 12-6.
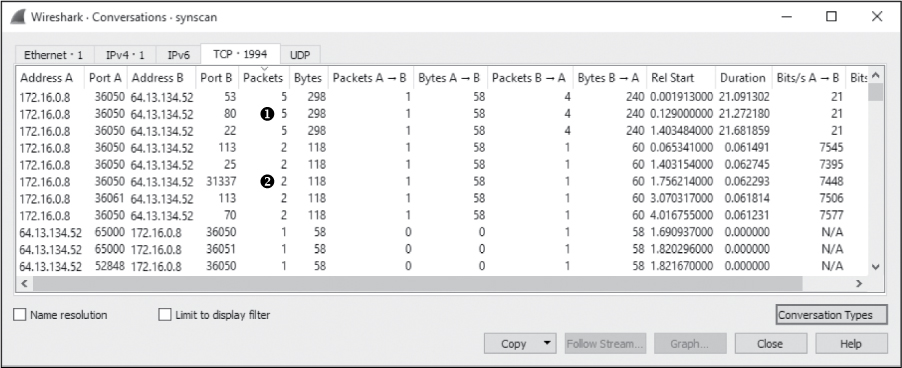
Figure 12-6: Finding open ports with the Conversations window
Three scanned ports include five packets in each of their conversations ➊. We know that ports 53, 80, and 22 are open, because these five packets represent the initial SYN, the corresponding SYN/ACK, and the retransmitted SYN/ACKs from the target.
For five ports, only two packets were involved in the communication ➋. The first is the initial SYN, and the second is the RST from the target. These results indicate that ports 113, 25, 31337, 113, and 70 are closed.
The remaining entries in the Conversations window include only one packet, meaning that the target host never responded to the initial SYN. These remaining ports are most likely closed, but we’re not sure.
This technique of counting packets worked for this host, but it won’t be consistent for all hosts you might scan, so you shouldn’t rely on it exclusively. Instead, focus on learning what normal stimulus and response looks like and what abnormal responses to normal stimuli can mean.
Operating System Fingerprinting
An attacker puts a great deal of value on knowing the target’s operating system. Knowledge of the operating system helps the attacker configure all their methods of attack correctly for that system. It also allows the attacker to know the location of certain critical files and directories within the target file system, should they succeed in accessing the system.
Operating system fingerprinting is the name given to a group of techniques used to determine the operating system running on a system without having physical access to that system. There are two types of operating system fingerprinting: passive and active.
Passive Fingerprinting
passiveosfinger printing.pcapng
Using passive fingerprinting, you examine certain fields within packets sent from the target to determine the operating system in use. The technique is considered passive because you listen to only the packets the target host is sending and don’t actively send any packets to the host yourself. This type of operating system fingerprinting is ideal for attackers because it allows them to be stealthy.
That said, how can we determine which operating system a host is running based on nothing but the packets it sends? This feat is possible due to the lack of standardized values in the specifications defined by protocol RFCs. Although the various fields contained in TCP, UDP, and IP headers are very specific, default values are typically not defined for every field. This means that the TCP/IP stack implementation in each operating system must define its own default values for these fields. Table 12-1 lists some of the more common fields and the default values that can be used to link them to various operating systems. Keep in mind that these values are subject to change with new OS version releases.
Table 12-1: Common Passive Fingerprinting Values
Protocol header |
Field |
Default value |
Platform |
IP |
Initial time to live |
64 |
NMap, BSD, OS X, Linux |
128 |
Novell, Windows |
||
255 |
Cisco IOS, Palm OS, Solaris |
||
IP |
Don’t fragment flag |
Set |
BSD, OS X, Linux, Novell, Windows, Palm OS, Solaris |
Not set |
Nmap, Cisco IOS |
||
TCP |
Maximum segment size |
0 |
Nmap |
1440–1460 |
Windows, Novell |
||
1460 |
BSD, OS X, Linux, Solaris |
||
TCP |
Window size |
1024–4096 |
Nmap |
65535 |
BSD, OS X |
||
Variable |
Linux |
||
16384 |
Novell |
||
4128 |
Cisco IOS |
||
24820 |
Solaris |
||
Variable |
Windows |
||
TCP |
SackOK |
Set |
Linux, Windows, OS X, OpenBSD |
Not set |
Nmap, FreeBSD, Novell, Cisco IOS, Solaris |
The packets contained in the file passiveosfingerprinting.pcapng are great examples of this technique. There are two packets in this file. Both are TCP SYN packets sent to port 80, but they come from different hosts. Using only the values contained in these packets and referring to Table 12-1, we should be able to determine the operating system architecture in use on each host. The details of each packet are shown in Figure 12-7.
Using Table 12-1 as a reference, we can create Table 12-2, which is a breakdown of the relevant fields in these packets.
Table 12-2: Breakdown of the Operating System Fingerprinting Packets
Protocol header |
Field |
Packet 1 value |
Packet 2 value |
IP |
Initial time to live |
128 |
64 |
IP |
Don’t fragment flag |
Set |
Set |
TCP |
Maximum segment size |
1,440 bytes |
1,460 bytes |
TCP |
Window size |
64,240 bytes |
2,920 bytes |
TCP |
SackOK |
Set |
Set |
Based on these values, we can conclude that packet 1 was most likely sent by a device running Windows and packet 2 was most likely sent by a device running Linux.
Keep in mind that the list of common passive fingerprinting identifying fields in Table 12-1 is by no means exhaustive. There are many quirks that may result in deviations from these expected values. Therefore, you cannot fully rely on the results gained from passive operating system fingerprinting.

Figure 12-7: These packets can tell us which operating system they were sent from.
NOTE
In many cases, attackers rely on automated tools to passively identify the operating system of a target. One tool that uses operating system fingerprinting techniques is p0f. This tool analyzes relevant fields in a packet capture and outputs the suspected operating system. Using tools like p0f, you can get not only the operating system architecture but sometimes even the version or patch level of the OS. You can download p0f from http://lcamtuf.coredump.cx/p0f.shtml.
Active Fingerprinting
activeosfingerprinting.pcapng
When passively monitoring traffic doesn’t yield the desired results, a more direct approach—active fingerprinting—may be required. Now the attacker actively sends specially crafted packets to the target to elicit replies that will reveal the operating system on the target’s machine. Of course, since this approach involves communicating directly with the target, it is not the least bit stealthy, but it can be highly effective.
The file activeosfingerprinting.pcapng contains an example of an active operating system fingerprinting scan initiated with the Nmap scanning utility. Several packets in this file are the result of Nmap’s sending different probes designed to elicit responses that will allow for operating system identification. Nmap records the responses to these probes and builds a fingerprint, which it compares to a database of values to make a determination.
NOTE
The techniques used by Nmap to actively fingerprint an operating system are quite complex. To learn more about how Nmap performs active operating system finger-printing, read the definitive guide to Nmap, Nmap Network Scanning (2008), by the tool’s author, Gordon “Fyodor” Lyon.
Traffic Manipulation
One of the key points I’ve tried to show throughout this book is that you can learn a lot about a system or its users by examining the right packets. Thus, it should come as no surprise that attackers often seek to capture these packets themselves. By examining the packets generated by a system, an attacker can learn about the operating system, the applications in use, authentication credentials, and much more.
In this section, we’ll examine two techniques at the packet level: how an attacker can use ARP cache poisoning to intercept and capture target traffic and how they can intercept HTTP cookies to perform session-hijacking attacks.
ARP Cache Poisoning
arppoison.pcapng
In Chapter 7, we discussed how the ARP protocol is used to allow devices to map IP addresses to MAC addresses inside of a network, and, in Chapter 2, we discussed how ARP cache poisoning can be a useful technique for tapping into the wire and intercepting traffic from hosts whose packets you need to analyze. When used for legitimate purposes, ARP cache poisoning is very helpful for troubleshooting. However, when this technique is used with malicious intent, it is a lethal form of the man-in-the-middle (MITM) attack.
In a MITM attack, an attacker redirects traffic between two hosts in order to intercept or modify data in transit. There are many forms of MITM attacks, including DNS spoofing and SSL hijacking. In ARP cache poisoning, specially crafted ARP packets trick two hosts into thinking they are communicating with each other when, in fact, they are communicating with a third party who is relaying packets as an intermediary. In this way, the illegitimate use of a protocol’s normal functionality can be used for malicious purposes.
The file arppoison.pcapng contains an example of ARP cache poisoning. When you open it, you’ll see that this traffic appears normal at first glance. However, if you follow the packets, you’ll see our target, 172.16.0.107, browsing to Google and performing a search. As a result of this search, there is quite a bit of HTTP traffic with some DNS queries mixed in.
We know that ARP cache poisoning is a technique that occurs at layer 2, so if we just casually peruse the packets in the Packet List pane, it may be hard to see any foul play. To give us a leg up, we’ll add a couple of columns to the Packet List pane, as follows:
Select Edit ▶ Preferences.
Click Columns on the left side of the Preferences window.
Click the plus (+) button to add a new column.
In the Title area, type Source MAC and press ENTER.
In the Type drop-down list, select Hw src addr (resolved).
Click the newly added entry and drag it so that it is directly after the Source column.
Click the plus (+) button to add a new column.
In the Title area, type Dest MAC and press ENTER.
In the Type drop-down list, select Hw dest addr (resolved).
Click the newly added entry and drag it so that it is directly after the Destination column.
Click OK to apply the changes.
When you have completed these steps, your screen should look like Figure 12-8. You should now have two additional columns showing the source and destination MAC addresses of the packets.
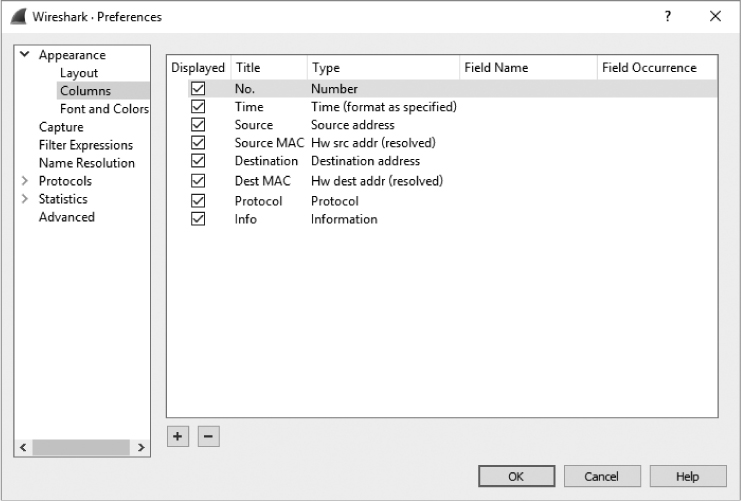
Figure 12-8: The column configuration screen with newly added columns for source and destination hardware addresses
If you still have MAC name resolution turned on, you should see that the communicating devices have MAC addresses that indicate Dell and Cisco hardware. This is very important to remember because as we scroll through the capture, we’ll see that this changes at packet 54, where we see some peculiar ARP traffic occurring between the Dell host (our target) and a newly introduced HP host (the attacker), as shown in Figure 12-9.

Figure 12-9: Strange ARP traffic between the Dell device and an HP device
Before proceeding further, note the endpoints involved in this communication, which are listed in Table 12-3.
Table 12-3: Endpoints Being Monitored
Role |
Device type |
IP address |
MAC address |
Target |
Dell |
172.16.0.107 |
00:21:70:c0:56:f0 |
Router |
Cisco |
172.16.0.1 |
00:26:0b:31:07:33 |
Attacker |
HP |
Unknown |
00:25:b3:bf:91:ee |
But what makes this traffic strange? Recall from our discussion of ARP in Chapter 7 that there are two primary types of ARP packets: a request and a response. The request packet is sent as a broadcast to all hosts on the network in order to find the machine that has the MAC address associated with a particular IP address. Then the machine that replies to the requesting device sends a response as a unicast packet. Given this background, we can identify a few peculiar things in this communication sequence, referring to Figure 12-9.
First, packet 54 is an ARP request sent from the attacker (MAC address 00:25:b3:bf:91:ee) as a unicast packet directly to the target (MAC address 00:21:70:c0:56:f0) ➊. This type of request should be broadcast to all hosts on the network, but this one singles out the target. Also, notice that although this packet is sent from the attacker and includes the attacker’s MAC address in the ARP header, it lists the router’s IP address rather than its own.
This packet is followed by a response from the target to the attacker containing its MAC address information ➋. The real voodoo here occurs in packet 56, in which the attacker sends a packet to the target with an unsolicited ARP reply telling it that 172.16.0.1 is located at its MAC address, 00:25:b3:bf:91:ee ➌. The problem is that MAC address 172.16.0.1 isn’t 00:25:b3:bf:91:ee but is 00:26:0b:31:07:33. We know this because we saw the router at 172.16.0.1 communicating with the target earlier in the packet capture. Since the ARP protocol is inherently insecure (it accepts unsolicited updates to its ARP table), the target will now be sending traffic that should be going to the router to the attacker instead.
NOTE
Because this packet capture was taken from the target’s machine, you don’t actually see the entire picture. For this attack to work, the attacker must send the same sequence of packets to the router in order to trick it into thinking the attacker is actually the target, but we would need to take another packet capture from the router (or the attacker) to see those packets.
Once both target and router have been duped, the communication between them flows through the attacker, as illustrated in Figure 12-10.

Figure 12-10: ARP cache poisoning as an MITM attack
Packet 57 confirms the success of this attack. When you compare this packet to one sent before the mysterious ARP traffic, such as packet 40 (see Figure 12-11), you will see that the IP address of the remote server (Google) remains the same ➋ but the target MAC address has changed ➊. This change in MAC address tells us that the traffic is now being routed through the attacker before it gets to the router.
Because this attack is so subtle, it’s very difficult to detect. To find it, you typically need the aid of an IDS configured specifically to address it or software running on devices designed to detect sudden changes in ARP table entries. Since you’ll most likely use ARP cache poisoning to capture packets on networks you are analyzing, it’s important to know how this technique can be used against you as well.
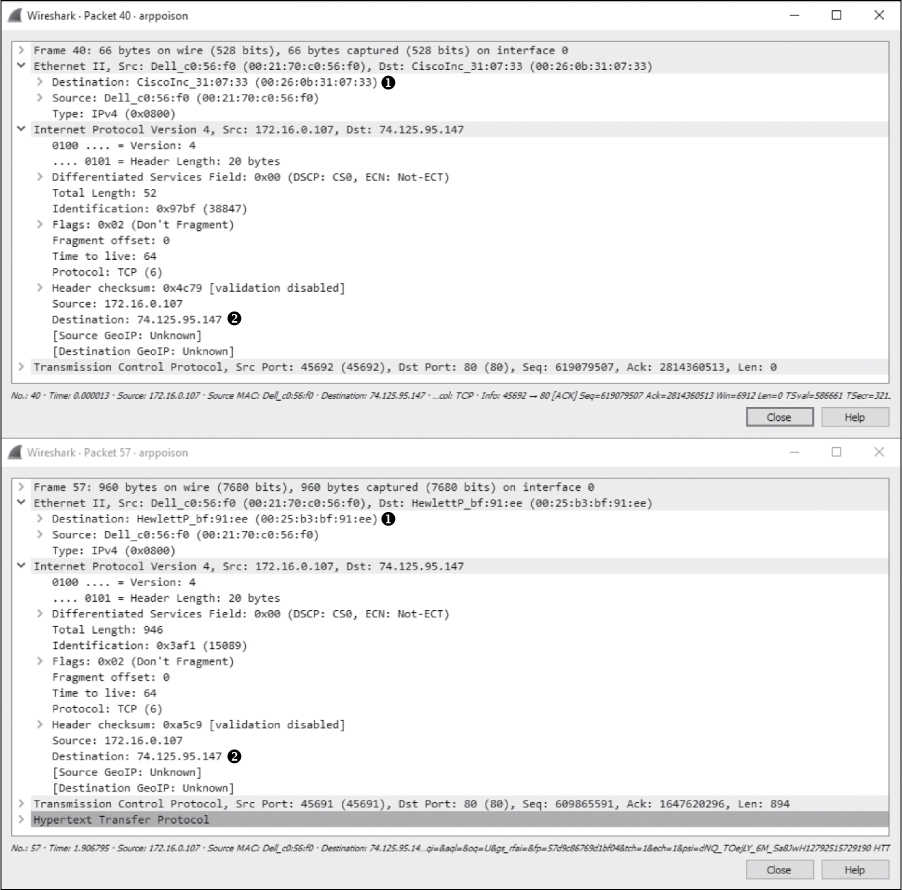
Figure 12-11: The change in target MAC address shows this attack was a success.
Session Hijacking
sessionhijacking.pcapng
Now that you know how ARP cache poisoning can be used maliciously, I want to demonstrate a technique that can take advantage of it: session hijacking. In session hijacking, an attacker compromises an HTTP session cookie, which we’ll learn about soon, and uses it to impersonate another user. To accomplish this, an attacker can use ARP cache poisoning to intercept a target’s traffic and find relevant session cookie information. The attacker can then use that information to access the target web application as the target user.
This scenario begins with the file sessionhijacking.pcapng. This capture contains the traffic of a target (172.16.16.164) communicating with a web application (172.16.16.181). Unbeknownst to the target, they have fallen prey to an attacker (172.16.16.154) who is actively intercepting their communications. These packets were collected from the perspective of the web server, which is likely the same viewpoint a defender would have if a session-hijacking attack were used against their server infrastructure.
NOTE
The web application being accessed here is called Damn Vulnerable Web Application (DVWA). It is intentionally vulnerable to many types of attacks and is used frequently as a teaching tool. If you’d like to learn more about web application attacks or investigate packets associated with them, you can learn more about DVWA at http://www.dvwa.co.uk/.
The traffic in this capture consists primarily of two conversations. The first is the communication from the target to web server, which can be isolated with the filter ip.addr == 172.16.16.164 && ip.addr == 172.16.16.181. This communication represents normal web-browsing traffic and isn’t particularly special. Of particular interest is the cookie value in the requests. For instance, if you look at a GET request such as the one in packet 14, you will find the cookie listed in the Packet Details window, as shown in Figure 12-12. In this case, the cookie identifies the session ID with a PHPSESSID value of ncobrqrb7fj2a2sinddtk567q4 ➊.
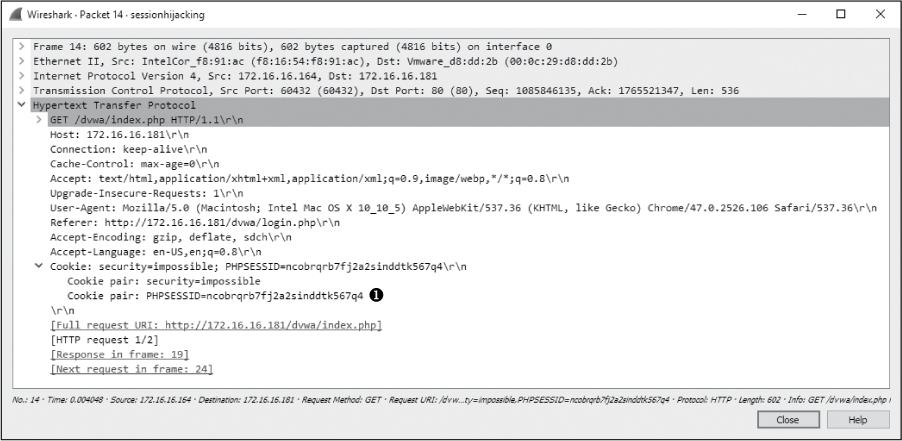
Figure 12-12: Viewing the target’s session cookie
Websites use cookies to maintain session awareness for individual hosts. When a new visitor comes to a website, they are issued a session ID that uniquely identifies them (the PHPSESSID). For authentication, many applications wait until a user with a session ID has successfully authenticated to the app, and then they create a database record recognizing that ID as being representative of an authenticated session. Any user with that ID will be able to access the app with that authentication. Of course, developers want to believe that only a single user would have a specific ID because the IDs are uniquely generated. This method of handling session IDs is insecure, however, because it allows a malicious user to steal another user’s ID and use it to impersonate them. There are methods that can be used to prevent session-hijacking techniques, but many websites, including DVWA, are still vulnerable.
The target doesn’t realize that their traffic is being intercepted by an attacker or that the attacker has access to the session cookie, as shown in Figure 12-12. All the attacker has to do is communicate with the web server using that cookie value. This task can be accomplished with certain types of proxy servers, but it is made even easier by using browser plugins like Cookie Manager for Chrome. Using this plugin, the attacker can specify the PHPSESSID value obtained from the target’s traffic, as shown in Figure 12-13.
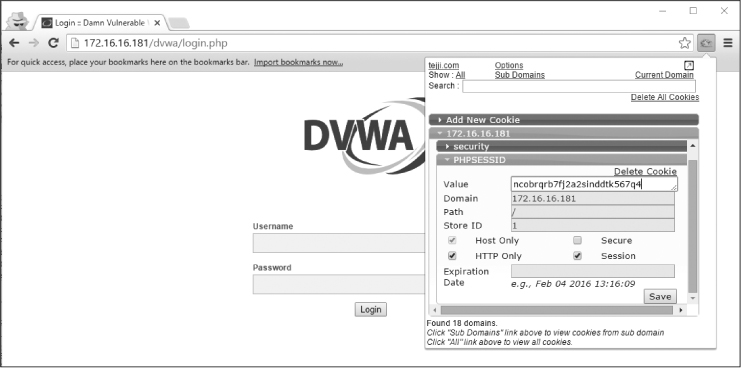
Figure 12-13: Using the Cookie Manager plugin to impersonate the target
If you clear the filter previously applied to the capture file and start scrolling down, eventually you’ll see the attacker’s IP address communicating with the web server. You can limit your view to this communication using the filter ip.addr == 172.16.16.154 && ip.addr == 172.16.16.181.
Before we dig into this further, let’s add a column to show the cookie values in the Packet List pane. If you added columns as part of the previous section on ARP cache poisoning, you should remove those first. Then proceed to use the instructions from the ARP cache-poisoning section to add the new custom column field based on the field name http.cookie_pair. Once you’ve added the column, position it after the Destination field. Your screen should look like Figure 12-14.
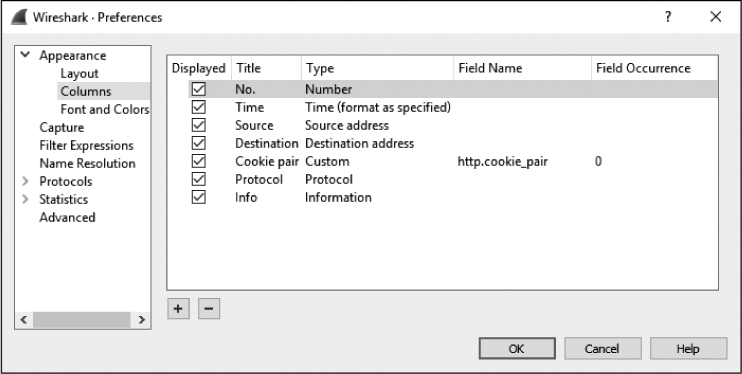
Figure 12-14: Configuring columns to investigate session hijacking
With the new columns configured, modify the display filter to show only HTTP requests, as TCP communication isn’t useful here. The new filter is (ip.addr==172.16.16.154 && ip.addr==172.16.16.181) && (http.request.method || http.response.code). The resulting packets are shown in Figure 12-15.
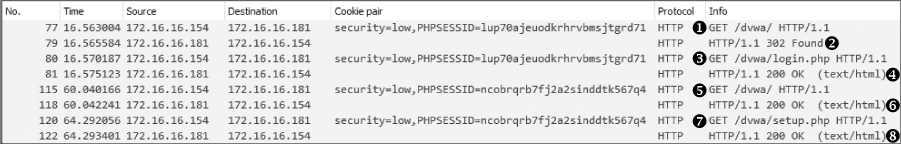
Figure 12-15: The attacker impersonating the target user
You are now looking at communication between the attacker and the server. In the first four packets, the attacker requests the /dvwa/ directory ➊ and receives a 302 response code in return, which is a normal method web servers use to redirect visitors to different URLs on a server. In this case, the attacker gets redirected to the login page at /dvwa/login.php ➋. The attacker’s machine requests the login page ➌, which is returned successfully ➍. Both requests use the session ID lup70ajeuodkrhrvbmsjtgrd71.
Following that, there is a new request for the /dvwa/ directory, but this time, take note of the different session ID ➎. The session ID is now ncobrqrb7fj2a2sinddtk567q4, which is the same one the target used earlier. This indicates the attacker has manipulated the traffic to use the stolen ID. Instead of being redirected to the login page, the request is met with an HTTP 200 status code, and the page is delivered as the authenticated target would see it ➏. The attacker browses to another page, dvwa/setup.php, using the target’s ID ➐, and that page also returns successfully ➑. The attacker is browsing the DVWA website as though they were authenticated as the target. This is all without knowing the target’s username or password.
This is just one example of how an attacker can turn packet analysis into an offensive tool. In general, it’s safe to assume that if an attacker can see the packets associated with your communication, some type of malicious activity can result. This is one reason security professionals advocate for protecting data in transit through encryption.
Malware
While perfectly legitimate software can be used for malicious purposes, malware is a term usually reserved for code that is written specifically with malicious intent. Malware can take many shapes and forms, including worms that are self-propagating and trojan horses that masquerade as legitimate software. From a network defender’s view, most malware is undiscovered and unknown until it can be captured and analyzed. This analysis involves multiple steps, including one focused on a behavioral analysis of the malware’s network communication patterns. In some cases, analysis occurs in a forensic malware reverse-engineering lab, but more often, it occurs in the wild when a security analyst discovers a device on their network that has become infected.
In this section, we will look at a few examples of real malware and its behavior, as observed through packets.
Operation Aurora
aurora.pcapng
In January 2010, Operation Aurora was discovered to have exploited an as of then unknown vulnerability in Internet Explorer. This vulnerability allowed attackers to gain remote control of targeted machines at Google, among other companies.
For this malicious code to be executed, a user simply needed to visit a website using a vulnerable version of Internet Explorer. The attackers then had immediate access to the user’s machine with the same privileges as the logged-in user. Spear phishing, in which attackers send an email message designed to get recipients to click a link leading to a malicious site, was used to lure the targets.
In the case of Aurora, we pick up this story as soon as the targeted user clicks the link in the spear-phishing email. The resulting packets are contained in the file aurora.pcapng.
This capture begins with a three-way handshake between the target (192.168.100.206) and the attacker (192.168.100.202). The initial connection is to port 80, which would lead us to believe this is HTTP traffic. That assumption is confirmed in the fourth packet, which is an HTTP GET request for /info ➊, as shown in Figure 12-16.
As shown in Figure 12-17, the attacker’s machine acknowledges receipt of the GET request and reports a response code of 302 (Moved Temporarily) in packet 6 ➊, the status code commonly used to redirect a browser to another page, as is the case here. Along with the 302 response code, a Location field specifies the location /info?rFfWELUjLJHpP ➋.
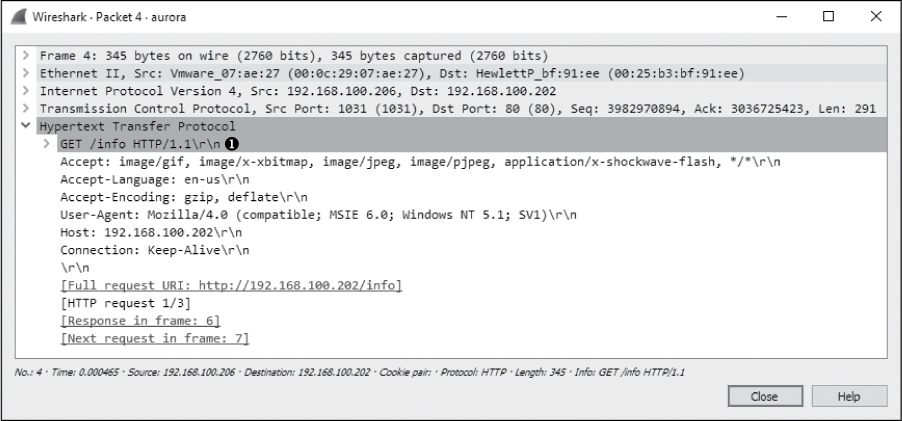
Figure 12-16: The target makes a GET request for /info.

Figure 12-17: The client browser is redirected with this packet.
After receiving the HTTP 302 packet, the client initiates another GET request to the /info?rFfWELUjLJHpP URL in packet 7, for which an ACK is received in packet 8. Following the ACK, the next several packets represent data being transferred from the attacker to the target. To take a closer look at that data, right-click one of the packets in the stream, such as packet 9, and select Follow ▶ TCP Stream. In this stream output, we see the initial GET request, the 302 redirection, and the second GET request, as shown in Figure 12-18.
After this, things start getting really strange. The attacker responds to the GET request with some very odd-looking content, the first section of which is shown in Figure 12-19.
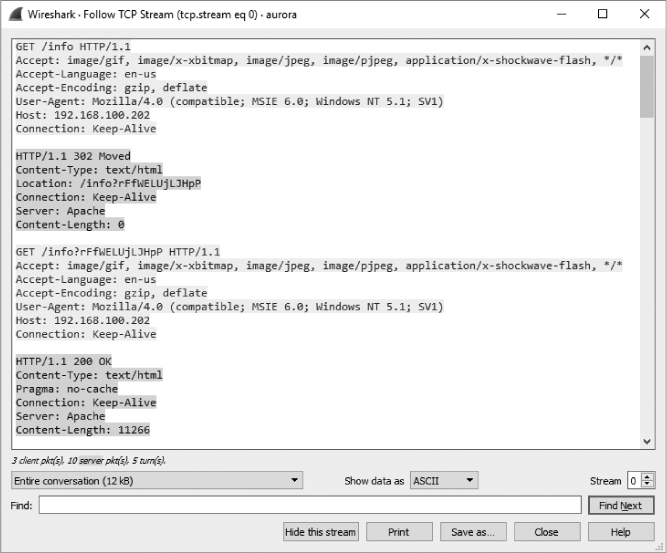
Figure 12-18: The data stream being transmitted to the client
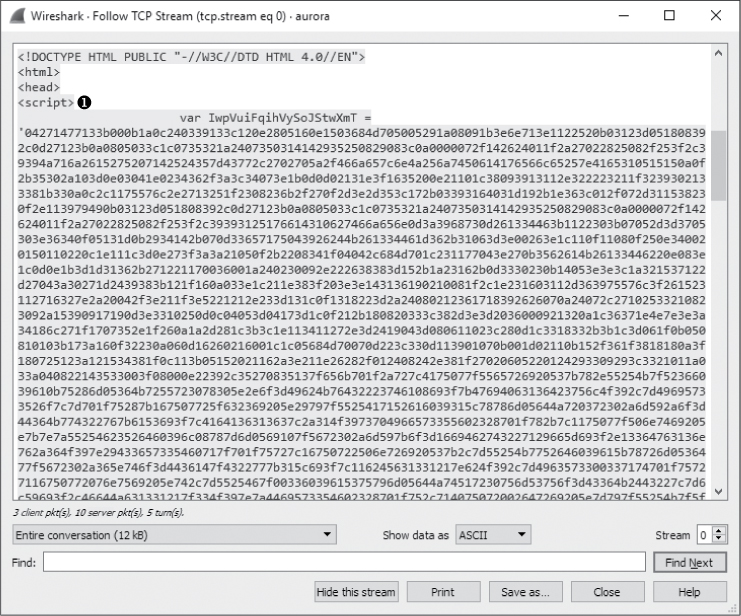
Figure 12-19: This scrambled content within a <script> tag appears to be encoded.
This content appears to be a series of random numbers and letters inside a <script> tag ➊. The <script> tag is used within HTML to denote the use of a higher-level client-side scripting language whose code is executed on the HTTP client. Within this tag, you normally see various scripting statements. But the gibberish here indicates that the content may be encoded to hide it from detection. Since we know this is exploit traffic, we can assume that this obfuscated section of text contains the hexadecimal padding and shellcode used to exploit the vulnerable service.
NOTE
Script obfuscation is a common technique used by malware to evade detection and hide malicious content. While deobfuscating scripts is beyond the scope of this book, it’s a skill you’ll develop if you continue to examine malware communication. Many skilled malware analysts can recognize malicious scripts instantly with a quick visual inspection. If you want to challenge yourself, try to manually deobfuscate the script found in this example.
In the second portion of the content sent from the attacker, shown in Figure 12-20, we finally see some text that is readable. Even without extensive programming knowledge, we can see that this text appears to do some string parsing based on a few variables. This is the last bit of text before the closing </script> tag.
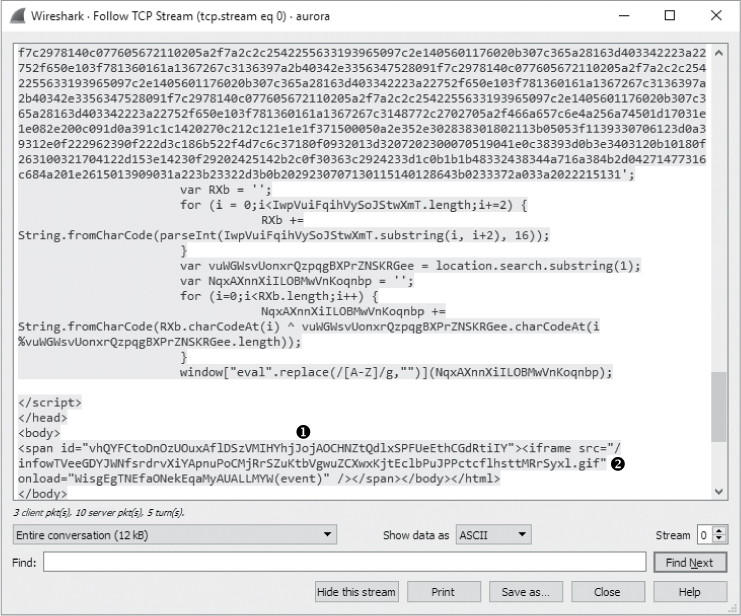
Figure 12-20: This portion of the content sent from the server contains readable text and a suspicious iframe.
The last section of data sent from attacker to client, also shown in Figure 12-20, has two parts. The first is the <span id="vhQYFCtoDnOzUOuxAflDS zVMIHYhjJojAOCHNZtQdlxSPFUeEthCGdRtiIY"> section ➊. The second, contained within the <span></span> tags, is <iframe src="/infowTVeeGDYJWNfsrdrvXiYApnuPoC MjRrSZuKtbVgwuZCXwxKjtEclbPuJPPctcflhsttMRrSyxl.gif" onload="WisgEgTNEfaONekE qaMyAUALLMYW(event)" /> ➋. Once again, this content may be a sign of malicious activity due to the suspiciously long and random strings of unreadable and potentially obfuscated text.
The portion of the code contained within the <span> tag is an iframe, which is a common method used by attackers to embed additional unexpected content into an HTML page. The <iframe> tag creates an inline frame that can go undetected by the user. In this case, the <iframe> tag references an oddly named GIF file. As shown in Figure 12-21, when the target’s browser sees the reference to this file, it makes a GET request for it in packet 21 ➊, and the GIF is sent immediately following that ➋.

Figure 12-21: The GIF specified in the iframe is requested and downloaded by the target.
The most peculiar part of this capture occurs at packet 25, when the target initiates a connection back to the attacker on port 4321. Viewing this second stream of communication from the Packet Details pane doesn’t yield much information, so we will once again view the TCP stream to get a clearer picture of the data being communicated. Figure 12-22 shows the Follow TCP Stream window output.
In this display, we see something that should set off immediate alarms: a Windows command shell ➊. This shell is sent from the target to the server, indicating that the attacker’s exploit attempt succeeded and the payload was dropped. The client transmitted a command shell back to the attacker once the exploit was launched. In this capture, we can even see the attacker interacting with the target by entering the dir command ➋ to view a directory listing on the target’s machine ➌.
Assuming the exploit has compromised a process running as an administrator or migrated into one, the attacker can do virtually anything they wish to the target’s machine. With just a single click, in a matter of seconds, the target has given complete control of their computer to an attacker.
Exploits like this are typically encoded to be unrecognizable when going across the wire to prevent them from being picked up by the network IDS. As such, without prior knowledge of this exploit or even a sample of the exploit code, it might be difficult to tell exactly what is happening on the target’s system without further analysis. Luckily, we were able to pick out some tell-tale signs of malicious code in this packet capture. This includes the obfuscated text in the <script> tags, the peculiar iframe, and the command shell seen in plaintext.

Figure 12-22: The attacker is interacting with a command shell through this connection.
Here is a summary of how the Aurora exploit worked here:
• The target receives an email from the attacker that appears to be legitimate, clicks a link within it, and sends a GET request to the attacker’s malicious site.
• The attacker’s web server issues a 302 redirection to the target, and the target’s browser automatically issues a GET request to the redirected URL.
• The attacker’s web server transmits a web page containing obfuscated JavaScript code to the client that includes a vulnerability exploit and an iframe containing a link to a GIF image, which is requested.
• The JavaScript code transmitted earlier is deobfuscated when the page is rendered in the target’s browser, and the code executes on their machine, exploiting a vulnerability in Internet Explorer.
• Once the vulnerability is exploited, the payload hidden within the obfuscated code is executed, opening a new session from the target to the attacker on port 4321.
• A command shell is spawned from the payload and shoveled back to the attacker, so that they may interact with it.
From a defender’s point of view, we can use this capture file to create a signature for our IDS that might help detect further occurrences of this attack. For example, we might filter on a nonobfuscated part of the capture, such as the plaintext code at the end of the obfuscated text in the <script> tag. Another idea might be to write a signature for all HTTP traffic with a 302 redirection to a site with info in the URL. This signature would need some additional tuning to be viable in a production environment, but it’s a good start. Of course, it’s also important to remember that signatures can be defeated. If the attacker simply changes a few of the strings we’ve observed here or delivers the exploit through another mechanism, our signatures could be rendered useless. Thus is waged the eternal struggle between attackers and defenders.
NOTE
The ability to create traffic signatures based on malicious traffic samples is a crucial step for someone attempting to defend a network against unknown threats. Analyzing captures such as the one described here are a great way to develop skills in writing those signatures. To learn more about intrusion detection and attack signatures, visit the Snort project at http://www.snort.org/.
Remote-Access Trojan
ratinfected.pcapng
So far, we’ve examined security events with some prior knowledge of what is going on. This is a great way to learn what attacks look like, but it’s not very real world. In most real-world scenarios, people tasked with defending a network won’t examine every packet that goes across the network. Instead, they will use some form of IDS to alert them to anomalies in network traffic that warrant further examination based on a predefined attack signature.
In the next example, we’ll begin with a simple alert, as if we’re the real-world analyst. In this case, our IDS generates this alert:
[**] [1:132456789:2] CyberEYE RAT Session Establishment [**]
[Classification: A Network Trojan was detected] [Priority: 1]
07/18-12:45:04.656854 172.16.0.111:4433 -> 172.16.0.114:6641
TCP TTL:128 TOS:0x0 ID:6526 IpLen:20 DgmLen:54 DF
***AP*** Seq: 0x53BAEB5E Ack: 0x18874922 Win: 0xFAF0 TcpLen: 20
Our next step is to view the signature rule that triggered this alert:
alert tcp any any -> $HOME_NET any (msg:"CyberEYE RAT Session Establishment";
content:"|41 4E 41 42 49 4C 47 49 7C|"; classtype:trojan-activity;
sid:132456789; rev:2;)
This rule is set to alert whenever it sees a packet from any network entering the internal network with the hexadecimal content 41 4E 41 42 49 4C 47 49 7C, which converts to ANA BILGI in human-readable ASCII. When it is detected, an alert fires, signifying the possible presence of the CyberEYE remote-access trojan (RAT). RATs are malicious programs that run silently on a target’s computer and provide a means for the attacker to remotely access the target’s machine.
NOTE
CyberEYE is a once popular Turkish-born tool used to create RAT executables and administer compromised hosts. Ironically, the Snort rule seen here fires on the string ANA BILGI, which is Turkish for BASIC INFORMATION.
Now we’ll look at some traffic associated with the alert in ratinfected.pcapng. This Snort alert would typically capture only the single packet that triggered the alert, but fortunately we have the entire communication sequence between the hosts. To skip to the punch line, search for the hexadecimal string mentioned in the Snort rule, as follows:
Select Edit ▶ Find Packet or press CTRL-F.
Select the Hex Value option from the drop-down menu.
Enter the value 41 4E 41 42 49 4C 47 49 7C into the text area.
Click Find.
As shown in Figure 12-23, you should now see the first occurrence of the hexadecimal string in the data portion of packet 4 ➊.

Figure 12-23: The content string in the Snort alert is first seen here in packet 4.
If you select Find several more times, you will see that this string also occurs in packets 5, 10, 32, 156, 280, 405, 531, and 652. Although all of the communication in this capture file is between the attacker (172.16.0.111) and target (172.16.0.114), it appears as though some instances of the string occur in different conversations. While packets 4 and 5 are communicating using ports 4433 and 6641, most of the other instances occur between port 4433 and other randomly selected ephemeral ports. We can confirm that multiple conversations exist by looking at the TCP tab of the Conversations window, as shown in Figure 12-24.
We can visually separate the different conversations in this capture file by colorizing them, as follows:
In the filter dialog above the Packet List pane, type the filter (tcp.flags.syn == 1) && (tcp.flags.ack == 0). Then press ENTER. This will select the initial SYN packet for each conversation in the traffic.
Right-click the first packet and select Colorize Conversation.
Select TCP and then select a color.
Repeat this process for the remaining SYN packets, choosing a different color for each.
When finished, click X to remove the filter.

Figure 12-24: Three individual conversations exist between the attacker and target.
Having colorized the conversations, we can clear the filter to see how they relate to each other, helping us to track the communication process between the two hosts. The first conversation (ports 6641/4433) is where the communication between the two hosts begins, so it’s a good place to start. Right-click any packet within the conversation and select Follow TCP Stream to see the data that was transferred, as shown in Figure 12-25.
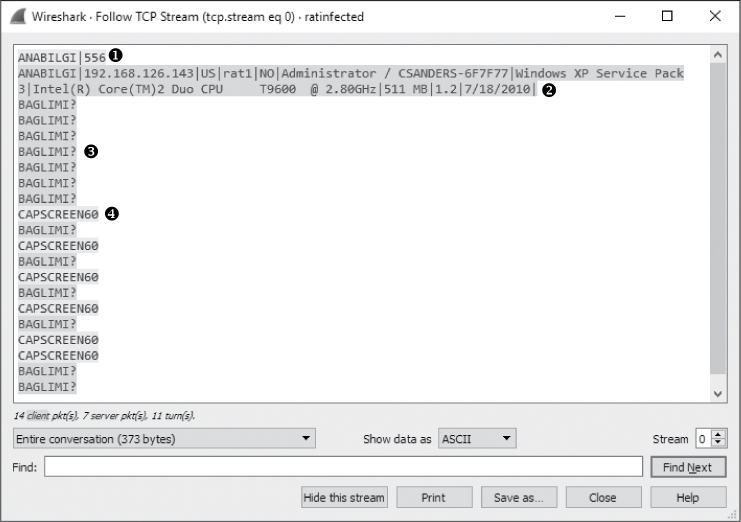
Figure 12-25: The first conversation yields interesting results.
Immediately, we see that the text string ANABILGI|556 is sent from the attacker to the target ➊. As a result, the target responds with some basic system information, including the computer name (CSANDERS-6F7F77) and the operating system in use (Windows XP Service Pack 3) ➋, and begins repeatedly transmitting the string BAGLIMI? back to the attacker ➌. The only communication back from the attacker is the string CAPSCREEN60 ➍, which appears six times.
This CAPSCREEN60 string returned by the attacker is interesting, so let’s see where it leads. To do so, make sure you’ve cleared any display filters and search for the text string CAPSCREEN60 within the packets using the search dialog, specifying the String option and ensuring the Packet bytes option is selected for where to perform the search.
Upon performing this search, we find the first instance of the string in packet 27. The intriguing thing about this bit of information is that as soon as the string is sent from the attacker to the client, the client acknowledges receipt of the packet, and a new conversation is started in packet 29. You should be able to more easily notice the new conversation starting because of the coloring rules that were applied earlier.
Now, if we follow the TCP stream output of this new conversation (shown in Figure 12-26), we see the familiar string ANABILGI|12, followed by the string SH|556 and, finally, the string CAPSCREEN|C:WINDOWSjpgevhook.dat|84972 ➊. Notice the file path specified after the CAPSCREEN string, which is followed by unreadable text. The most intriguing thing here is that the unreadable text is prepended by the string JFIF ➋, which a quick Google search will tell you is commonly found at the beginning of JPG files.
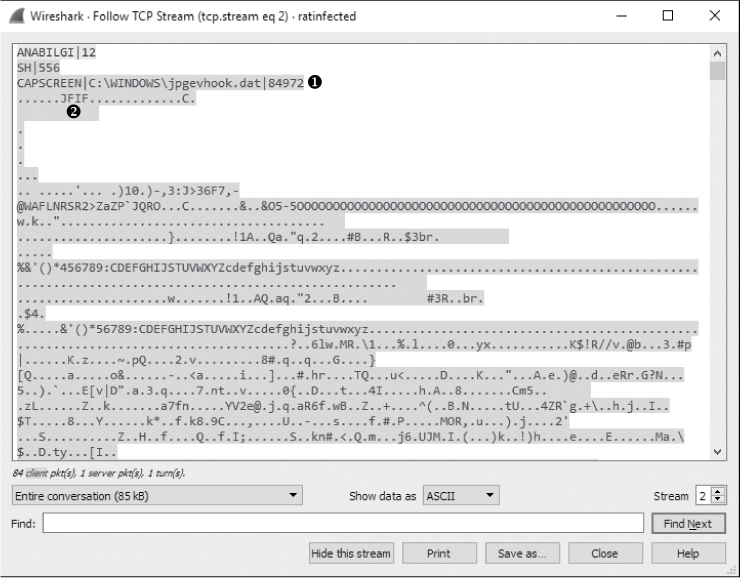
Figure 12-26: The attacker appears to be initiating a request for a JPG file.
At this point, it’s safe to conclude that the attacker initiated the request to transfer this JPG image. But even more importantly, we are beginning to see a command structure evolve from the traffic. It appears that CAPSCREEN is a command sent by the attacker to initiate the transfer of this JPG. In fact, whenever the CAPSCREEN command is sent, the result is the same. To verify this, view the TCP stream of each conversation where the CAPSCREEN command is present or try using Wireshark’s IO graphing feature as follows:
Select Statistics ▶ IO Graph.
Click the plus (+) button to add five lines.
Insert the filters tcp.stream eq 2, tcp.stream eq 3, tcp.stream eq 4, tcp.stream eq 5, and tcp.stream eq 6, respectively, into the Display Filter of the five newly added lines. Give each one a name as well.
Change the y-axis scale for each entry to Bytes/s.
Click the Graph 1, Graph 2, Graph 3, Graph 4, and Graph 5 buttons to enable the data points for the filters specified.
Figure 12-27 shows the resulting graph.
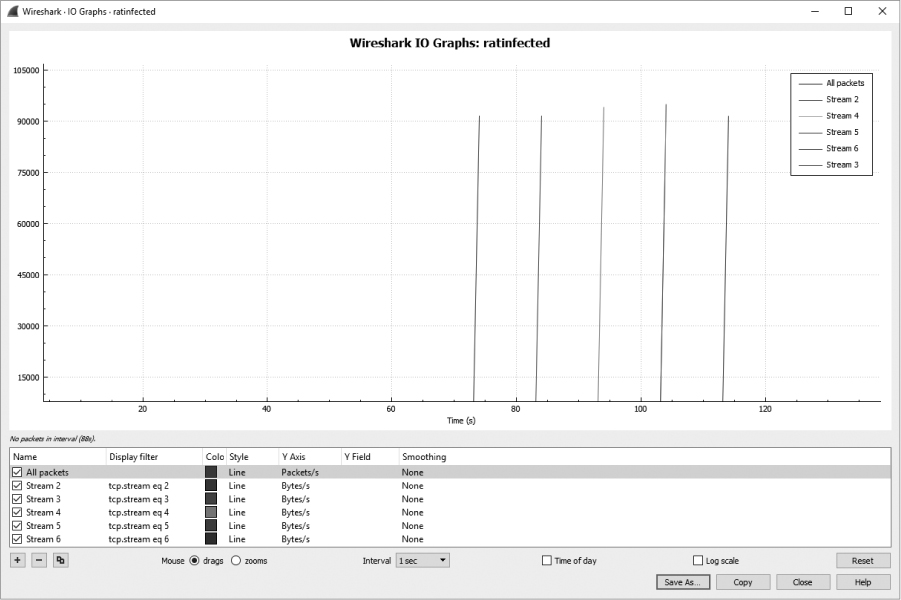
Figure 12-27: This graph shows that similar activity appears to repeat.
Based on this graph, it appears as though each conversation contains roughly the same amount of data and occurs for the same amount of time. We can now conclude that this activity repeats several times.
You may already have some ideas regarding the content of the JPG image being transferred, so let’s see if we can view one of these files. To extract the JPG data from Wireshark, perform the following steps:
First, follow the TCP stream of the appropriate packets as we did with Figure 12-25. Packet 29 is a good choice.
The communication must be isolated so that we see only the stream of data sent from the target to the attacker. Do this by selecting the arrow next to the drop-down that says Entire Conversation (85033 bytes). Be sure to select the appropriate directional traffic, which is 172.16.0.114:6643 --> 172.16.0.111:4433 (85 kB).
In the Show data as drop-down, choose RAW.
Save the data by clicking the Save As button, ensuring that you save the file with a .jpg file extension.
If you try to open the image now, you may be surprised to find that it won’t open. That’s because we have one more step to perform. Unlike the scenario in Chapter 10 where we extracted a file cleanly from FTP traffic, the traffic here added some additional content to the data. In this case, the first two lines seen in the TCP stream are actually part of the malware’s command sequence, not part of the data that makes up the JPG (see Figure 12-28). When we saved the stream, this extraneous data was also saved. As a result, the file viewer that is looking for a JPG file header is seeing content that doesn’t match what it is expecting, and therefore it can’t open the image.
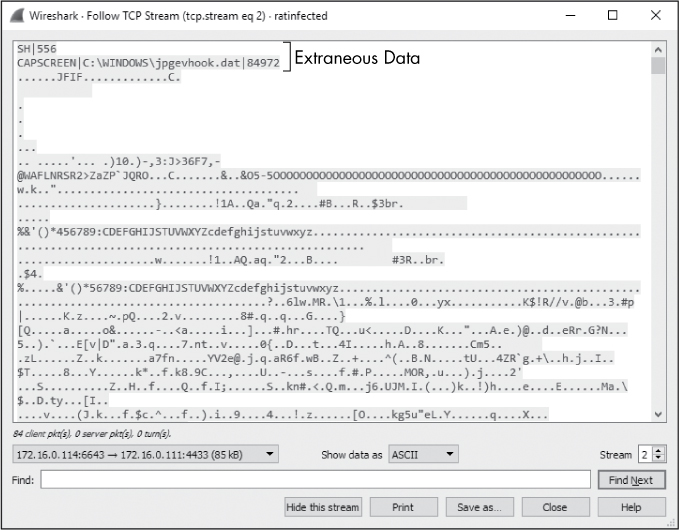
Figure 12-28: The extraneous data added by the malware prevents the file from being opened correctly.
Fixing this issue is a painless process, requiring a bit of manipulation with a hex editor. This process is called file carving. To carve this file from the exported data, complete the following process:
While viewing the TCP Stream in Figure 12-28, click the Save as button. Choose a memorable filename and save the file to a location where you can access it again shortly.
Download and then install WinHex from https://www.x-ways.net/winhex/.
Execute WinHex and open the file you just saved from Wireshark.
Use your mouse to select all the extraneous data at the beginning of the file. This should be everything occurring before, but not including, the bytes FF D8 FF E0, which signify the start of a new JPG file. The bytes to select are highlighted in Figure 12-29.
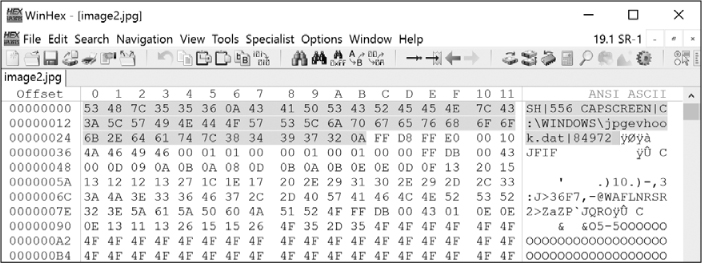
Figure 12-29: Removing the extraneous bytes from the JPG file
Press the Delete key to remove the selected data.
Click the Save button in WinHex’s main toolbar to save your changes.
NOTE
I like WinHex for performing this task on Windows, but any hex editor you’re familiar with will do.
With the unneeded bytes of data removed, you should now be able to open the file. It should be clear that the trojan is taking screen captures of the target’s desktop and transmitting them back to the attacker (Figure 12-30). After these communication sequences have completed, the communication ends with a normal TCP teardown sequence.
This scenario is a prime example of the thought process an intrusion analyst would follow when analyzing traffic based on an IDS alert:
• Examine the alert and the signature that generated it.
• Confirm whether the signature match was in the traffic in the proper context.
• Examine traffic to find out what the attacker did with the compromised machine.
• Begin containment of the issue before any more sensitive information leaks from the compromised target.

Figure 12-30: The JPG being transferred is a screen capture of the target’s computer.
Exploit Kit and Ransomware
cryptowall4_c2.pcapng, ek_to_cryptowall4.pcapng
In our final scenario, we’ll look at another investigation that begins with an alert from an IDS. We’ll explore the live packets being generated from the infected system and then attempt to trace the source of the compromise. This example will utilize real malware that you would be likely to find infecting a device in your network.
The story beings with an IDS alert generated from Snort in the Sguil console, shown in Figure 12-31. Sguil is a tool used to manage, view, and investigate IDS alerts from one or more sensors. It doesn’t provide the most attractive user interface, but it’s been around for a while and is a very popular tool for security analysts.
There is a lot of information about this alert available in Sguil. The upper window ➊ shows a summary of the alert. Here you see the time the alert was generated, the source and destination IP addresses and ports, the protocol, and the event message generated from the matching IDS signature. In this case, 192.168.122.145, the local friendly system, is communicating with an unknown external system at 184.170.149.44 over port 80, which is commonly associated with HTTP traffic. The external system is assumed to be hostile since it has shown up in relation to a signature indicating malicious communication and very little is known about it. The signature that matched this traffic is representative of check-in traffic from the CryptoWall malware family, suggesting that a strain of this malware is installed on the friendly system.
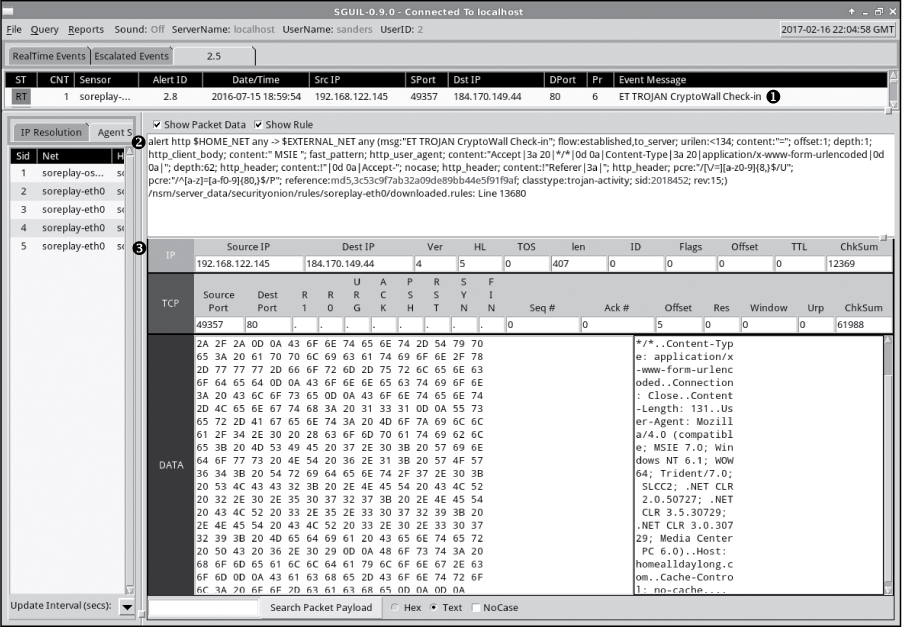
Figure 12-31: This IDS alert indicates a CryptoWall 4 infection.
The Sguil console provides the syntax of the matching rule ➋ and the individual packet data that matched the rule ➌. Notice that the packet information is broken down into protocol header and data sections, similar to how packet information is presented in Wireshark. Unfortunately, Sguil only provides information about a single packet that matched, and we need to dig deeper. The next step is to examine the traffic associated with this alert in Wireshark to attempt to validate the traffic and see what’s going on. That traffic is contained in the file cryptowall4_c2.pcapng.
This packet capture contains the communication that was happening around the time of the alert, and it isn’t overly complex. The first conversation occurs in packets 1 through 16, and we can view it easily by following the TCP stream of that conversation (Figure 12-32). At the start of the capture, the local system opens a TCP connection to the hostile host on port 80 and makes a POST request to the URL http://homealldaylong.com/76N1Lm.php?x4tk7t4jo6 ➊ containing a small amount of alphanumeric data ➋. The hostile host responds with an alphanumeric string ➍ and an HTTP 200 OK response code ➌ before the connection is terminated gracefully.

Figure 12-32: A small amount of data is being transferred between these hosts via HTTP.
If you look through the rest of the capture file, you’ll see that the same sequence repeats between these hosts, with varying amounts of data being transferred each time. Use the filter http.request.method == "POST" to see three different connections with a similar URL structure (Figure 12-33).

Figure 12-33: The URL structure shows different data being passed to the same page.
The 76N1Lm.php portion (the web page) remains the same, but the rest of the content (the parameter and data being passed to the page) varies. The repeating communication sequence combined with the structure of the requests is consistent with command and control (C2) behavior for malware and the signature that generated the alert. It’s therefore likely that the local system is infected with CryptoWall, as the signature suggests. You can further verify this by examining a similar sample on the popular CryptoWall Tracker research page: https://www.cryptowalltracker.org/cryptowall-4.html#networktraffic.
NOTE
Deciphering the data being communicated between the friendly and hostile system during the C2 sequence would be a little complex for this book. But if you’re interested, you can read more about that process here: https://www.cryptowalltracker.org/communication-protocol.html.
Now that you’ve verified that malware-based C2 communication is taking place, it’s a good idea to remediate the issue and address the infected machine. This is especially important when malware such as CryptoLocker is involved, because it attempts to encrypt the user’s data and provides the decryption key only if that user pays a hefty ransom—thus, the term ransom-ware for such malware. The steps to remediate the problem are beyond the scope of this book, but in a real-world scenario, those would be the security analyst’s next actions.
A common follow-up question is how the friendly machine got infected in the first place. If this can be determined, you might find other devices that have been infected with other malware in a similar way, or you may be able to develop protection or detection mechanisms to prevent future infection.
The alert packets only showed the active C2 sequence after the infection. In networks performing security monitoring and continuous packet capture, many network sensors are configured to store packet data for a few extra hours or days for forensic investigations. After all, not every organization is equipped to respond to alerts the second they happen. Temporary storage of packets allows us to look at the packet data from the friendly host just before it started the C2 sequence we saw earlier. Those packets are included in the file ek_to_cryptowall4.pcapng.
A cursory scroll through this packet capture tells us we have a lot more packets to look through, but they are all HTTP. Since we know how HTTP works already, let’s cut to the chase and limit the visible packets to only the requests by using the display filter http.request. This shows 11 HTTP requests originating from the friendly host (Figure 12-34).

Figure 12-34: There are 11 HTTP requests from the friendly host.
The first request is from the friendly host 192.168.122.145 to an unknown external host 113.20.11.49. An examination of the HTTP portion of this packet (Figure 12-35) tells us that the user requested the page http://www.sydneygroup.com.au/index.php/services/ ➊ and was referred from a Bing search for sydneygroup.com.au ➋. So far, this looks normal.
Next, the friendly host makes four requests to another unknown external host at 45.32.238.202 in packets 35, 39, 123, and 130. As you’ve seen in earlier examples, it’s common for a browser to retrieve content from additional hosts when viewing a web page that stores embedded content or advertisements on third-party servers. This by itself is not worrisome, although the domain in these requests looks somewhat random and suspicious.

Figure 12-35: An HTTP request to an unknown external host
Things get interesting in the GET request at packet 39. Following the TCP stream of this exchange (Figure 12-36), you’ll notice that a file named bXJkeHFlYXhmaA is requested ➊. The name of this file is a little odd, and it doesn’t include a file extension either.
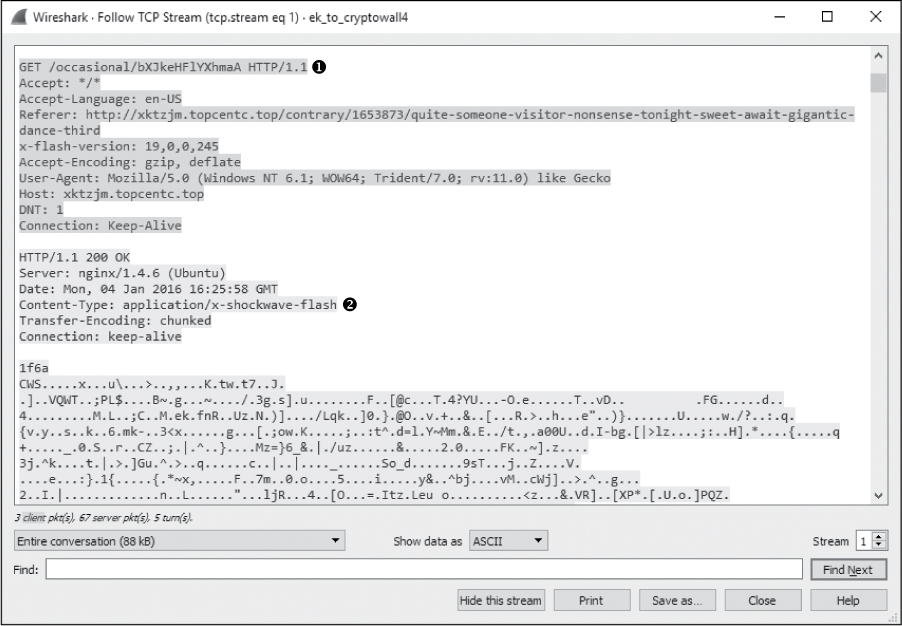
Figure 12-36: An oddly named Flash file is downloaded.
Upon closer inspection, we see that the web server identifies the content of this file as x-shockwave-flash ➋. Flash is a popular plugin used for streaming media within a browser. It’s not abnormal to see Flash content downloaded by a device, but it’s worth noting that Flash is notorious for having software vulnerabilities, and it often goes unpatched. The Flash file is downloaded successfully following the request.
After the Flash file is downloaded, there is a request for another similarly named file in packet 130. Following this TCP stream (Figure 12-37), you see a request for a file named enVjZ2dtcnpz ➊. The file type isn’t identified here with an extension or by the server. The request is followed by the client’s downloading a 358,400-byte chunk of unreadable data ➋.
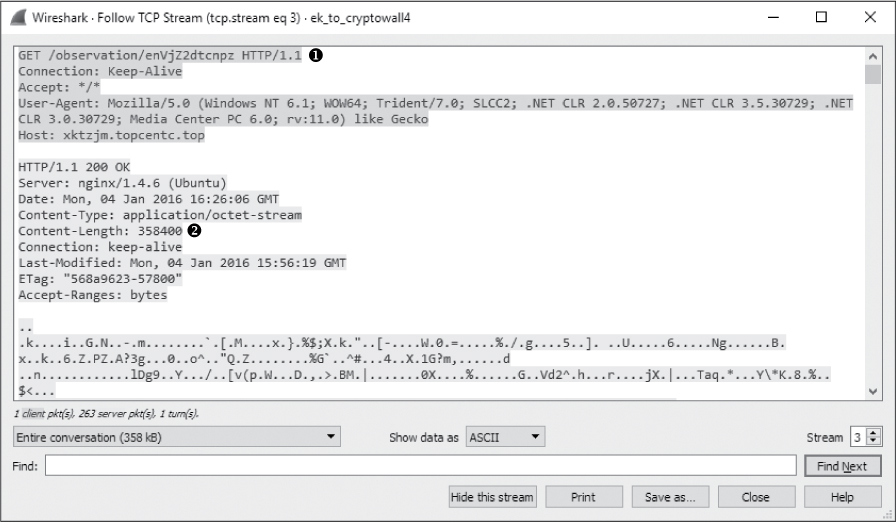
Figure 12-37: Another oddly named file is downloaded, but no file type is identified.
Less than 20 seconds after that file is downloaded, you should see something familiar in the list of HTTP requests from Figure 12-34. Beginning with packet 441, the friendly host starts making HTTP POST requests to two different servers using the same C2 pattern observed earlier. It’s likely we’ve identified the source of the infection. The two files that were downloaded were responsible. The first file from the request in packet 39 delivered a Flash exploit, and the second file from the request in packet 130 delivered the malware.
NOTE
You can use malware analysis techniques to decode and analyze the files contained in the packet capture. If you’re interested in learning more about reverse engineering malware, I recommend Practical Malware Analysis (2012) by Michael Sikorski and Andrew Honig, another No Starch Press book and a personal favorite of mine.
This scenario represents one of the most common infection techniques. A user was browsing the internet and stumbled onto a site that had been infected with malicious redirection code from an exploit kit. These kits infect legitimate servers and are designed to fingerprint clients to determine their vulnerabilities. The infected page is known as the kit’s landing page, and its purpose is to redirect the client to another site containing an exploit the kit has determined will be effective against the system.
The packets you’ve just seen are from the Angler exploit kit, which is perhaps the most frequently observed kit of 2015 and 2016. When the user reached a site that had been infected by Angler, the kit determined the user would be vulnerable to a specific Flash vulnerability. The Flash file was delivered, the system was exploited, and a secondary payload of the CryptoWall malware was downloaded and installed on the host. This entire sequence is depicted in Figure 12-38.
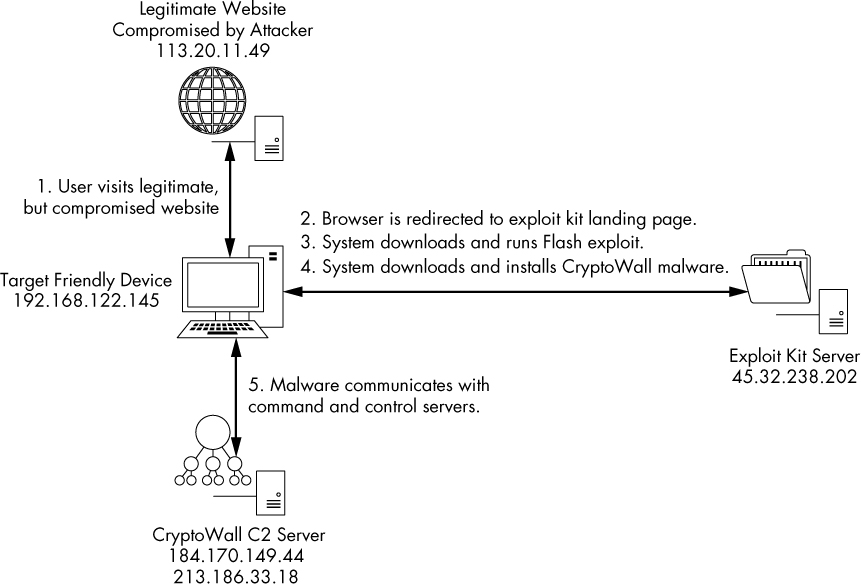
Figure 12-38: The exploit kit infection sequence
Final Thoughts
Entire books could be written on breaking down packet captures in security-related scenarios, analyzing common attacks, and responding to IDS alerts. In this chapter, we’ve examined some common scanning and enumeration techniques, a common MITM attack, and a couple of examples of how a system might be exploited and what might happen as a result.