
10
BASIC REAL-WORLD SCENARIOS

Beginning with this chapter, we’ll dig into the meat of packet analysis as we use Wireshark to analyze real-world network problems. I’ll introduce a series of problem scenarios by describing the context of the problem and providing the information that was available to the analyst at the time. Having laid the groundwork, we’ll turn to analysis as I describe the method used to capture the appropriate packets and step you through the process of working toward a diagnosis. Once analysis is complete, I’ll point toward potential solutions and give an overview of the lessons learned.
Throughout, remember that analysis is a very dynamic process. Thus, the methods I use to analyze each scenario may not be the same ones that you would use. Everyone approaches problem solving and reasoning through their own lens. The most important thing is that the result of the analysis solves a problem, but even when it doesn’t, it’s critical to learn from failures as well. Experience is the thing we get when we don’t get what we want, after all.
In addition, most problems discussed in this chapter can probably be solved with methods that don’t necessarily involve a packet sniffer, but what’s the fun in that? When I was first learning how to analyze packets, I found it helpful to examine typical problems in atypical ways by using packet analysis techniques, which is why I present these scenarios to you.
Missing Web Content
http_espn_fail.pcapng
In the first scenario we’ll look at, our user is Packet Pete, a college basketball fan who doesn’t keep late hours and usually misses the West Coast games. The first thing he does when he sits down at his workstation every morning is visit http://www.espn.com/ for the previous night’s final scores. When Pete browses to ESPN this morning, he finds that the page is taking a long time to load, and when it finally does, most of the images and content are missing (Figure 10-1). Let’s help Pete diagnose this issue.

Figure 10-1: ESPN is failing to load properly.
Tapping into the Wire
This issue is isolated to Pete’s workstation and is not affecting any others, so we’ll start by capturing packets directly from there. To do this, we’ll install Wireshark and capture packets while browsing to the ESPN website. Those packets are found in the file http_espn_fail.pcapng.
Analysis
We know Pete’s issue is that he’s unable to view a website he is browsing to, so we’re primarily going to be looking at the HTTP protocol. If you read the previous chapter, you should have a basic understanding of what HTTP traffic between a client and server looks like. A good place to start looking is at the HTTP requests being made to the remote server. You can do this by applying a filter for GET requests (using http.request.method == "GET"), but this can also be done by simply selecting Statistics ▶ HTTP ▶ Requests from the main drop-down menu (Figure 10-2).

Figure 10-2: Viewing HTTP requests to ESPN
From this overview, it appears the capture is limited to seven different HTTP requests, and they all look like they are associated with the ESPN website. Each request contains the string espn within the domain name, with the exception of cdn.optimizely.com, which is a content delivery network (CDN) used to deliver advertising to a multitude of sites. It’s common to see requests to various CDNs when browsing to websites that host advertisements or other external content.
With no clear leads to follow, the next step is to look at the protocol hierarchy of the capture file by selecting Statistics ▶ Protocol Hierarchy. This will allow us to spot unexpected protocols or peculiar distributions of traffic per protocol (Figure 10-3). Keep in mind that the protocol hierarchy screen is based on the currently applied display filter. Be sure to clear the previously applied filter to get the expected results based on the entire packet capture.

Figure 10-3: Reviewing the protocol hierarchy of the browsing session
The protocol hierarchy isn’t too complex, and we can quickly decipher that there are only two application-layer protocols at work: HTTP and DNS. As you learned in Chapter 9, DNS is used to translate domain names to IP addresses. So, when you browse to a site like http://www.espn.com/, your system may need to send out a DNS query to find the IP address of the remote web server if it doesn’t already know it. Once a DNS reply with the appropriate IP address comes back, that information can be added to a local cache, and HTTP communication (using TCP) can commence.
Although nothing looks out of the ordinary here, the 14 DNS packets are notable. A DNS request for a single domain name is typically contained in a single packet, and the response also constitutes a single packet (unless it’s very large, in which case DNS will utilize TCP). Since there are 14 DNS packets here, it’s possible that as many as seven DNS queries were generated (7 queries + 7 replies = 14 packets). Figure 10-2 did show HTTP requests to seven different domains, but Pete only typed a single URL into his browser. Why are all of these extra requests being made?
In a simple world, visiting a web page would be as easy as querying one server and pulling all of its content in a single HTTP conversation. In reality, an individual web page may provide content hosted on multiple servers. All of the text-based content could be in one place, the graphics could be in another, and embedded videos could be in a third. That doesn’t include ads, which could be hosted on multiple providers spanning dozens of individual servers. Whenever an HTTP client parses HTML code and finds a reference to content on another host, it will attempt to query that host for the content, which can generate additional DNS queries and HTTP requests. This is exactly what happened here when Pete visited ESPN. While he may have intended to view content only from a single source, references to additional content were found in the HTML code, and his browser automatically requested that content from multiple other domains.
Now that we understand why all of these extra requests exist, our next step is to examine the individual conversations associated with each request (Statistics ▶ Conversations). Reviewing the Conversations window (Figure 10-4) provides an important clue.
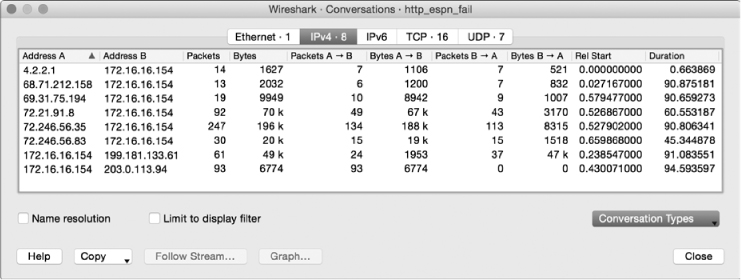
Figure 10-4: Reviewing IP conversations
We discovered earlier that there were seven DNS requests and seven HTTP requests to match. With that in mind, it would be reasonable to expect that there would also be seven matching IP conversations, but that isn’t the case. There are eight. How can that be explained?
One thought might be that the capture was “contaminated” by an additional conversation unrelated to the problem at hand. Ensuring your analysis doesn’t suffer due to irrelevant traffic is certainly something you should be cognizant of, but that isn’t the issue with this conversation. If you examine each HTTP request and note the IP address the request was sent to, you should be left with one conversation that doesn’t have a matching HTTP request. The endpoints for this conversation are Pete’s workstation (172.16.16.154) and the remote IP 203.0.113.94. This conversation is represented by the bottom line in Figure 10-4. We note that 6,774 bytes were sent to this unknown host but zero bytes were sent back: that’s worth digging into.
If you filter down into this conversation (right-click the conversation and choose Apply As Filter ▶ Selected ▶ A<->B), you can apply your knowledge of TCP to identify what’s gone wrong (Figure 10-5).
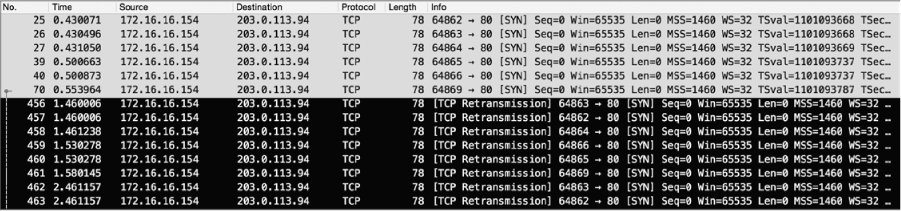
Figure 10-5: Reviewing the unexpected connection
With normal TCP communication, you expect to see a standard SYNSYN/ACK-ACK handshake sequence. In this case, Pete’s workstation sent a SYN packet to 203.0.113.94, but we never see a SYN/ACK response. Not only this, but Pete’s workstation sent multiple SYN packets to no avail, eventually leading his machine to send TCP retransmission packets. We’ll talk more about the specifics of TCP retransmissions in Chapter 11, but the key takeaway here is that one host is sending packets that it never receives a response to. Looking at the Time column, we see that the retransmissions continue for 95 seconds without a response. In network communications, this is slower than molasses.
We have identified seven DNS requests, seven HTTP requests, and eight IP conversations. Since we know that the capture is not contaminated with extra data, it’s reasonable to think that the mysterious eighth IP conversation is probably the source of Pete’s slowly and incompletely loading web page. For some reason, Pete’s workstation is trying to communicate with a device that either doesn’t exist or just isn’t listening. To understand why this is happening, we won’t look at what’s in the capture file; instead, we’ll consider what isn’t there.
When Pete browsed to http://www.espn.com/, his browser identified resources hosted on other domains. To retrieve that data, his workstation generated DNS requests to find their IP addresses, then connected to them via TCP so that an HTTP request for the content could be sent. For the conversation with 203.0.113.94, there is no DNS request to be found. So, how did Pete’s workstation know about that address?
If you remember our discussion about DNS in Chapter 9 or are otherwise familiar with it, you know that most systems implement some form of DNS caching. This allows them to reference a local DNS-to-IP address mapping that has already been retrieved without having to generate a DNS request every time you visit a domain that you frequently communicate with. Eventually, these DNS-to-IP mappings expire, and a new request must be generated. However, if a DNS-to-IP mapping changes and a device doesn’t generate a DNS request to get the new address when visiting the next time, the device will attempt to connect to an address that is no longer valid.
In Pete’s case, that is exactly what happened. Pete’s workstation already had a cached DNS-to-IP mapping for a domain that hosts content for ESPN. Since this cached entry exists, a DNS request was not generated, and his system attempted to go ahead and connect to the old address. However, that address was no longer configured to respond to requests. As a result, the requests timed out, and the content never loaded.
Fortunately for Pete, clearing his DNS cache manually is possible with a few keystrokes on the command line or in a terminal window. Alternatively, he could also just try again in a few minutes when the DNS cache entry will probably have expired so a new request will be generated.
Lessons Learned
That’s a lot of work just to find out that Kentucky beat Duke by 90 points, but we walk away with a deeper understanding of the relationship between network hosts. In this scenario, we were able to work toward a solution by assessing multiple data points related to the requests and conversations occurring within the capture. From there, we were able to spot a few inconsistencies that took us down a path toward finding the failed communication between the client and one of ESPN’s content delivery servers.
In the real world, diagnosing problems is rarely as simple as scrolling through a list of packets and looking for the ones that look funny. Troubleshooting even the simplest problems can result in very large captures that rely on the use of Wireshark’s analysis and statistics features to spot anomalies. Getting familiar with this style of analysis is critical to successful troubleshooting at the packet level.
If you’d like to see an example of what normal communication looks like between a web browser and ESPN, try browsing to the site while capturing traffic yourself and see if you can identify all of the servers responsible for delivering content.
Unresponsive Weather Service
weather_broken.pcapng weather_working.pcapng
Our second scenario once again involves our pal Packet Pete. Among his many hobbies, Pete fancies himself an amateur meteorologist and doesn’t go more than a few hours without checking current conditions and the forecast. He doesn’t rely solely on the local news forecast though; he actually runs a small weather station outside his home that reports data up to https://www.wunderground.com/ for aggregation and viewing. Today, Pete went to check his weather station to see how much the temperature had dropped overnight, but found that his station hadn’t reported in to Wunderground in over nine hours, since around midnight (Figure 10-6).
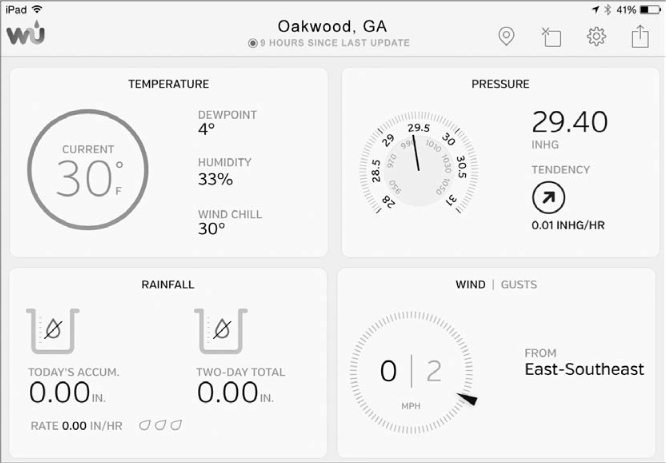
Figure 10-6: The weather station hasn’t sent a report in nine hours.
Tapping into the Wire
In Pete’s network, the weather station mounted on his roof connects to a receiver inside his house through an RF connection. That receiver plugs into his network switch and reports statistics to Wunderground through the internet. This architecture is diagrammed in Figure 10-7.
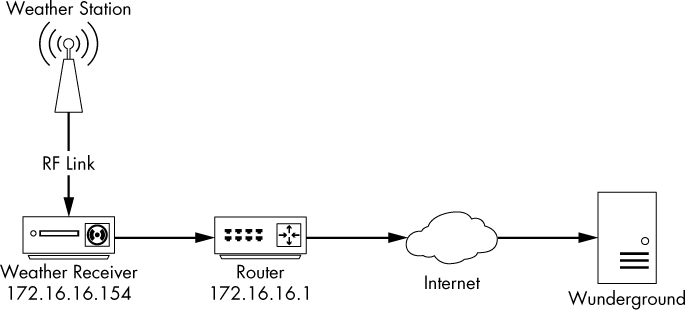
Figure 10-7: Weather station network architecture
The receiver has a simple web-based management page, but Pete logged into it only to find a cryptic message about the last synchronization time with no additional guidance for troubleshooting—the software doesn’t provide any detailed error logging. Since the receiver is the hub of communication for the weather station infrastructure, it makes sense to capture packets transmitted to and from that device to try to diagnose the issue. This is a home network, so port mirroring is probably not an option on the SOHO switch. Our best bet is to use a cheap tap or to perform ARP cache poisoning to intercept these packets. The captured packets are contained in the file weather_broken.pcapng.
Analysis
Upon opening the capture file, you’ll see that we’re dealing with HTTP communication once again. The packet capture is limited to a single conversation between Pete’s local weather receiver 172.16.16.154 and an unknown remote device on the internet, 38.102.136.125 (Figure 10-8).
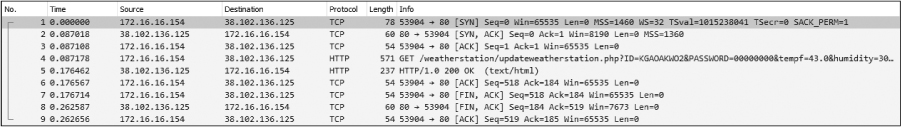
Figure 10-8: Isolated weather station receiver communication
Before we examine the characteristics of the conversation, let’s see if we can identify the unknown IP. Without extensive research, we might not be able to find out whether this is the exact IP address that Pete’s weather receiver should be talking to, but we can at least verify that it is part of the Wunderground infrastructure by doing a WHOIS query. You can conduct a WHOIS query through most domain registration or regional internet registry websites, such as http://whois.arin.net/. In this case, it looks like the IP belongs to Cogent, an internet service provider (ISP) (Figure 10-9). PSINet Inc. is also mentioned here, but a quick search reveals that most PSINet assets were acquired by Cogent in the early 2000s.
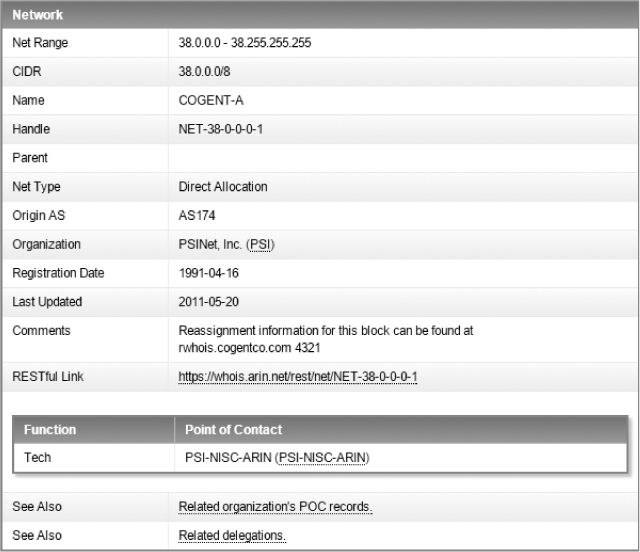
Figure 10-9: WHOIS data identifies the owner of this IP.
In some cases, if an IP address is registered directly to an organization, the WHOIS query will return that organization’s name. However, many times a company will simply utilize IP address space from an ISP without registering it directly to itself. In these cases, another useful tactic is to search for the autonomous system number (ASN) that is associated with an IP address. Organizations are required to register for an ASN to support certain types of routing on the public internet. There are a number of ways to look up IP-to-ASN associations (some WHOIS lookups provide it automatically), but I like using Team Cymru’s automated lookup tool (https://asn.cymru.com/). Using that tool for 38.102.136.125, we see that it is associated with AS 36347, which is associated with “Wunderground – The Weather Channel, LLC, US” (Figure 10-10). That tells us that the device the weather station is communicating with is at least in the right neighborhood. If we were unable to identify the correct affiliation for this address, it might be worth exploring whether Pete’s receiver was talking to the wrong device, but the address checks out.

Figure 10-10: IP-to-ASN lookup for the external IP address
With the unknown host characterized, we can dig into details of the communication. The conversation is relatively short. There is a TCP handshake, a single HTTP GET request and response, and a TCP teardown. The handshake and teardown appear to be successful, so whatever issue we are experiencing is probably contained with the HTTP request itself. To examine this closely, we’ll follow the TCP stream (Figure 10-11).

Figure 10-11: Following the TCP stream of the weather receiver communication
The HTTP communication begins with a GET request from Pete’s weather receiver to Wunderground. No HTTP content was transmitted, but a significant amount of data was transmitted in the URL ➊. Transferring data through the URL query string is common for web applications, and it looks like the receiver is passing weather updates using this mechanism. For instance, you see fields like tempf=43.0, dewptf=13.6, and windchillf=43.0. The Wunderground collection server is parsing the list of fields and parameters from the URL and storing them in a database.
At first glance, everything looks fine with the GET request to the Wunderground server. But a look at the corresponding reply shows an error was reported. The server responded with an HTTP/1.0 200 OK response code ➋, indicating that the GET request was received and successful, but the body of the response contains a useful message, INVALIDPASSWORDID|Password or key and/or id are incorrect ➌.
If you look back up at the request URL, you’ll see the first two parameters passed are ID and PASSWORD. These are used to identify the weather station call sign and authenticate it to the Wunderground server.
In this case, Pete’s weather station ID is correct, but his password is not. For some unknown reason, it has been replaced by zeros. Since the last known successful communication was at midnight, it’s possible an update was applied or the receiver rebooted and lost the password configuration.
NOTE
While many developers choose to pass parameters in URLs, it’s generally frowned upon to do this with passwords as seen here. That’s because requested URLs are transmitted in plaintext when using HTTP without added encryption, such as HTTPS. Therefore, a malicious user who happens to be listening on the wire could intercept your password.
At this point, Pete was able to access his receiver and type in the new password. Shortly thereafter, his weather station began syncing data again. An example of successful weather station communication can be found in weather_working.pcapng. The communication stream is shown in Figure 10-12.
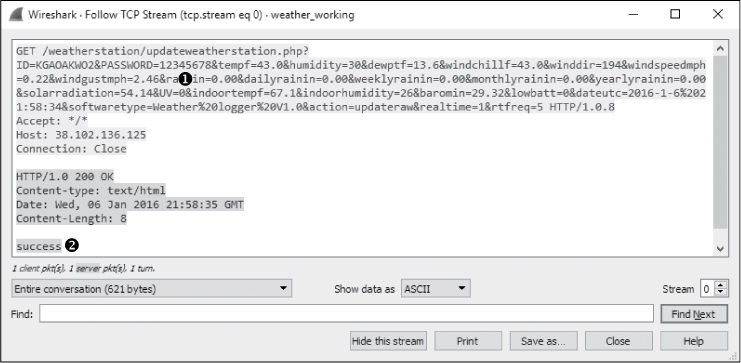
Figure 10-12: Successful weather station communication
The password is now correct ➊, and the Wunderground server responds with a success message in the HTTP response body ➋.
Lessons Learned
In this scenario, we encountered a third-party service that facilitated network communication by using features available within another protocol (HTTP). Fixing communication problems with third-party services is something you’ll encounter often, and packet analysis techniques are very well suited for troubleshooting these services when proper documentation or error logging isn’t available. This is becoming more common now that Internet of Things (IoT) devices, such as this weather station, are popping up all around us.
Fixing such problems requires the ability to inspect unknown traffic sequences and derive how things are supposed to be working. Some applications, such as the HTTP-based weather data transmission in this scenario, are fairly simple. Others are quite complex, requiring multiple transactions, the addition of encryption, or even custom protocols that Wireshark may not natively parse.
As you investigate more third-party services, you’ll eventually start learning about common patterns developers use to facilitate network communication. This knowledge will increase your effectiveness when troubleshooting them.
No Internet Access
In many scenarios, you may need to diagnose and solve internet connectivity problems. We’ll cover some common problems you might encounter.
Gateway Configuration Problems
nowebaccess1.pcapng
Our next scenario presents a common problem: a user cannot access the internet. We have verified that the user can access all the internal resources of the network, including shares on other workstations and applications hosted on local servers.
The network architecture is straightforward, as all clients and servers connect to a series of simple switches. Internet access is handled through a single router serving as the default gateway, and IP-addressing information is provided by DHCP. This is a very common scenario in small offices.
Tapping into the Wire
To determine the cause of the issue, we can have the user attempt to browse the internet while our sniffer is listening on the wire. We use the information from Chapter 2 (see Figure 2-15) to determine the most appropriate method for placing our sniffer.
The switches on our network don’t support port mirroring. We already have to interrupt the user to conduct our test, so we can assume that it is okay to take them offline once again. Even though this isn’t a high-throughput scenario, a TAP would be appropriate here if one were available. The resulting file is nowebaccess1.pcapng.
Analysis
The traffic capture begins with an ARP request and reply, as shown in Figure 10-13. In packet 1, the user’s computer, with a MAC address of 00:25:b3:bf:91:ee and IP address 172.16.0.8, sends an ARP broadcast packet to all computers on the network segment in an attempt to find the MAC address associated with the IP address of its default gateway, 172.16.0.10.

Figure 10-13: ARP request and reply for the computer’s default gateway
A response is received in packet 2, and the user’s computer learns that 172.16.0.10 is at 00:24:81:a1:f6:79. Once this reply is received, the computer has a route to a gateway that should be able to direct it to the internet.
Following the ARP reply, the computer must attempt to resolve the DNS name of the website to an IP address using DNS in packet 3. As shown in Figure 10-14, the computer does this by sending a DNS query packet to its primary DNS server, 4.2.2.2 ➊.
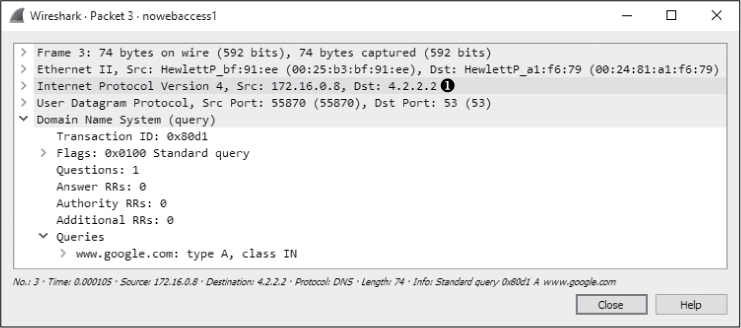
Figure 10-14: A DNS query sent to 4.2.2.2
Under normal circumstances, a DNS server would respond to a DNS query very quickly, but that’s not the case here. Rather than a response, we see the same DNS query sent a second time to a different destination address. As shown in Figure 10-15, in packet 4, the second DNS query is sent to the secondary DNS server configured on the computer, which is 4.2.2.1 ➊.
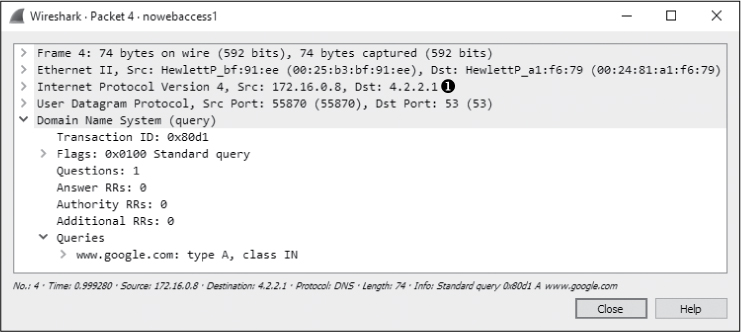
Figure 10-15: A second DNS query sent to 4.2.2.1
Again, no reply is received from the DNS server, and the query is sent again 1 second later to 4.2.2.2. This process repeats itself, alternating between the primary ➊ and secondary ➋ configured DNS servers over the next several seconds, as shown in Figure 10-16. The entire process takes around 8 seconds ➌, or until the user’s internet browser reports that a website is inaccessible.
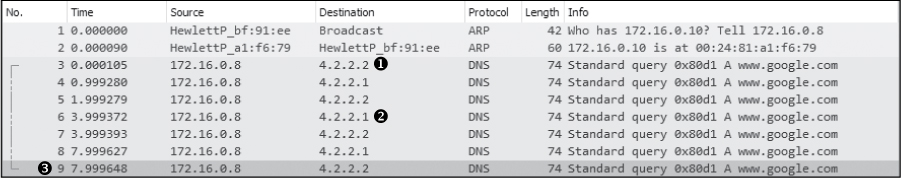
Figure 10-16: DNS queries are repeated until communication stops.
Based on the packets we’ve seen, we can begin to pinpoint the source of the problem. First, we see a successful ARP request to what we believe is the default gateway router for the network, so we know that device is online and communicating. We also know that the user’s computer is actually transmitting packets on the network, so we can assume there isn’t an issue with the protocol stack on the computer itself. The problem clearly begins to occur when the DNS request is made.
In the case of this network, DNS queries are resolved by an external server on the internet (4.2.2.2 or 4.2.2.1). This means that for resolution to take place correctly, the router responsible for routing packets to the internet must successfully forward the DNS queries to the server, and the server must respond. This all must happen before HTTP can be used to request the web page itself.
Because no other users are having issues connecting to the internet, the network router and remote DNS server are probably not the source of the problem. The only thing remaining to investigate is the user’s computer itself.
Upon deeper examination of the affected computer, we find that rather than receiving a DHCP-assigned address, the computer has manually assigned addressing information, and the default gateway address is set incorrectly. The address set as the default gateway is not a router and cannot forward the DNS query packets outside the network.
Lessons Learned
The problem in this scenario resulted from a misconfigured client. While the problem itself turned out to be simple, it significantly impacted the user. Troubleshooting a simple misconfiguration like this one could take quite some time for someone lacking knowledge of the network or the ability to perform a quick packet analysis, as we’ve done here. As you can see, packet analysis is not limited to large and complex problems.
Notice that because we didn’t enter the scenario knowing the IP address of the network’s gateway router, Wireshark didn’t identify the problem exactly, but it did tell us where to look, saving valuable time. Rather than examining the gateway router, contacting our ISP, or trying to find the resources to troubleshoot the remote DNS server, we were able to focus our troubleshooting efforts on the computer itself, which was, in fact, the source of the problem.
NOTE
Had we been more familiar with this particular network’s IP-addressing scheme, analysis could have been even faster. The problem could have been identified immediately once we noticed that the ARP request was sent to an IP address different from that of the gateway router. These simple misconfigurations are often the source of network problems and can typically be resolved quickly with a bit of packet analysis.
Unwanted Redirection
nowebaccess2.pcapng
In this scenario, we again have a user who is having trouble accessing the internet from their workstation. However, unlike the user in the previous scenario, this user can access the internet. Their problem is that they can’t access their home page, https://www.google.com/. When the user attempts to reach any domain hosted by Google, they are directed to a browser page that says, “Internet Explorer cannot display the web page.” This issue is affecting only this particular user.
As with the previous scenario, this is a small network with a few simple switches and a single router serving as the default gateway.
Tapping into the Wire
To begin our analysis, we have the user attempt to browse to https://www.google.com/ while we use a tap to listen to the traffic that is generated. The resulting file is nowebaccess2.pcapng.
Analysis
The capture begins with an ARP request and reply, as shown in Figure 10-17. In packet 1, the user’s computer, with a MAC address of 00:25:b3:bf:91:ee and an IP address of 172.16.0.8, sends an ARP broadcast packet to all computers on the network segment in an attempt to find the MAC address associated with the host’s IP address 172.16.0.102. We don’t immediately recognize this address.

Figure 10-17: ARP request and reply for another device on the network
In packet 2, the user’s computer learns that the IP address 172.16.0.102 is at 00:21:70:c0:56:f0. Based on the previous scenario, we might assume that this is the gateway router’s address and that address is used so that packets can once again be forwarded to the external DNS server. However, as shown in Figure 10-18, the next packet is not a DNS request but a TCP packet from 172.16.0.8 to 172.16.0.102. It has the SYN flag set ➌, indicating that this is the first packet in the handshake for a new TCP-based connection between the two hosts.
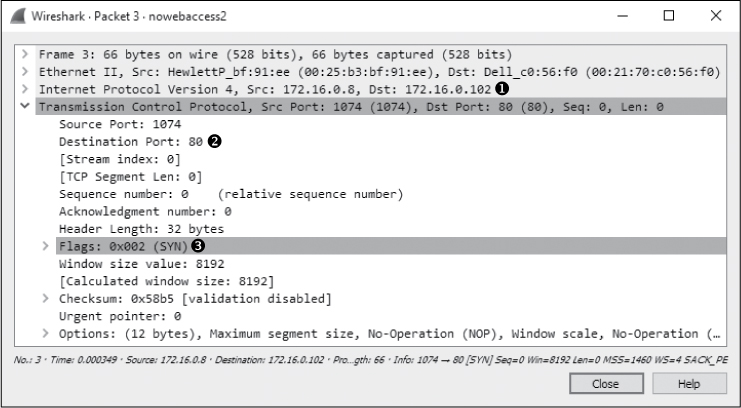
Figure 10-18: TCP SYN packet sent from one internal host to another
Notably, the TCP connection attempt is made to port 80 ➋ on 172.16.0.102 ➊, which is typically associated with HTTP traffic.
As shown in Figure 10-19, this connection attempt is abruptly halted when host 172.16.0.102 sends a TCP packet in response (packet 4) with the RST and ACK flags set ➊.
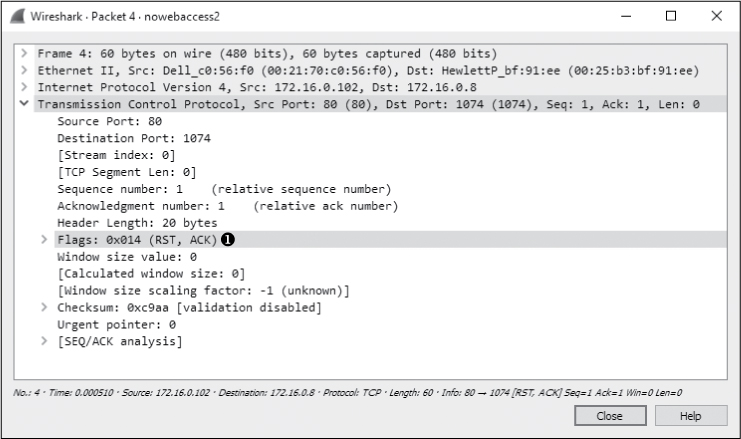
Figure 10-19: TCP RST packet sent in response to the TCP SYN
Recall from Chapter 8 that a packet with the RST flag set is used to terminate a TCP connection. Here, the host at 172.16.0.8 attempted to establish a TCP connection to the host at 172.16.0.102 on port 80. Unfortunately, because that host has no services configured to listen to requests on port 80, the TCP RST packet is sent to terminate the connection. This process repeats three times before communication finally ends, as shown in Figure 10-20. At this point, the user receives a message in their browser saying that the page can’t be displayed.
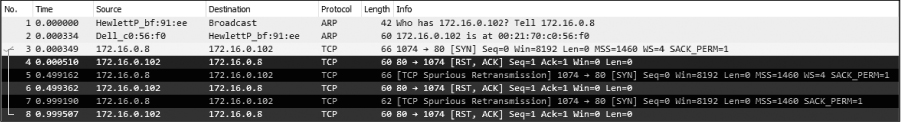
Figure 10-20: The TCP SYN and RST packets are seen three times in total.
After examining the configuration of another network device that is working correctly, we are concerned by the ARP request and reply in packets 1 and 2, because the ARP request isn’t for the gateway router’s actual MAC address but for some unknown device. Following the ARP request and reply, we would expect to see a DNS query sent to our configured DNS server in order to find the IP address associated with https://www.google.com/, but we don’t. There are two conditions that could prevent a DNS query from being made:
• The device initiating the connection already has the DNS name-to-IP address mapping in its DNS cache (as in the first scenario in this chapter).
• The device connecting to the DNS name already has the DNS name-to-IP address mapping specified in its hosts file.
Upon further examination of the client computer, we find that the computer’s hosts file has an entry for https://www.google.com/ associated with the internal IP address 172.16.0.102. This erroneous entry is the source of our user’s problems.
A computer will typically use its hosts file as the authoritative source for DNS name-to-IP address mappings, and it will check that file before querying an outside source. In this scenario, the user’s computer checked its hosts file, found the entry for https://www.google.com/, and decided that https://www.google.com/ was actually on its own local network segment. Next, it sent an ARP request to the host, received a response, and attempted to initiate a TCP connection to 172.16.0.102 on port 80. However, because the remote system was not configured as a web server, it wouldn’t accept the connection attempts.
Once the hosts file entry was removed, the user’s computer began communicating correctly and was able to access https://www.google.com/.
NOTE
To examine your hosts file on a Windows system, open C:WindowsSystem32 driversetchosts. On Linux, view /etc/hosts.
This very common scenario is one that malware has been using for years to redirect users to websites hosting malicious code. Imagine if an attacker were to modify your hosts file so that every time you went to do your online banking, you were redirected to a fake site designed to steal your account credentials!
Lessons Learned
As you continue to analyze traffic, you will learn both how the various protocols work and how to break them. In this scenario, the DNS query wasn’t sent because the client was misconfigured, not because of any external limitations or misconfigurations.
By examining this problem at the packet level, we were able to quickly spot an IP address that was unknown and to determine that the DNS, a key component of this communication process, was missing. Using this information, we were able to identify the client as the source of the problem.
Upstream Problems
nowebaccess3.pcapng
As with the previous two scenarios, in this scenario, a user complains of no internet access from their workstation. This user has narrowed the issue down to a single website, https://www.google.com/. Upon further investigation, we find that this issue is affecting everyone in the organization—no one can access Google domains.
The network is configured as in the two prior scenarios, with a few simple switches and a single router connecting the network to the internet.
Tapping into the Wire
To troubleshoot this issue, we first browse to https://www.google.com/ to generate traffic. Because this issue is network-wide, ideally any device in the network should be able to reproduce the issue using most capture methods. The file resulting from the capture via a tap is nowebaccess3.pcapng.
Analysis
This packet capture begins with DNS traffic instead of the ARP traffic we are used to seeing. Because the first packet in the capture is to an external address, and packet 2 contains a reply from that address, we can assume that the ARP process has already happened and the MAC-to-IP address mapping for our gateway router already exists in the host’s ARP cache at 172.16.0.8.
As shown in Figure 10-21, the first packet in the capture is from the host 172.16.0.8 to address 4.2.2.1 ➊ and is a DNS packet ➋. Examining the contents of the packet, we see that it is a query for the A record for www.google.com ➌ that will map the DNS name to an IP address.

Figure 10-21: DNS query for www.google.com A record
The response to the query from 4.2.2.1 is the second packet in the capture file, as shown in Figure 10-22. Here, we see that the name server that responded to this request provided multiple answers to the query ➊. At this point, all looks good, and communication is occurring as it should.

Figure 10-22: DNS reply with multiple A records
Now that the user’s computer has determined the web server’s IP address, it can attempt to communicate with the server. As shown in Figure 10-23, this process is initiated in packet 3, with a TCP packet sent from 172.16.0.8 to 74.125.95.105 ➊. This destination address comes from the first A record provided in the DNS query response seen in packet 2. The TCP packet has the SYN flag set ➋, and it’s attempting to communicate with the remote server on port 80 ➌.
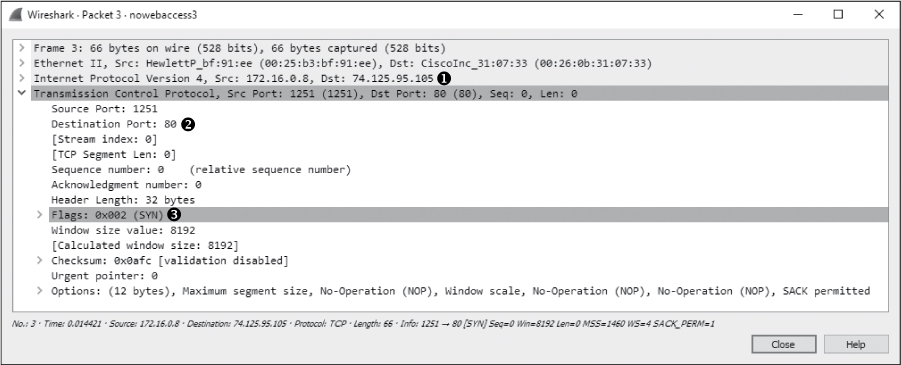
Figure 10-23: The SYN packet is attempting to initiate a connection on port 80.
Because this is a TCP handshake process, we know that we should see a TCP SYN/ACK packet sent in response, but instead, after a short time, another SYN packet is sent from the source to the destination. This process occurs once more after approximately one second, as shown in Figure 10-24, at which point communication stops and the browser reports that the website could not be found.

Figure 10-24: The TCP SYN packet is attempted three times with no response received.
As we troubleshoot this scenario, consider that we know that the workstation within our network can connect to the outside world because the DNS query to our external DNS server at 4.2.2.1 is successful. The DNS server responds with what appears to be a valid address, and our hosts attempt to connect to one of those addresses. Also, the local workstation we are attempting to connect from appears to be functioning.
The problem is that the remote server simply isn’t responding to our connection requests; a TCP RST packet is not sent. This might occur for several reasons: a misconfigured web server, a corrupted protocol stack on the web server, or a packet-filtering device on the remote network (such as a firewall). Assuming there is no local packet-filtering device in place, all other potential solutions are on the remote network and beyond our control. In this case, the web server was not functioning correctly, and no attempt to access it succeeded. Once the problem was corrected on Google’s end, communication was able to proceed.
Lessons Learned
In this scenario, the problem wasn’t one that we could correct. Our analysis determined that the issue wasn’t with the hosts on our network, our router, or the external DNS server providing us with name resolution services. The issue lay outside our network infrastructure.
Sometimes discovering that a problem isn’t really ours not only relieves stress but also saves face when management comes knocking. I have fought with many ISPs, vendors, and software companies who claim that an issue is not their fault, but as you’ve just seen, packets don’t lie.
Inconsistent Printer
In the next scenario, an IT help desk administrator is having trouble resolving a printing issue. Users in the sales department are reporting that the high-volume printer is malfunctioning. When a user sends a large print job to the printer, it will print several pages and then stop printing before the job is done. Multiple driver configuration changes have been attempted but have been unsuccessful. The help desk staff would like you to ensure that this isn’t a network problem.
Tapping into the Wire
inconsistent_printer.pcapng
The common thread in this problem is the printer, so we begin by placing our sniffer as close to the printer as we can. While we can’t install Wireshark on the printer itself, the switches used in this network are advanced layer 3 switches, so we can use port mirroring. We’ll mirror the port used by the printer to an empty port and connect a laptop with Wireshark installed to this port. Once this setup is complete, we’ll have a user send a large print job to the printer so we can monitor the output. The resulting capture file is inconsistent_printer.pcapng.
Analysis
A TCP handshake between the network workstation sending the print job (172.16.0.8) and the printer (172.16.0.253) initiates the connection at the start of the capture file. Following the handshake, a 1,460-byte TCP data packet ➊ is sent to the printer in packet 4 (Figure 10-25). The amount of data can be seen in the far right side of the Info column in the Packet List pane or at the bottom of the TCP header information in the Packet Details pane.
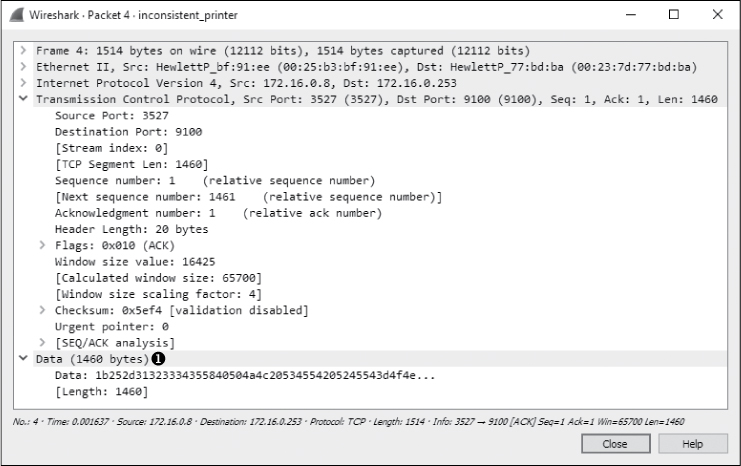
Figure 10-25: Data being transmitted to the printer over TCP
Following packet 4, another data packet is sent containing 1,460 bytes of data ➊, as you can see in Figure 10-26. This data is acknowledged by the printer in packet 6 ➋.

Figure 10-26: Normal data transmission and TCP acknowledgments
The flow of data continues until the last few packets in the capture are reached. Packet 121 is a TCP retransmission packet, and a sign of trouble, as shown in Figure 10-27.
A TCP retransmission packet is sent when one device sends a TCP packet to a remote device and the remote device doesn’t acknowledge the transmission. Once a retransmission threshold is reached, the sending device assumes that the remote device did not receive the data, and it retransmits the packet. This process is repeated a few times before communication effectively stops.
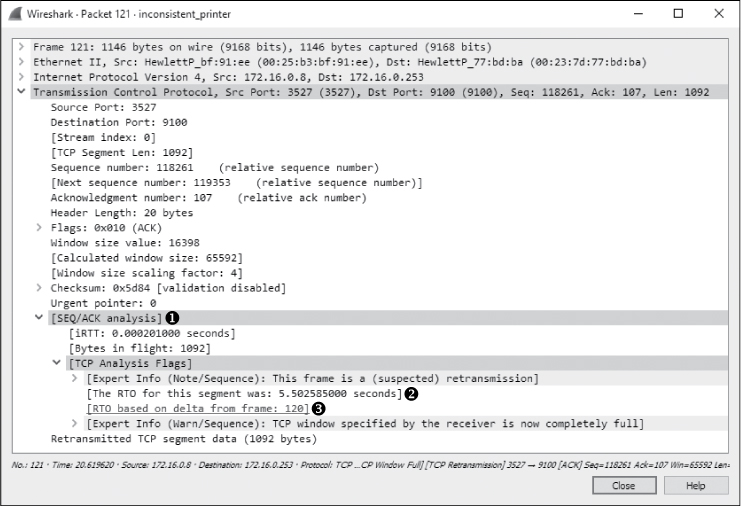
Figure 10-27: These TCP retransmission packets are a sign of a potential problem.
In this scenario, the retransmission is sent from the client workstation to the printer because the printer failed to acknowledge the transmitted data. As shown in Figure 10-27, if you expand the SEQ/ACK analysis portion of the TCP header ➊ along with the additional information beneath it, you can view the details of why this is a retransmission. According to the details processed by Wireshark, packet 121 is a retransmission of packet 120 ➌. Additionally, the retransmission timeout (RTO) for the retransmitted packet was around 5.5 seconds ➋.
When analyzing the delay between packets, you can change the time display format to suit your situation. In this case, because we want to see how long the retransmissions occurred after the previous packet was sent, change this option by selecting View ▶ Time Display Format and select Seconds Since Previous Captured Packet. Then, as shown in Figure 10-28, you can clearly see that the retransmission in packet 121 occurs 5.5 seconds after the original packet (packet 120) is sent ➊.
Figure 10-28: Viewing the time between packets is useful for troubleshooting.
The next packet is another retransmission of packet 120. The RTO of this packet is 11.10 seconds, which includes the 5.5 seconds from the RTO of the previous packet. A look at the Time column of the Packet List pane tells us that this retransmission was sent 5.6 seconds after the previous retransmission. This appears to be the last packet in the capture file, and, not coincidentally, the printer stops printing at approximately this time.
In this scenario, we have the benefit of dealing with only two devices inside our own network, so we just need to determine whether the client workstation or the printer is to blame. We can see that data is flowing correctly for quite some time, and then at some point, the printer simply stops responding to the workstation. The workstation gives its best effort to get the data to its destination, as evidenced by the retransmissions, but the effort is met with no response. This issue is reproducible and happens regardless of which computer sends a print job, so we assume the printer is the source of the problem.
After further analysis, we find that the printer’s RAM is malfunctioning. When large print jobs are sent to the printer, it prints only a certain number of pages, likely until certain regions of memory are accessed. At that point, the memory issue causes the printer to be unable to accept any new data, and it ceases communication with the host transmitting the print job.
Lessons Learned
Although this printer problem wasn’t the result of a network issue, we were able to use Wireshark to pinpoint the problem. Unlike previous scenarios, this one centered solely on TCP traffic. Since TCP is concerned about reliably transmitting data, it often leaves us with useful information when two devices simply stop communicating.
In this case, when communication abruptly stopped, we were able to pinpoint the location of the problem based on nothing more than TCP’s built-in retransmission functionality. As we continue through our scenarios, we will often rely on functionality like this to troubleshoot more complex issues.
No Branch Office Connectivity
stranded_clientside.pcapng stranded_branchdns.pcapng
In this scenario, we have a company with a central headquarters office and a newly deployed remote branch office. The company’s IT infrastructure is mostly contained within the central office using a Windows server-based domain. This infrastructure is supported by a domain controller, a DNS server, and an application server used to host web-based software used daily by the organization’s employees. The branch office is connected by routers to establish a wide area network (WAN) link. Inside the branch office are user workstations and a slave DNS server that should receive its resource record information from the upstream DNS server at the corporate headquarters. Figure 10-29 shows a map of each office and how the offices are linked together.
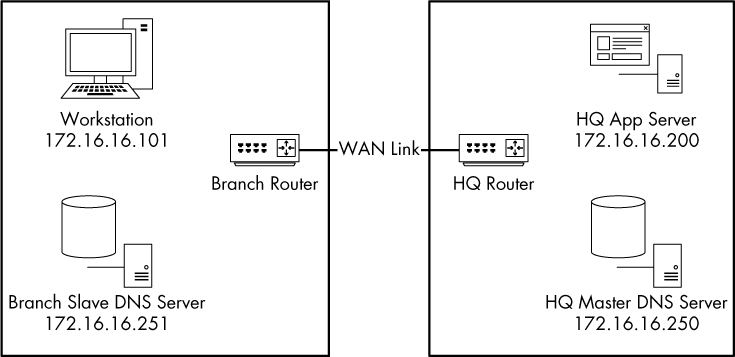
Figure 10-29: The relevant components for the stranded branch office issue
The deployment team is rolling out new infrastructure to the branch office when it finds that no one can access the intranet web application server from the branch office network. This server is located at the main office and is accessed through the WAN link. This connectivity issue affects all users at the branch office. All users can access the internet and other resources within the branch.
Tapping into the Wire
Because the problem lies in communication between the main and branch offices, there are a couple of places we could collect data to start tracking down the problem. The problem could be with the clients inside the branch office, so we’ll start by port mirroring one of those computers to check what it sees on the wire. Once we’ve collected that information, we can use it to point toward other collection locations that might help solve the problem. The initial capture file obtained from one of the clients is stranded_clientside.pcapng.
Analysis
As shown in Figure 10-30, our first capture file begins when the user at the workstation address 172.16.16.101 attempts to access an application hosted on the headquarter’s app server, 172.16.16.200. This capture contains only two packets. It appears as though a DNS request is sent to 172.16.16.251 ➊ for the A record ➌ for appserver ➋ in the first packet. This is the DNS name for the server at 172.16.16.200 in the central office.
As you can see in Figure 10-31, the response to this packet is a server failure ➊, which indicates that something is preventing the DNS query from resolving successfully. Notice that this packet does not answer the query ➋ since it is an error (server failure).
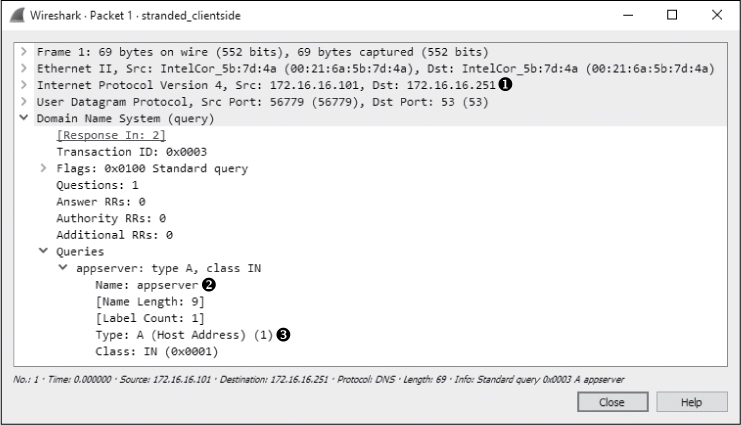
Figure 10-30: Communication begins with a DNS query for the appserver A record.

Figure 10-31: The query response indicates a problem upstream.
We now know that the communication problem is related to some DNS issue. Because the DNS queries at the branch office are resolved by the on-site DNS server at 172.16.16.251, that’s our next stop.
To capture the appropriate traffic from the branch DNS server, we’ll leave our sniffer in place and simply change the port-mirroring assignment so that the DNS server’s traffic, rather than the workstation’s traffic, is now mirrored to our sniffer. The result is the file stranded_branchdns.pcapng.
As shown in Figure 10-32, this capture begins with the query and response we saw earlier, along with one additional packet. This additional packet looks a bit odd because it is attempting to communicate with the primary DNS server at the central office (172.16.16.250) ➊ on the standard DNS server port 53 ➌, but it is not the UDP ➋ we’re used to seeing.
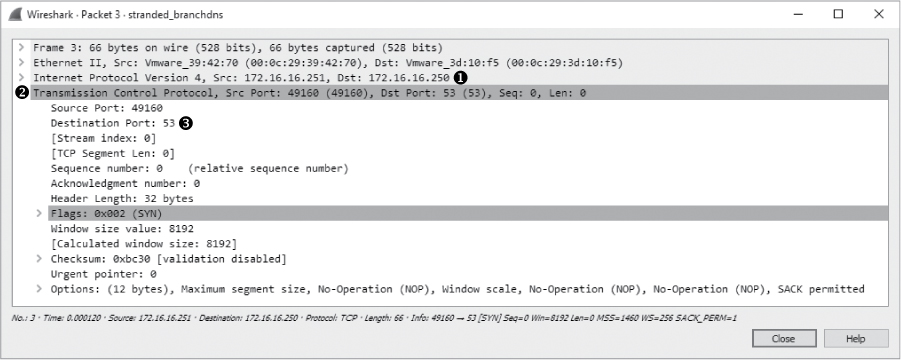
Figure 10-32: This SYN packet uses port 53 but is not UDP.
To figure out the purpose of this packet, recall our discussion of DNS in Chapter 9. DNS usually uses UDP, but it uses TCP when the response to a query exceeds a certain size. In that case, we’ll see some initial UDP traffic that triggers the TCP traffic. TCP is also used for DNS during a zone transfer, when resource records are transferred between DNS servers, which is likely the case here.
The DNS server at the branch office location is a slave to the DNS server at the central office, meaning that it relies on it in order to receive resource records. The application server that users in the branch office are trying to access is located inside the central office, which means that the central office DNS server is authoritative for that server. For the branch office server to resolve a DNS request for the application server, the DNS resource record for that server must be transferred from the central office DNS server to the branch office DNS server. This is likely the source of the SYN packet in this capture file.
The lack of response to this SYN packet tells us that the DNS problem is the result of a failed zone transfer between the branch and central office DNS servers. Now we can go one step further by figuring out why the zone transfer is failing. The possible culprits for the issue can be narrowed down to the routers between the offices or the central office DNS server itself. To determine which is at fault, we can sniff the traffic of the central office DNS server to see whether the SYN packet is making it to the server.
I haven’t included a capture file for the central office DNS server traffic because there was none. The SYN packet never reached the server. Upon dispatching technicians to review the configuration of the routers connecting the two offices, it was found that inbound port 53 traffic on the central office router was configured to allow only UDP traffic and to block inbound TCP traffic. This simple misconfiguration prevented zone transfers from occurring between servers, thus preventing clients within the branch office from resolving queries for devices in the central office.
Lessons Learned
You can learn a lot about investigating network communication issues by watching crime dramas. When a crime occurs, the detectives begin by interviewing those most affected. Leads that result from that examination are pursued, and the process continues until a culprit is found.
In this scenario, we began by examining the target (the workstation) and established leads by finding the DNS communication issue. Our leads led us to the branch DNS server, then to the central DNS server, and finally to the router, which was the source of the problem.
When performing analysis, try thinking of packets as clues. The clues don’t always tell you who committed the crime, but they often take you to the culprit eventually.
Software Data Corruption
tickedoffdeveloper.pcapng
Some of the most frequent arguments in IT are between developers and network administrators. Developers always blame poor network engineering and malfunctioning equipment for program errors. In turn, network administrators tend to blame bad code for network errors and slow communication.
In this scenario, a programmer has developed an application for tracking the sales at multiple stores and reporting back to a central database. To save bandwidth during normal business hours, the application does not update in real time. Data is accumulated throughout the day and then transmitted at night as a comma-separated value (CSV) file to be inserted into the central database.
This newly developed application isn’t functioning correctly. The files sent from the stores are being received by the server, but the data being inserted into the database is not correct. Sections are missing, data is in the wrong place, and some portions of the data are missing. Much to the dismay of the network administrator, the programmer blames the network for the issue. They are convinced that the files are becoming corrupted while in transit from the stores to the central data repository. Our goal is to determine whether they are right.
Tapping into the Wire
To collect the data we need, we can capture packets at one of the stores or at the central office. Because the issue is affecting all the stores, it should occur at the central office if it is network related—that is the only common thread among all stores (other than the software itself).
The network switches support port mirroring, so we’ll mirror the port the server is plugged into and sniff its traffic. The traffic capture will be isolated to a single instance of a store uploading its CSV file to the collection server. This result is the capture file tickedoffdeveloper.pcapng.
Analysis
We know nothing about the application the programmer has developed, other than the basic flow of information on the network. The capture file appears to start with some FTP traffic, so we’ll investigate to see whether it is indeed the mechanism that is transporting this file.
Looking at the packet list first (Figure 10-33), we can see that 172.16.16.128 ➊ initiates communication to 172.16.16.121 ➋ with a TCP handshake. Since 172.16.16.128 initiates the communication, we can assume that it is the client and that 172.16.16.121 is the server that compiles and processes the data. Following the handshake completion, we begin seeing FTP requests from the client and responses from the server ➌.
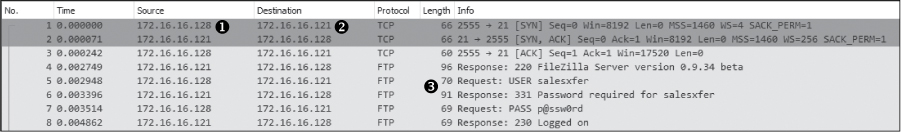
Figure 10-33: The initial communication helps identify the client and server.
We know that some transfer of data should be happening here, so we can use our knowledge of FTP to locate the packet where this transfer begins. The FTP connection and data transfer are initiated by the client, so from 172.16.16.128 we should see the FTP STOR command, which is used to upload data to an FTP server. The easiest way to find this command is to build a filter.
Because this capture file is littered with FTP request commands, rather than sorting through the hundreds of protocols and options in the expression builder, we can build the filter we need directly from the Packet List pane. To do so, we first need to select a packet with an FTP request command present. We’ll choose packet 5, since it’s near the top of our list. Then expand the FTP section in the Packet Details pane and expand the USER section. Right-click the Request Command: USER field and select Prepare a Filter. Finally, choose Selected.
This will prepare a filter for all packets that contain the FTP USER request command and put it in the filter dialog. Next, as shown in Figure 10-34, edit the filter by replacing the word USER with the word STOR ➊.

Figure 10-34: This filter helps identify where data transfer begins.
We could narrow down the filter further by providing the client’s IP address and specifying it as the source of the connection by adding && ip.src == 172.16.16.128 to the filter, but since this capture file is already isolated to a single client, that isn’t necessary here.
Now apply this filter by pressing ENTER, and you’ll see that only one instance of the STOR command exists in the capture file, at packet 64 ➋.
Now that we know where data transfer begins, click the packet to select it and clear the filter by clicking the X button above the Packet List pane. Your screen should now show all the packets with packet 64 selected.
Examining the capture file beginning with packet 64, we see that this packet specifies the transfer of the file store4829-03222010.csv ➊, as shown in Figure 10-35.

Figure 10-35: The CSV file is being transferred using FTP.
The packets following the STOR command use a different port but are identified as part of an FTP-DATA transmission. We’ve verified that data is being transferred, but we have yet to establish whether the programmer is right or wrong. To do so, we need to show whether the contents of the file are intact after traversing the network, so we’ll proceed to extract the transferred file from the captured packets.
When a file is transferred across a network in an unencrypted format, it is broken down into segments and reassembled at its destination. In this scenario, we captured packets as they reached their destination but before they were reassembled. The data is all there; we simply need to reassemble it by extracting the file as a data stream. To perform the reassembly, select any of the packets in the FTP-DATA stream (such as packet 66) and click Follow TCP Stream. The results are displayed as shown in Figure 10-36. This looks like a normal CSV-formatted text file containing sales order data.
The data appears because it is being transferred in plaintext over FTP, but we can’t be sure that the file is intact based on the stream alone. To reassemble the data so as to extract it in its original format, click the Save As button and specify the name of the file as displayed in packet 64. Then click Save.
The result of this save operation should be a CSV file that is an exact byte-level copy of the file originally transferred from the store system. The file can be verified by comparing the MD5 hash of the original file with that of the extracted file. The MD5 hashes should be the same, as shown in Figure 10-37.

Figure 10-36: The TCP stream shows what appears to be the data being transferred.
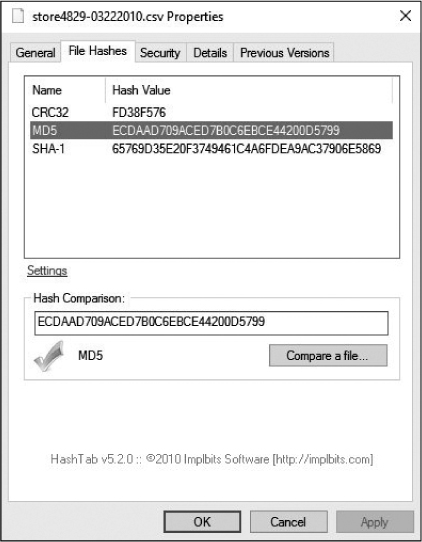
Figure 10-37: The MD5 hashes of the original file and the extracted file are equivalent.
Once the files are compared, we can state that the network is not to blame for the database corruption occurring within the application. The file transferred from the store to the collection server is intact when it reaches the server, so any corruption must be occurring when the file is processed by the application on the server side.
Lessons Learned
One great thing about packet-level analysis is that you don’t need to deal with the clutter of applications. Poorly coded applications greatly outnumber the good ones, but at the packet level, none of that matters. In this case, the programmer was concerned about all of the mysterious components their application was dependent upon, but at the end of the day, their complicated data transfer that took hundreds of lines of code is still no more than FTP, TCP, and IP. Using what we know about these basic protocols, we were able to ensure the communication process was flowing correctly and even extract files to prove the soundness of the network. It’s crucial to remember that no matter how complex the issue at hand, it still comes down to packets.
Final Thoughts
In this chapter, we’ve covered several scenarios in which packet analysis allowed us to gain a better understanding of problematic communication. Using basic analysis of common protocols, we were able to track down and solve network problems in a timely manner. While you may not encounter exactly the same scenarios on your network, the analysis techniques presented here should prove useful as you analyze your own unique problems.