
2
TAPPING INTO THE WIRE

A key decision for effective packet analysis is where to physically position a packet sniffer to appropriately capture the data. Packet analysts often refer to placing the packet sniffer as sniffing the wire, tapping the network, or tapping into the wire.
Unfortunately, sniffing packets isn’t as simple as plugging a laptop into a network port and capturing traffic. In fact, it’s sometimes more difficult to place a packet sniffer on a network than it is to actually analyze the packets. Sniffer placement is challenging because devices can be connected using a large variety of networking hardware. Figure 2-1 illustrates a typical situation. Because the devices on a modern network (switches and routers) each handle traffic differently, you must take into account the physical setup of the network you are analyzing.
The goal of this chapter is to help you develop an understanding of packet sniffer placement in a variety of different network topologies. But first, let’s look at how we’re able to see all the packets that cross the wire we’re tapping into.
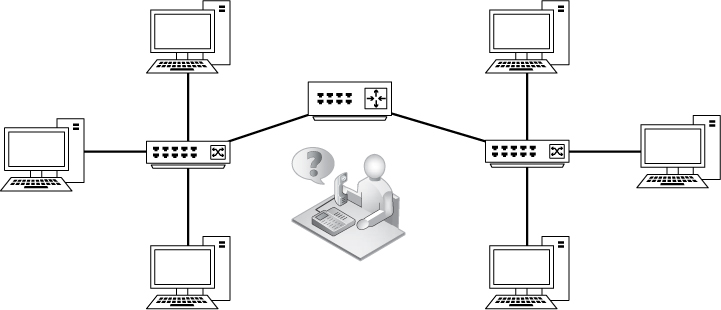
Figure 2-1: Placing your sniffer on the network can be challenging when there are many connections, and getting the data you want can be tricky.
Living Promiscuously
Before you can sniff packets on a network, you need a network interface card (NIC) that supports a promiscuous mode driver. Promiscuous mode is what allows a NIC to view all packets crossing the wire.
As you learned in Chapter 1, with network broadcast traffic, it’s common for devices to receive packets that are not actually destined for them. For example, the Address Resolution Protocol (ARP), a crucial fixture on any network that we’ll examine in depth in Chapter 7, is used to determine which MAC address corresponds to a particular IP address. To find the matching MAC address, a device sends an ARP broadcast packet to every device on its broadcast domain in hopes that the correct one will respond.
A broadcast domain (the network segment where any computer can directly transmit to another computer without going through a router) can consist of several devices, but only the correct recipient device on that domain should be interested in the ARP broadcast packet that’s transmitted. It would be terribly inefficient for every device on the network to process the ARP broadcast packet. Instead, if the packet is not destined for the device and therefore isn’t useful to it, the device’s NIC discards the packet rather than passing it to the CPU for processing.
Discarding packets not destined for the receiving host improves processing efficiency, but it’s not so great for packet analysts. As analysts, we typically want to capture every packet sent across the wire so we don’t risk missing some crucial piece of information.
We can ensure we capture all of the traffic by using the NIC’s promiscuous mode. When operating in promiscuous mode, the NIC passes every packet it sees to the host’s processor, regardless of addressing. Once the packet makes it to the CPU, a packet-sniffing application can grab it for analysis.
Most modern NICs support promiscuous mode, and Wireshark includes the libpcap/WinPcap driver, which allows it to switch your NIC directly into promiscuous mode from the Wireshark GUI. (We’ll talk more about libpcap/WinPcap in Chapter 3.)
For the purposes of this book, you must have a NIC and an operating system that support the use of promiscuous mode. The only time you don’t need to sniff in promiscuous mode is when you want to see only the traffic sent directly to the MAC address of the interface from which you are sniffing.
NOTE
Most operating systems (including Windows) will not let you use a NIC in promiscuous mode unless you have elevated user privileges. If you can’t legally obtain these privileges on a system, chances are that you shouldn’t be performing any type of packet sniffing on that particular network.
Sniffing Around Hubs
Sniffing on a network that has hubs installed is a dream for any packet analyst. As you learned in Chapter 1, traffic sent through a hub goes through every port connected to that hub. Therefore, to analyze the traffic running through a computer connected to a hub, all you need to do is connect a packet sniffer to an empty port on the hub. You’ll be able to see all communication to and from that computer, as well as all communication between any other devices plugged into that hub. As illustrated in Figure 2-2, your visibility window is limitless when your sniffer is connected to a hub-based network.
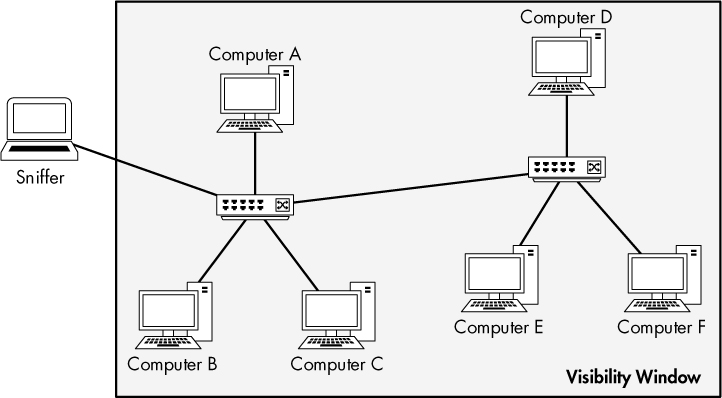
Figure 2-2: Sniffing on a hub network provides a limitless visibility window.
NOTE
The visibility window, as shown in various diagrams throughout this book, represents the devices on the network whose traffic you can see with a packet sniffer.
Unfortunately for us, hub-based networks are rare because of the headaches they cause network administrators. Since only one device can communicate through a hub at any one time, a connected device must compete for bandwidth with all the other devices trying to communicate. When two or more devices communicate at the same time, packets collide, as shown in Figure 2-3. The result may be packet loss, and the communicating devices may compensate for that loss by retransmitting packets, increasing network congestion. As the level of traffic and number of collisions increase, devices may need to transmit a packet three or four times, and network performance decreases dramatically. It’s therefore easy to understand why most modern networks of any size use switches. Although you’ll rarely find hubs in use on modern networks, you’ll occasionally run into them on networks that support legacy hardware or specialized devices, such as industrial control system (ICS) networks.
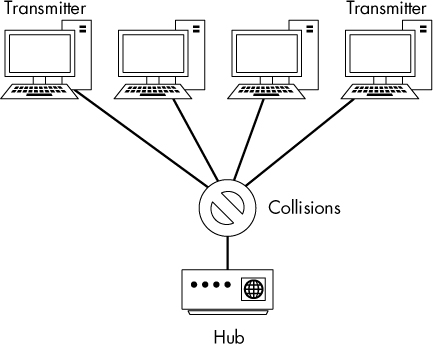
Figure 2-3: Collisions occur on a hub network when two or more devices transmit at the same time.
The easiest way to identify whether a hub is in use in a network is to lay eyes on the server room or networking closet. Most hubs are labeled as such. When all else fails, just look in the darkest corner of the server closet for the network hardware with a few inches of dust on it.
Sniffing in a Switched Environment
Switches are the most common type of connection device used in modern networks. They provide an efficient way to transport data via broadcast, unicast, and multicast traffic. Switches allow full-duplex communication, meaning that machines can send and receive data simultaneously.
Unfortunately for packet analysts, switches add complexity. When you connect a sniffer to a port on a switch, you can see only broadcast traffic and the traffic transmitted and received by the device the sniffer is installed on, as shown in Figure 2-4. To capture traffic from a target device on a switched network, you need to take an additional step.
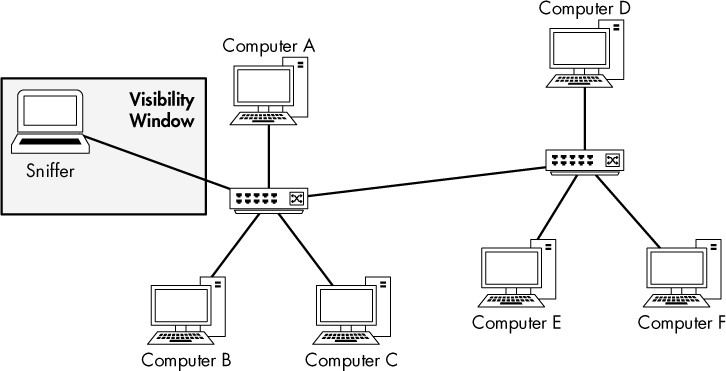
Figure 2-4: The visibility window on a switched network is limited to the port you are plugged into.
There are four primary ways to capture this traffic: port mirroring, hubbing out, using a tap, and ARP cache poisoning.
Port Mirroring
Port mirroring, or port spanning, is perhaps the easiest way to capture the traffic from a target device on a switched network. In this type of setup, you must have access to the command line or web management interface of the switch on which the target computer is located. Also, the switch must support port mirroring and have an empty port into which you can plug your sniffer.
To enable port mirroring, you issue a command that forces the switch to copy all traffic on one port to another port. For instance, to capture all the traffic transmitted and received from a device on port 3 of a switch, you could plug your analyzer into port 4 and mirror port 3 to port 4. Figure 2-5 illustrates port mirroring.
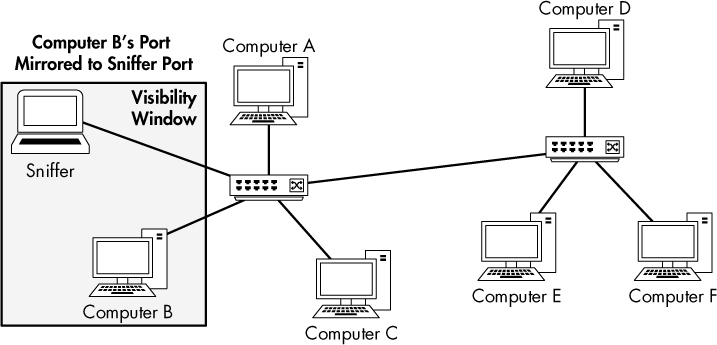
Figure 2-5: Port mirroring allows you to expand your visibility window on a switched network.
How you set up port mirroring depends on the manufacturer of your switch. For most enterprise switches, you’ll need to log in to a command line interface and configure port mirroring using a specific command. You’ll find a list of example port-mirroring commands in Table 2-1.
Table 2-1: Commands Used to Enable Port Mirroring
Manufacturer |
Command |
Cisco |
set span <source port> <destination port> |
Enterasys |
set port mirroring create <source port> <destination port> |
Nortel |
port-mirroring mode mirror-port <source port> monitor-port <destination port> |
NOTE
Some enterprise switches provide web-based GUIs that offer port mirroring as an option, but these aren’t common and aren’t standardized. However, if your switch provides an effective way to configure port mirroring through a GUI, by all means use it. Additionally, more small office and home office (SOHO) switches are beginning to provide port-mirroring capabilities, and those are typically configured with a GUI.
When port mirroring, be aware of the throughput of the ports you are mirroring. Some switch manufacturers allow you to mirror multiple ports to one port, functionality that may be useful when analyzing the communication between two or more devices on a single switch. However, let’s consider what can happen using some basic math. If you have a 24-port switch and you mirror 23 full-duplex 100Mbps ports to one port, you have potentially 4,600Mbps flowing to that port. This is well beyond the physical threshold of a single port, so you could cause packet loss or network slowdowns if the traffic reaches a certain level. This is sometimes referred to as oversubscription. In these situations, switches have been known to completely drop excess packets or even “pause” their internal circuitry, preventing communication altogether. Be sure that you don’t cause such problems when performing your capture.
Port mirroring may seem like an attractive, low-cost solution for enterprise networks and scenarios in which you need to consistently monitor specific network segments, such as in network security monitoring. However, this technique is usually not reliable enough for such an application. Especially at high throughput levels, port mirroring can provide inconsistent results and cause data loss that can be hard to track down. For such scenarios, you are advised to use a tap, discussed in “Using a Tap” on page 24.
Hubbing Out
Another way to capture the traffic through a target device on a switched network is by hubbing out. With this technique, you place the target device and your analyzer system on the same network segment by plugging them both directly into a hub. Many people think of hubbing out as “cheating,” but it’s really a valid solution when you can’t perform port mirroring but still have physical access to the switch the target device is plugged into.
To hub out, all you need is a hub and a few network cables. Once you have your hardware, connect it as follows:
Find the switch the target device resides on and unplug the target from the network.
Plug the target’s network cable into your hub.
Plug in another cable that connects your analyzer to the hub.
Plug in a network cable from your hub to the network switch to connect the hub to the network.
Now you have put the target device and your analyzer in the same broadcast domain, and all traffic from your target device will be broadcast so that the analyzer can capture those packets, as illustrated in Figure 2-6.
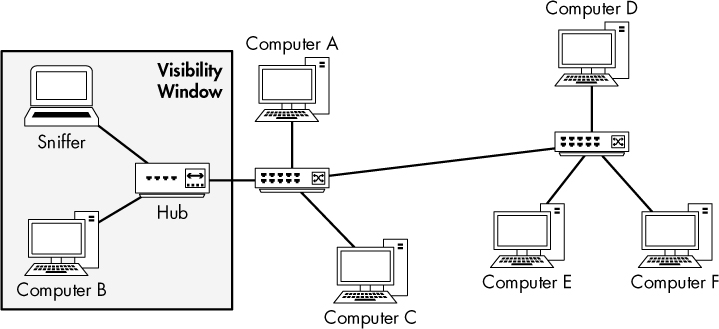
Figure 2-6: Hubbing out isolates your target device and analyzer.
In most situations, hubbing out reduces the duplex of the target device from full (bi-directional) to half (one-directional). While this method isn’t the cleanest way to capture packets, it’s sometimes your only option when a switch doesn’t support port mirroring. But keep in mind that your hub will also require a power connection, which can be difficult to find.
NOTE
As a reminder, it is usually a nice gesture to alert the user of the device that you will be unplugging it, especially if that user happens to be the company CEO!
Using a Tap
Everybody knows the expression “Why have chicken when you could have steak?” (Or, if you are from the South, “Why have liver loaf when you could have fried bologna?”) This choice also applies to hubbing out versus using a tap.
A network tap is a hardware device that you can place between two points on your cabling system to capture the packets between those two points. As with hubbing out, you place a piece of hardware on the network that allows you to capture the packets you need. The difference is that rather than using a hub, you use a specialized piece of hardware designed for network analysis.
There are two primary types of network taps: aggregated and nonaggregated. Both types of taps sit between two devices in order to sniff the communications. The primary difference between an aggregated tap and a nonaggregated tap is that the nonaggregated tap has four ports, as shown in Figure 2-7, and requires separate interfaces for monitoring traffic bidirectionally, while the aggregated tap has only three ports and can monitor bidirectionally with only a single interface.
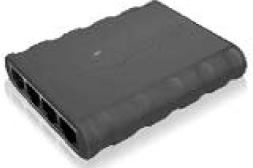
Figure 2-7: A Barracuda non-aggregated tap
Taps also typically require a power connection, although some include batteries that allow brief stints of packet sniffing.
Aggregated Taps
The aggregated tap is the simplest to use. It has only one physical monitor port for sniffing bidirectional traffic.
To capture all traffic to and from a single computer plugged into a switch using an aggregated tap, follow these steps:
Unplug the computer from the switch.
Plug one end of a network cable into the computer and plug the other end into the tap’s “in” port.
Plug one end of another network cable into the tap’s “out” port and plug the other end into the network switch.
Plug one end of a final cable into the tap’s “monitor” port and plug the other end into the computer that is acting as your sniffer.
The aggregated tap should be connected as shown in Figure 2-8. At this point, your sniffer should be capturing all traffic in and out of the computer you’ve plugged into the tap.
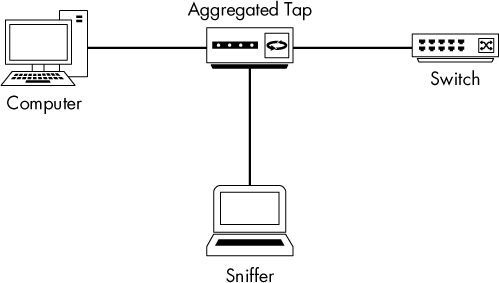
Figure 2-8: Using an aggregated tap to intercept network traffic
Nonaggregated Taps
The nonaggregated tap is slightly more complex than the aggregated type, but it allows a bit more flexibility when capturing traffic. Instead of having a single monitor port that can be used to listen to bidirectional communication, the nonaggregated type has two monitor ports. One monitor port is used for sniffing traffic in one direction (from the computer connected to the tap), and the other monitor port is used for sniffing traffic in the other direction (to the computer connected to the tap).
To capture all traffic to and from a single computer plugged into a switch, follow these steps:
Unplug the computer from the switch.
Plug one end of a network cable into the computer and plug the other end into the tap’s “in” port.
Plug one end of another network cable into the tap’s “out” port and plug the other end into the network switch.
Plug one end of a third network cable into the tap’s “monitor A” port and plug the other end into one NIC on the computer that is acting as your sniffer.
Plug one end of a final cable into the tap’s “monitor B” port and plug the other end into a second NIC on the computer that is acting as your sniffer.
The nonaggregated tap should be connected as shown in Figure 2-9.
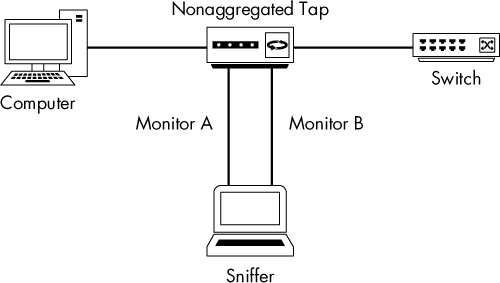
Figure 2-9: Using a nonaggregated tap to intercept network traffic
While these examples may make it appear as though you can monitor only a single device using a tap, you can actually monitor many devices by getting creative with your placement of the tap. For example, if you wanted to monitor all the communication between an entire network segment and the Internet, you could place the tap between the switch to which all of the other devices are connected and the network’s upstream router. This placement at a network choke point lets you collect the traffic you desire. This strategy is commonly used in security monitoring.
Choosing a Network Tap
Which type of tap is better? In most situations, aggregated taps are preferred because they require less cabling and don’t need two NICs on your sniffer computer. However, if you need to capture a high volume of traffic or care about traffic going in only one direction, a nonaggregated tap is a better choice.
You can purchase taps of all sizes, ranging from simple Ethernet taps that run about $150 to enterprise-grade fiber optic taps in the six-figure range. I’ve used enterprise-grade taps from Ixia (formerly Net Optics), Dualcomm, and Fluke Networks and have been very happy with them, but there are many other great taps available as well. If you’re using a tap for an enterprise application, you’ll want to be sure the tap has fail-open capability. This means that if the tap malfunctions or dies, packets will still pass through it and network connectivity for the tapped link won’t be interrupted.
ARP Cache Poisoning
One of my favorite techniques for tapping into the wire is ARP cache poisoning. We’ll cover the ARP protocol in detail in Chapter 7, but a brief explanation is necessary here so you can understand how this technique works.
The ARP Process
Recall from Chapter 1 that the two main types of packet addressing are at layers 2 and 3 of the OSI model. These layer 2 addresses, or MAC addresses, are used in conjunction with whichever layer 3 addressing system you are using. In this book, in accordance with industry-standard terminology, I refer to the layer 3 addressing system as the IP addressing system.
All devices on a network communicate with each other on layer 3 using IP addresses. Because switches operate on layer 2 of the OSI model, they are cognizant of only layer 2 MAC addresses, so devices must be able to include this information in packets they construct. When a MAC address is not known, it must be obtained using the known layer 3 IP addresses so traffic can be forwarded to the appropriate device. This translation process is done through the layer 2 protocol ARP.
The ARP process, for computers connected to Ethernet networks, begins when one computer wishes to communicate with another. The transmitting computer first checks its ARP cache to see whether it already has the MAC address associated with the IP address of the destination computer. If it does not, it sends an ARP request to the data link layer broadcast address ff:ff:ff:ff:ff:ff, as discussed in Chapter 1. This broadcast packet is received by every computer on that particular Ethernet segment. The packet basically asks, “Which IP address owns the xx:xx:xx:xx:xx:xx MAC address?”
Devices without the destination computer’s IP address simply discard this ARP request. The destination machine replies to the packet with its MAC address via an ARP reply. At this point, the original transmitting computer now has the data link layer addressing information it needs to communicate with the remote computer, and it stores that information in its ARP cache for fast retrieval.
How ARP Cache Poisoning Works
ARP cache poisoning, sometimes called ARP spoofing, is an advanced form of tapping into the wire on a switched network. It works by sending ARP messages to an Ethernet switch or router with fake MAC (layer 2) addresses in order to intercept the traffic of another computer. Figure 2-10 illustrates this setup.
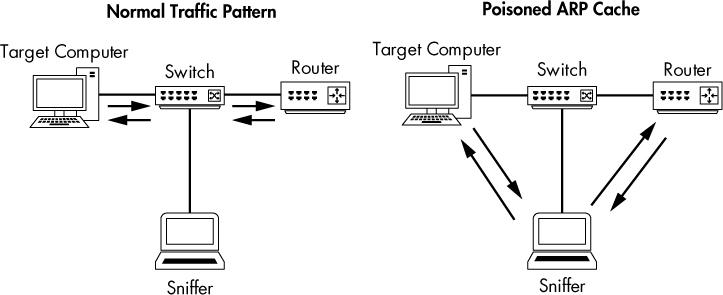
Figure 2-10: ARP cache poisoning lets you intercept the traffic of your target computer.
This technique is commonly used by attackers to send falsely addressed packets to client systems in order to intercept certain traffic or cause denial-of-service (DoS) attacks on a target. However, it can also be a legitimate way to capture the packets of a target machine on a switched network.
Using Cain & Abel
When attempting to poison the ARP cache, the first step is to acquire the necessary tools and collect some information. For our demonstration, we’ll use the popular security tool Cain & Abel from oxid.it (http://www.oxid.it/), which supports Windows systems. Download and install it now, according to the directions on the website.
NOTE
When you attempt to download Cain & Abel, there is a good chance that antivirus software or your browser will flag the software as malicious or as a “hacker tool.” This tool has multiple uses, including several that could be nefarious. For our purposes, it poses no threat to your system.
Before you can use Cain & Abel, you’ll need to collect certain information, including the IP address of your analyzer system, the remote system from which you wish to capture the traffic, and the router from which the remote system is downstream.
When you first open Cain & Abel, you’ll notice a series of tabs near the top of the window. (ARP cache poisoning is only one of Cain & Abel’s features.) For our purposes, we’ll be working in the Sniffer tab. When you click this tab, you should see an empty table, as shown in Figure 2-11.
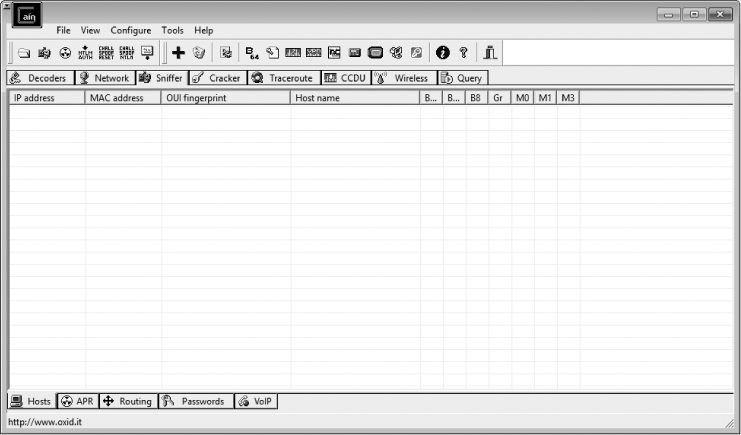
Figure 2-11: The Sniffer tab in the Cain & Abel main window
To complete this table, you’ll need to activate the program’s built-in sniffer and scan your network for hosts. To do so, follow these steps:
Click the second icon from the left on the toolbar, which resembles a NIC.
You’ll be asked to select the interface you wish to sniff. Choose the one that is connected to the network on which you’ll be performing your ARP cache poisoning. If this is your first time using Cain & Abel, select this interface and click OK. Otherwise, if you’ve selected an interface in Cain & Abel before, your selection will have been saved, and you’ll need to press the NIC icon a second time to select the interface. (Ensure that this button is depressed to activate Cain & Abel’s built-in sniffer.)
To build a list of available hosts on your network, click the plus (+) button. The MAC Address Scanner dialog appears, as shown in Figure 2-12. The All hosts in my subnet radio button should be selected (or you can specify an address range if necessary). Click OK to continue.
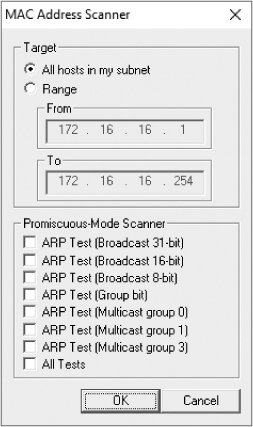
Figure 2-12: Scanning for MAC addresses using the Cain & Abel network discovery tool
Some Windows 10 users report Cain & Abel is unable to determine the IP address of their network interfaces, which prohibits the completion of this process. If you have this problem, when configuring network interfaces you’ll see that the IP address of your interfaces is 0.0.0.0. To remedy this, take the following steps:
If Cain & Abel is open, close it.
On the desktop search bar, type ncpa.cpl to open the Network Connections dialog.
Right-click the network interface you’ll be sniffing from and click Properties.
Double-click Internet Protocol Version 4 (TCP/IPv4).
Click the Advanced button and choose the DNS tab.
Select the checkbox next to Use this connection’s DNS suffix in DNS registration to activate it.
Click OK to exit the open dialogs and relaunch Cain & Abel.
The grid should now be filled with a list of all the hosts on your attached network, along with their MAC addresses, IP addresses, and vendor information. This is the list you’ll work from when setting up ARP cache poisoning.
At the bottom of the program window, you should see a set of tabs that will take you to other windows under the Sniffer heading. Now that you have built your host list, you’ll be working from the APR (for ARP Poison Routing) tab. Switch to the APR window now by clicking the tab.
Once in the APR window, you are presented with two empty tables. After you’ve completed the setup steps, the upper table will show the devices involved in your ARP cache poisoning, and the lower one will show all communication between your poisoned machines.
To set up your poisoning, follow these steps:
Click in the blank area in the upper portion of the screen. Then click the plus (+) button on the program’s standard toolbar.
The window that appears has two selection panes. On the left side, you’ll see a list of all available hosts on your network. If you click the IP address of the target computer, the pane on the right will show a list of all hosts in the network, except for the target machine’s IP address.
In the right pane, click the IP address of the router that is directly upstream from the target machine, as shown in Figure 2-13, and click OK. The IP addresses of both devices should now be listed in the upper table in the main application window.
To complete the process, click the yellow-and-black radiation symbol on the standard toolbar. This will activate Cain & Abel’s ARP cache poisoning features and allow your analyzing system to be the middleman for all communications between the target system and its upstream router.
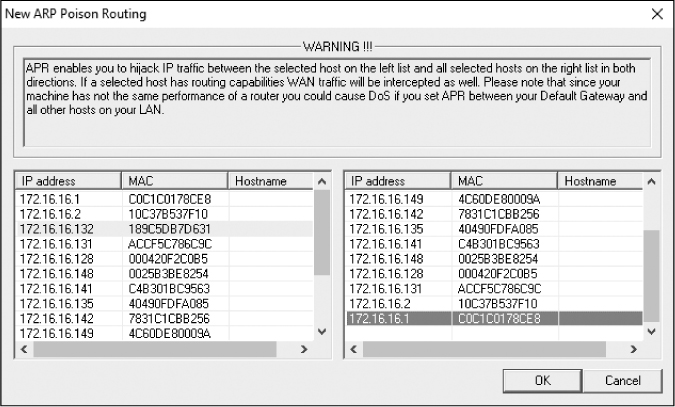
Figure 2-13: Selecting the devices for which you wish to enable ARP cache poisoning
You should now be able to fire up your packet sniffer and begin the analysis process. When you have finished capturing traffic, simply click the yellow-and-black radiation symbol again to stop ARP cache poisoning.
A Word of Caution About ARP Cache Poisoning
A final note on ARP cache poisoning: you should be very aware of the roles of the systems for which you implement this process. For instance, don’t use this technique when the target device is something with very high network utilization, such as a file server with a 1Gbps link to the network (especially if your analyzer system provides only a 100Mbps link).
When you reroute traffic using the technique shown in this example, all traffic transmitted and received by the target system must first go through your analyzer system, therefore making your analyzer the bottleneck in the communication process. This rerouting can have a DoS-type effect on the machine you are analyzing, resulting in degraded network performance and faulty analysis data. Traffic congestion can also prohibit SSL-based communication from working as expected.
NOTE
You can avoid having all the traffic go through your analyzer system by using a feature called asymmetric routing. For more information about this technique, see the oxid.it user manual (http://www.oxid.it/ca_um/topics/apr.htm).
Sniffing in a Routed Environment
All the techniques for tapping into the wire on a switched network are available on routed networks as well. The only major consideration when dealing with routed environments is the importance of sniffer placement when you are troubleshooting a problem that spans multiple network segments.
As you’ve learned, a device’s broadcast domain extends until it reaches a router, at which point the traffic is handed off to the next upstream router. When data must traverse multiple routers, it’s important to analyze the traffic on all sides of the router.
For example, consider the problem you might encounter in a network with several segments connected via multiple routers. In this network, each segment communicates with an upstream segment to store and retrieve data. In Figure 2-14, the problem we’re trying to solve is that a downstream subnet, network D, can’t communicate with any devices on network A.
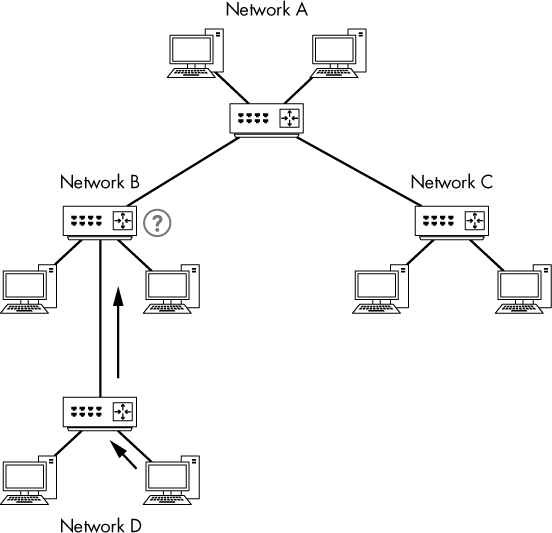
Figure 2-14: A computer on network D can’t communicate with computers on network A.
If you sniff the traffic of a device on network D that is having trouble communicating with devices on other networks, you may clearly see data being transmitted to another segment, but you might not see data coming back. If you rethink the positioning of your sniffer and begin sniffing the traffic in the next upstream network segment (network B), you’ll have a clearer picture of what is happening. At this point, you might find that traffic is dropped or routed incorrectly by network B’s router. Eventually, this leads you to a router configuration problem that, when corrected, solves your larger dilemma. Although this scenario is a bit broad, the moral of the story is that when dealing with multiple routers and network segments, you may need to move your sniffer around a bit to get the entire picture and pinpoint the problem.
Sniffer Placement in Practice
We have looked at four ways to capture network traffic in a switched environment. We can add one more if we simply consider installing a packet-sniffing application on a single device from which we want to capture traffic (the direct install method). Given these five methods, it can be a bit confusing to determine which one is the most appropriate. Table 2-2 provides some general guidelines for each method.
As analysts, we need to be as stealthy as possible. In a perfect world, we collect the data we need without leaving a footprint. Just as forensic investigators don’t want to contaminate a crime scene, we don’t want to contaminate our captured network traffic.
Table 2-2: Guidelines for Packet Sniffing in a Switched Environment
Technique |
Guidelines |
Port mirroring |
• Leaves no network footprint and generates no additional packets. • Can be configured without taking the client offline, which is convenient when mirroring router or server ports. • Requires processing resources from the switch and can be inconsistent at higher throughput levels. |
Hubbing out |
• Works when you are not concerned about taking the host temporarily offline. • Ineffective when you must capture traffic from multiple hosts, as collisions and dropped packets are likely. • Can result in lost packets on modern 100/1000Mbps hosts because most true hubs are only 10Mbps. |
Using a tap |
• Ideal when you are not concerned about taking the host temporarily offline. • The only option when you need to sniff traffic from a fiber-optic connection. • Preferred solution for enterprise packet capture and continuous monitoring because taps are reliable and can scale to high throughput links. • Since taps are made for the task at hand and are up to par with modern network speeds, this method is superior to hubbing out. • Can be expensive, especially at scale, and so may be cost prohibitive. |
ARP cache poisoning |
• Considered very sloppy, as it involves injecting packets onto the network to reroute traffic through your sniffer. • When port mirroring is not an option, can be effective for quickly capturing traffic from a device without taking it offline. • Requires great care so as to not impact network functionality. |
Direct install |
• Usually not recommended because if there is an issue with a host, that issue could cause packets to be dropped or manipulated in such a way that they are not represented accurately. • The NIC of the host doesn’t need to be in promiscuous mode. • Best for test environments, examining/baselining performance, and examining capture files created elsewhere. |
As we step through practical scenarios in later chapters, we’ll discuss the best ways to capture the data we require on a case-by-case basis. For the time being, the flowchart in Figure 2-15 should help you choose the best method for capturing traffic in a given situation. The chart takes different factors into consideration, starting with whether you are capturing packets at home or at work. Remember that this flowchart is simply a general reference and doesn’t cover every possible scenario in which you might tap into the wire.
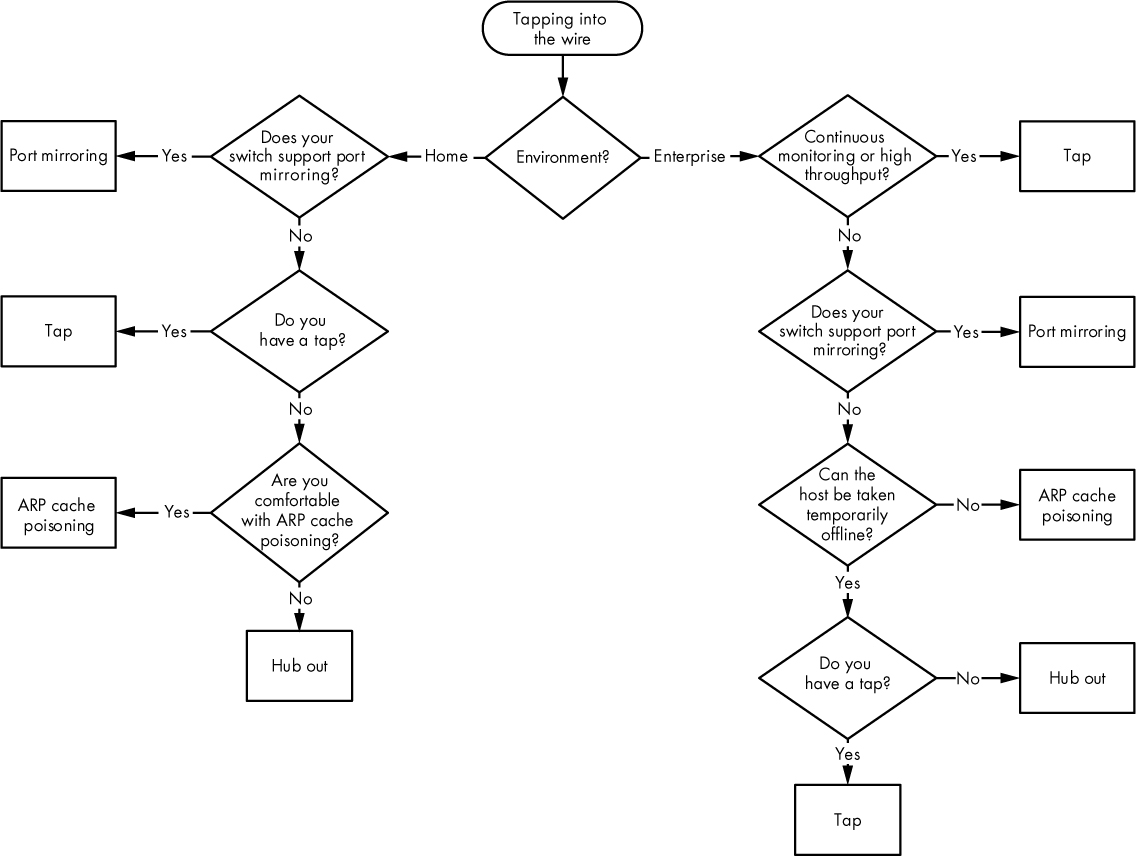
Figure 2-15: A diagram to help determine which method is best for tapping into the wire