CHAPTER 31
Performance-Tuning Your System
Compared to most machines, a computer requires virtually no maintenance. That's because it has fewer moving parts compared to other machines. And the new mobile and handheld devices that Windows 10 runs on have practically no moving parts. However, you can take some steps to keep your computer running at its optimum.
For example, the more the hard drive is used to store data, the more fragmented the data on the drive becomes. That doesn't pose any problems for reading the data, but it slows down the process. To speed it up again, you can defragment the drive. This topic, and others that will help you optimize your computer's performance, are covered in this chapter.
Getting to Know Your System
A computer system is made up of many components. The two main components that make up the actual “computer” are the CPU and RAM. The overall speed of your system is largely determined by the speed of your CPU and the amount of RAM in your system. The speed of a CPU is measured in gigahertz (GHz), billions of instructions per second.
The amount of RAM determines how much data the CPU can work with at any one time without accessing the much slower hard drive. RAM chips come in various speeds. But the amount of RAM you have, more so than its speed, determines the overall speed of your system. RAM is measured in megabytes (MB) or gigabytes (GB). A megabyte is roughly a million bytes. (A byte is the amount of memory required to store approximately a single character, such as the letter A.) A gigabyte (GB) is 1,024 megabytes. In short, the faster your CPU and the more RAM the computer has, the better its performance.
Knowing your CPU and RAM
To see the brand name and speed of your processor and the amount of RAM you have, right-click your This PC icon from File Explorer and choose Properties. The System Control Panel applet that opens shows the basic computer information, as well as information about the version of Windows you're using, as shown in Figure 31.1.

FIGURE 31.1 The System Control Panel applet.
Getting more detailed information about your PC
You can get more detailed information about all the components that make up your computer system from the System Information program. To open System Information, display the desktop and press Windows+X. Click Run, type msinfo32, and press Enter. The System Information window shown in Figure.31.2 opens.

FIGURE 31.2 The System Information program window.
The left column of the System Information window organizes your system information into expandable and collapsible categories. For example, clicking the plus sign next to the Components category expands that category to display subcategories and the names of specific device types. When you click a specific type, such as Drives under the Storage category, the pane on the right shows information about the components installed in your computer system.
You don't actually do any work in the System Information program. Its job is to present the facts about your computer's installed hardware and software. However, you can export a copy of the System Information data to a text file, which in turn you can open, format, or print using any word processing program or text editor. To export a copy of your system information to a file, just choose File ⇨ Export from System Information's menu bar.
You can also print your system information, either in whole or in part. To print all your system information, first click System Summary at the top of the left column. To print just a category, first click a category name, such as Components. Then choose File ⇨ Print from System Information's menu bar. In the Print dialog box that opens, choose All if you want to print everything, choose Selection to print just the text you may have selected, or choose Current Page to print the page you're viewing. To close System Information, click its Close (X) button or choose File ⇨ Exit.
Maximizing CPU and Memory Resources
Windows 10 takes care of managing the CPU and memory for you. Even so, you can do some things to improve performance as it relates to your system's memory and CPU. The following sections offer some tips.
Conserving memory
One of the best things you can do to improve your computer's performance is to ensure that it has plenty of memory. Initially, that means making sure the computer has a sufficient amount of physical memory installed. You should consider 2GB a minimum, although Windows can run with 1GB. If you use lots of programs at once, or use applications that require a lot of memory, consider using the 64-bit version of Windows and having at least 4GB of RAM in the computer, if not more.
Having lots of memory is part of the solution, but managing the memory you have is equally important. You can optimize your computer's RAM in these ways:
- Reduce the number of programs you run concurrently: If you aren't using a program, close it to reclaim the memory it's using. You can open it again later if you need it.
- Minimize the number of programs you install on your computer: Do you really need a program on the tray that tells you what the weather is like outside? All the little add-on programs you install and run on your computer, even if they're running in the background, consume resources. The fewer programs, the better.
Reducing the number of programs running at one time not only improves performance by freeing up memory, but also reduces the load on the CPU, making processing cycles available to those programs that do need to be running.
Managing virtual memory
In the very early days of DOS, a computer could run only one program at a time. Programs had to be written to fit in the available (and minimal) memory in the computer. In Windows 10, you can run almost as many programs as you want at one time as a result of the design of today's CPUs and of the OS itself. The capability to manage memory effectively for all those programs is due, in part, to the use of virtual memory.
Modern computers can use two types of memory. The first type is physical memory (RAM), which consists of physical memory chips on memory modules (small circuit boards) that plug into the computer's motherboard.
The second type of memory is virtual memory, and Windows 10 uses the computer's hard drive for that, using a file on the drive as a place to store data as an alternative to physical memory. The area on the hard drive that's used as virtual memory is called a paging file because data is swapped back and forth between physical and virtual memory in small chunks called pages. When you fill up both your physical memory and virtual memory, the computer doesn't just stop and display an error. Instead, it displays a message in advance, warning that the computer is running low on virtual memory and suggesting that you make room for more.
Because the virtual memory is just a paging file on the hard drive, you can easily add more just by increasing the size of the paging file. You don't have to buy or install anything. This is unlike physical memory in that the only way to increase physical memory is to buy and install more RAM. One downside to virtual memory is that it's much slower than physical memory because hard drives are slower than RAM chips.
To manage virtual memory in Windows 10, open the System applet from the Control Panel and click the Advanced System Settings link on the System applet. The link appears on the left of this page, as shown in the left side of Figure 31.3. In the resulting System Properties dialog box, click the Advanced tab, and then click the Settings button in the Performance group. Then select the Advanced tab in the resulting Performance Options dialog box (see the left side of Figure 31.4). The Virtual Memory area on this dialog box shows the total paging file size for all drives. To adjust the settings, click the Change button to open the Virtual Memory dialog box shown in the right side of Figure 31.4.

FIGURE 31.3 The Advanced System Settings link (left); the Advanced tab of the System Properties dialog box (right).

FIGURE 31.4 The Advanced tab of the Performance Options dialog box (left); the Virtual Memory dialog box (right).
In most cases, you can simply select the top check box, Automatically Manage Paging File Size for All Drives, to allow Windows to adjust the page file.
If you don't want Windows to manage the page file for you, your main options in the Paging File Size for Each Drive area of the Virtual Memory dialog box are as follows:
- Custom Size: You choose where you want to put your paging file(s), their initial size, and maximum size.
- System Managed Size: Tells Windows to create and size the paging file automatically for you.
- No Paging File: Eliminates the paging file from a drive. Not recommended unless you're moving the paging file from one drive to another.
If you have multiple hard drives, you can get the best performance by using the least busy drive for virtual memory. For example, if you have a D: drive on which you store documents, it may be better to use that, rather than the C: drive, because the C: drive is pretty busy with Windows and your installed programs.
If you have multiple physical drives, you can get a little performance boost by splitting the paging file across the two drives. A single drive that's partitioned into two or more partitions, to look like multiple drives, doesn't count. Don't divide the paging file across multiple partitions on a single drive because that has the reverse effect and slows operations down.
If you opt for a custom size, you can work with any one hard drive at a time. The drives are listed by letter and labeled at the top of the dialog box. In the example shown, all the partitions reside on a single drive.
If you don't select the check box at the top of the Virtual Memory dialog box, you need to set the paging file sizes individually. For example, to move the paging from drive C: to D:, first click drive C: at the top of the dialog box, choose No Paging File, and then click the Set button. Then click drive D:, choose Custom Size, set the sizes, and click Set.
The Total Paging File Size for All Drives section at the bottom of the dialog box shows the minimum allowable size, a recommended size, and the currently allocated size (the last measurement being the sum of all the Initial Size settings). The recommended size is usually about 1.5 times the amount of physical memory. The objective is to prevent you from loading up way more stuff than you have physical RAM to handle, which would definitely make your computer run more slowly.
If your computer keeps showing messages about running out of virtual memory, you definitely should increase the initial and maximum size of the paging file. A gigabyte (1,024MB) is a nice round number. But if the computer runs slowly after you increase the amount of virtual memory, the best solution is to add more physical RAM.
If you change the Virtual Memory settings and click OK, you're asked if you want to restart your computer. If you have programs or documents open, choose No and close everything first. But because the paging file is created when you only start your computer, you eventually need to restart the computer to take advantage of your new settings.
Priorities, foreground, and background
Your computer's CPU and RAM are very busy places, with potentially thousands of tasks occurring at one time. To try to optimize performance, Windows prioritizes those tasks. Your application programs typically run in the foreground, which means that when you click an item with your mouse or do something at the keyboard, fulfilling that request gets top priority in terms of being sent to the CPU for execution.
Most processes, by comparison, run in the background. This means that they get a lower priority and have to momentarily step aside when you tell Windows or an application to do something. For example, printing a document is treated as a low-priority background process, and for good reason. Printers are slow mechanical devices. So, by making printing a low-priority process, you can continue to use your computer at near normal speeds while the printer is slowly churning out its printed pages.
Controlling CPU priorities
By default, programs that you're using are given a higher priority than background processes. You can reverse that order by giving processes a higher priority than applications. If you have an intensive background task running, you can give it a higher priority. Or if you want to make sure that your applications are getting top priority, as they should be, follow these steps:
- Open the System window for your system.
- Click the Advanced System Settings link on the left side of the screen to bring up the System Properties dialog box. Select the Advanced tab in the System Properties dialog box.
- Under the Performance heading, click the Settings button. The Performance Options dialog box opens.
- In the Performance Options dialog box, select the Advanced tab (refer to Figure 31.3).
The Processor Scheduling options determine whether your actions, or processes, get top priority when vying for CPU resources to do their jobs. If you choose Background Services, your computer may not be as responsive as you'd like, but background tasks get higher priority. So, for example, if you're running a scan of your system in the background and you want it to finish faster, select Background Services in the Performance Options dialog box and click OK.
Monitoring and Adjusting Performance
Windows 10 includes a great selection of tools to help you monitor and tune your system's performance. You've already seen a couple of them, notably the Performance Monitor. The following sections explore this tool in more detail, along with several others that will help you keep your system running at its best.
Performance Monitor
Performance Monitor, included in Windows 10, has also been available in previous versions of Windows. It provides an interface for viewing performance counters on your system. To open Performance Monitor, press Windows+X. Click Run, type perfmon, and press Enter, or type perf in the Cortana search. The Performance Monitor window shown in Figure 31.5 opens.

FIGURE 31.5 Performance Monitor.
When Performance Monitor opens, the Performance branch in the left pane is selected and the Performance Monitor window displays general information about the program, a system summary, and some links to learn more about using Performance Monitor. Although the System Summary area shows current performance data, you'll probably prefer to see a visual representation. To do so, click Performance Monitor under the Monitoring Tools branch in the left pane. Figure 31.6 shows an example.

FIGURE 31.6 Performance graphs in Performance Monitor.
The line crossing the screen as you watch the Performance Monitor plots your system's CPU activity. The graph has a timeline along the bottom and a percentage on the side. Tracking only the CPU doesn't provide much more information than what Task Manager provides. By adding counters to the grid, you can track your system's performance. To add more counters to the graph, follow these steps:
- Start by clicking the plus sign in the toolbar located just above the graph.
- The Add Counters dialog box, shown in Figure 31.7, shows all the available performance objects for your system. In the left column, click the arrow to the right of the performance objects to expand and display the available counters for that object. We've selected Network Interface in Figure 31.7.
- Depending on the counter you select, you may also have the option of selecting an instance of that counter. In the case of the Network Interface object, depending on your computer system, you may have multiple network interfaces, as shown in the Instances of Selected Object list box. This figure shows the Bytes Total/Sec selected as the counter and the wireless adapter for the instance.
- Optionally, you can select the Show Description check box so you can view additional information about the counter.
- Click the Add button to move the selection over to the Added Counters section of the window.
- When you've selected all the counters you want to monitor, click OK to return to the graph.
- As shown in Figure 31.8, the counter is added to the bottom of the window. If you select the counter in the list and click the highlighter icon in the toolbar, it highlights that specific counter. In this case, it has changed the color to a bold black. This is very helpful when you have several counters on the screen at the same time. When the highlighter is turned on, clicking any counter in the list causes that counter to be highlighted.

FIGURE 31.7 The Add Counters dialog box.
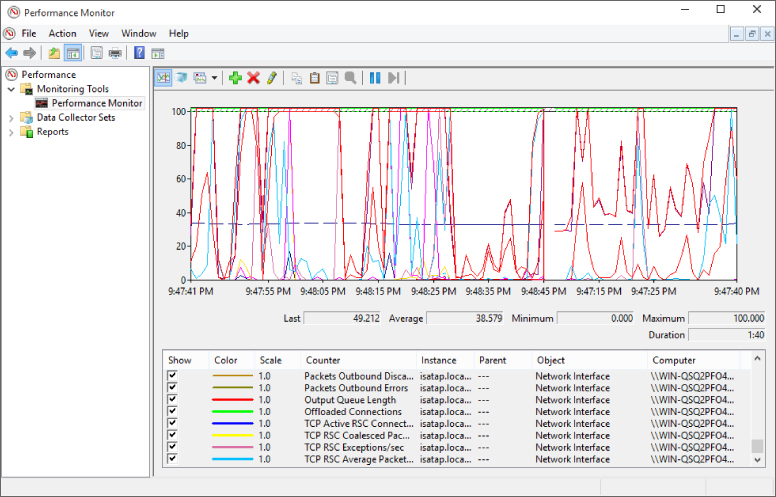
FIGURE 31.8 Network Interface object added to Performance Monitor.
The scale of the graph is set automatically. In the case of the previous example, if the network utilization went off the screen, you'd be able to adjust the scale for that specific counter so you'd have more meaningful information instead of a line running off the top of the graph.
Data collector sets and reports
The Performance Monitor interface provides a mechanism to log the information and events that occur on your system. Besides just logging the information, it also provides a way for you to use reports to look at the information.
In the previous section, you learned about performance counters in Performance Monitor through the use of one example, Bytes Total/Sec. A data collector set, as its name implies, is a set of objects that collect data about your computer. So, you might create a data collector set that gathers data about specific items. For example, you could create a data collector set to gather information about network performance through the use of a variety of network counters. Or you might create one to analyze drive performance by using multiple drive counters.
Within the Performance Monitor interface, you can create user-defined data collector sets, but let's start with the predefined data collector sets. To get started, follow these steps:
- Click the arrow to the left of Data Collector Sets to expand the tree beneath it. Then expand the System icon beneath Data Collector Sets and click System Performance.
- Right-click System Performance and choose Start, or click the Start button in the toolbar. The system starts collecting data for the different components of the collector.
- Let the system run for a while, and when you're ready, right-click System Performance again and choose Stop this time, or click the Stop button in the toolbar. Stopping the collector may take a few seconds.
- Navigate to the Reports section within Performance Monitor and expand the System branch, as shown in Figure 31.9. In this figure, two performance reports are listed.
- Expand or collapse different areas by clicking the arrows next to each group. Use the vertical scroll bar to see all the different report categories.

FIGURE 31.9 System Performance reports.
Generating system performance reports in Performance Monitor can help you understand where bottlenecks might exist in your system. For example, you can quickly identify an overtaxed CPU, problems with network saturation, or other issues.
In addition to creating performance reports with Performance Monitor, you can also create diagnostic reports. In the left pane, under Data Collector Sets, expand System and click System Diagnostics. Then click Start in the toolbar. Wait as Performance Monitor creates the report. While the report data is being gathered, the icon next to the System Diagnostics branch shows a small green arrow. This is replaced by an hourglass while Performance Monitor generates the report. When the icon returns to normal, the report is finished. You'll find a new report under the Reports ⇨ System ⇨ System Diagnostics branch in the left pane. Click the report to view its contents. Figure 31.10 shows an example of a diagnostics report.

FIGURE 31.10 A diagnostics report.
As with a performance report, expand and collapse any categories in the report to view the information in the report. The information in the report can help you pinpoint hardware errors and other problems.
Creating data collector sets
You can create your own user-defined data collector sets, which involves adding data from one of the four categories. From the properties window of the collector, you can set a variety of properties for each type, such as the sample interval maximum number of samples, Registry keys to monitor, and many more.
You can add the following four types of data collectors to your custom data collector sets:
- Performance Counter Data: This information is the same information that you can gather from Performance Monitor, discussed earlier in the chapter.
- Event Trace data: This data is gathered when system events occur on your system.
- Configuration data: This data is gathered from changes to your system's Registry.
- Performance Counter Alert: This data is gathered when a performance counter you specify reaches a point either above or below a value that you define.
As explained previously, creating data collector sets assumes a certain level of technical capability and knowledge about how the computer and its components function. Those topics are far outside the scope of this book. So, instead, we focus on the mechanics of creating the data collector set:
- Open Performance Monitor and expand the Data Collector Sets branch.
- Right-click User Defined and choose New ⇨ Data Collector Set to start the Create New Data Collector Set Wizard (see Figure 31.11).
- Enter a descriptive name in the Name text box.
-
Decide whether to create the data collector set from a template or from scratch (manually). If you choose the Create from a Template option, you can add data
collectors to the ones already in the template. Click Next.
- If you opted to start from a template, the wizard next prompts you to choose a template. Select one and click Next. Otherwise, the wizard prompts you to choose a type of data collector to add. In this example, let's assume you choose to start from a template, so choose Basic from the offered templates and then click Next.
- Specify the directory where you want the data to be saved and click Next.
- In the final page of the wizard, click Finish.

FIGURE 31.11 Create New Data Collector Set Wizard.
The new data collector set should now appear under the User Defined branch in the left pane. Let's assume that you now want to add some additional data collectors to the set. Right-click in the right pane (or on the new data collector set's name in the left pane) and choose New ⇨ Data Collector.
Performance Monitor opens the Create New Data Collector Wizard (see Figure 31.12). Specify a name for the collector and choose one of the four collector types, as described previously in this section. For example, to add a performance counter, choose Performance Counter Data Collector. Then click Next.

FIGURE 31.12 The Create New Data Collector Wizard.
Depending on the type of collector you choose, the wizard prompts you for information about the collector. Specify the information needed to configure the collector to obtain the data you're looking for, and then click Finish.
After you create the data collector set, you can use it just as you can the predefined ones in the System branch.
Resource Monitor
Another handy tool for monitoring system performance is Resource Monitor, which collects and displays real-time information about the CPU, disk, network, and memory. To open Resource Monitor, select the root node in Performance Monitor and then click the Open Resource Monitor link. You can also open Resource Monitor by running resmon from the Cortana search as described for running perfmon (see “Performance Monitor,” earlier in this chapter). Figure 31.13 shows Resource Monitor.

FIGURE 31.13 Resource Monitor.
The Overview tab, shown in Figure.31.14, offers summary information about each of the four categories. To view activity for a particular process, select the check box next to the process's image name in the CPU list. Then click the category header for a category to view the data filtered by the selected process. For example, Figure 31.14 shows network activity filtered for Dropbox.

FIGURE 31.14 Network activity filtered for Dropbox.
Each of the other tabs in Resource Monitor provides data specific to the specified category. For example, to see detailed information about memory utilization, select the Memory tab. The top area of each tab shows the running processes. You can filter by one or more processes by selecting them from the list. Deselect the Image check box to clear the filter.
Reliability Monitor
Reliability Monitor provides information regarding your system's overall stability. It tracks data and generates a report similar to the one shown in Figure 31.15, which indicates a relative reliability index from 1 to 10. Reliability Monitor uses five groups of information to determine the index, including application failures, Windows failures, miscellaneous failures, warnings, and informational events. To open Reliability Monitor, open Control Panel and search for Reliability. Then click the Reliability Monitor Report.

FIGURE 31.15 Reliability Monitor report of overall system stability.
The icons on the chart in Reliability Monitor indicate the type of event that occurred on the specified date. The letter i inside a blue circle is an informational event, such as an update being applied successfully to the system. A yellow triangle with an exclamation point inside indicates a warning — for example, a warning that a driver did not install successfully. Failures are indicated by a white X inside a red circle. Examples include an application hanging or Windows shutting down unexpectedly.
You can view the events for a particular day by clicking that day in the chart. Details for that day appear in the bottom Details pane. When viewing the graph in Weeks view, clicking a week in the graph shows all items for that week in the Details pane. Whichever view you use, double-clicking an item in the Details pane displays full information about the event. For example, Figure 31.16 shows the results of double-clicking an event related to an application hang event.

FIGURE 31.16 Details for an event in Reliability Monitor.
Reliability Monitor is a great tool for keeping track of the events that have occurred with your computer over a long period of time. It can be particularly useful in identifying repetitive problems or problems with specific items.
Using Windows ReadyBoost
Historically, PCs had two ways to store data: memory and the hard drive. Memory (RAM) is very fast. But it's volatile, meaning everything in it gets erased the moment you shut down the computer. The hard drive isn't nearly as fast. But it has persistence, meaning that it retains information even when the computer is turned off.
RAM is also more expensive than hard drive storage. For example, a typical desktop computer might have 2GB of RAM. The hard drive, on the other hand, most likely holds hundreds or even thousands of gigabytes (called terabytes) of data.
Windows 10 automatically uses the paging file (discussed earlier in this chapter) to store the data and conserve RAM.
The downside to using the paging file is that the processor can't move data to and from it as quickly as it can with RAM. The paging file becomes a little performance bottleneck. Prior to Windows Vista, no solution to this problem existed. Windows Vista introduced a solution called ReadyBoost that lets Windows 10 use flash memory for the paging file. For paging file operations, flash memory is about ten times faster than a hard drive, which means ReadyBoost can get rid of many little, short delays and offer a faster, smoother overall computing experience. Windows 7 through Windows 10 support ReadyBoost.
You have three ways to get ReadyBoost capabilities in your system:
- Use a hybrid hard drive, which puts NAND flash memory right on the drive.
- Have ReadyBoost capability on the computer's motherboard.
- Use a USB flash drive (a small device, usually small enough to fit on a keychain, which you just plug into a USB 2.0 or 3.0 port on your computer) for ReadyBoost.
Not all flash drives are ReadyBoost-capable. They vary greatly in their capacity and speed. Windows 10 uses a flash drive for ReadyBoost only. An 8GB flash drive with fast random I/O capability is a good choice for ReadyBoost.
If you already have a USB flash drive and want to see if it's ReadyBoost-capable, plug the drive into a USB slot. After Windows 10 recognizes and analyzes the drive, you get some feedback on the screen letting you know that you can speed up your system by utilizing the available space on your device.
Some systems, such as newer laptops that use solid-state hard drives, are fast enough that ReadyBoost doesn't provide any serious performance gains. Figure 31.17 shows an example of the ReadyBoost properties tab for a USB 2.0 flash drive. Notice that using ReadyBoost would not provide additional performance benefit to laptops or handheld devices. Right-click the USB device in File Explorer and select properties. The ReadyBoost tab as shown in Figure 31.17 lets you know if the USB drive selected can be used for ReadyBoost.

FIGURE 31.17 Windows lets you know if the USB flash drive would not benefit from ReadyBoost.
If you want to use the device as virtual memory, select the Speed Up My System option. After you've selected that option, the properties for the removable disk pop up. You can also bring up that dialog box by opening your Computer folder, right-clicking the drive's icon, and choosing Properties.
Select the Use This Device option, and then you can set the amount of space for ReadyBoost. By default, Windows sets the value to the recommended amount and lets you know that the space you allocate won't be available for general use. When you've set the value, click OK.
ReadyBoost copies as much of the information as possible from virtual memory to the USB thumb drive. A copy of all the information remains within virtual memory, but the system now knows to look at the ReadyBoost device first. If the system can't find the information there, it looks to the real virtual memory located on your hard drive. By keeping the original copy on your hard drive, you can remove your USB thumb drive without disrupting the computer.
Don't expect to see your computer suddenly run faster with ReadyBoost. Its benefits may not be immediate. Remember: The main purpose of ReadyBoost is to eliminate the short delays you may experience when loading certain programs, switching among open programs, and performing other activities that usually involve a paging file. With time, you should experience quicker response times in those areas. You may even find your computer starts more quickly because programs load more quickly at startup.
Trading pretty for performance
All the visual effects you see on your screen while using Windows come with a price. It takes CPU resources to show drop-shadows beneath 3D objects, make objects fade into and out of view, and so forth. On an old system that has minimal CPU capabilities and memory, those little visual extras can bog down the system.
To change settings that control visual effects, open Control Panel, select the System link, and then select Advanced system settings. The System Properties dialog box loads. Select the Advanced tab and then click the Performance Options Settings button. The Performance Options dialog box shown in Figure 31.18 loads.

FIGURE 31.18 The Visual Effects tab of the Performance Options dialog box.
The Visual Effects tab of the Performance Options dialog box lets you choose how much performance you're willing to part with for a “pretty” interface. As shown in Figure 31.18, the Visual Effects tab gives you four main options:
- Let Windows Choose What's Best for My Computer: Use this option to enable Windows to automatically choose visual effects based on the capabilities of your computer.
- Adjust for Best Appearance: If selected, all visual effects are used, even at the cost of slowing down performance.
- Adjust for Best Performance: This option minimizes visual effects to preserve overall speed and responsiveness.
- Custom: With this option, you can pick and choose any or all of the visual effects listed beneath the Custom option.
How you choose options is entirely up to you. If you have a powerful system, the visual effects don't affect performance very much, if at all. So, you don't need to turn off the visual effects. But if your computer isn't immediately responsive to operations that involve opening and closing menus, dragging, and other things you do on the screen, eliminating some visual effects should help make your computer more responsive.
Maintaining Your Hard Drive
The CPU and RAM are the most important factors for system performance, but your hard drive plays an important role in determining the overall speed of your computer. That's because the hard drive comes into play when you open programs or documents, when you save documents, or when you move and copy files. By moving less-used applications to your hard drive from RAM, the hard drive also comes into play when you're running low on RAM. So, keeping the hard drive running as near to peak performance as possible has a positive impact on system performance.
Recovering wasted hard drive space
At any time, some of the space on your hard drive is being eaten up by temporary files. As the name implies, temporary files are not like the programs you install or documents you save. Programs, apps, and documents are “forever,” in the sense that Windows never deletes them at random. The only time a program is deleted, for example, is when you use Programs in the Control Panel to remove the program. Likewise, documents aren't deleted unless you intentionally delete them and also empty the Recycle Bin. And Windows 10 apps aren't deleted unless you remove them from the Windows 10 interface.
In contrast, the files in your Internet cache, also called your Temporary Internet Files folder, are temporary files. Every time you visit a web page, all the text and pictures that make up that page are stored in your Internet cache. When you use the Back or Forward button to revisit a page you've viewed recently, your browser pulls a copy of the page out of the Internet cache. That saves lots of time when compared to how long it would take to redownload a page each time you click the Back or Forward button to revisit a recently viewed page.
To recover some wasted disk space, click the Disk Cleanup button on the properties sheet for the hard drive. Open the This PC folder, right-click a drive, and choose Properties. In the Properties dialog box, click the Disk Cleanup button on the General tab. Disk Cleanup then analyzes the drive for expendable files. When the analysis is complete, you see the Disk Cleanup dialog box shown in Figure 31.19. The Files to Delete list shows categories of temporary files. When you click a category name, the Description below the names explains the types of files in that category. All the categories represent temporary files that you definitely can safely delete. Important programs or documents you saved on your own never appear in the list of temporary files.

FIGURE 31.19 The Disk Cleanup dialog box.
The number to the right of each category name indicates how much drive space the files in that category are using and how much space you'll gain if you delete them. Choose which categories of files you want to delete by selecting (checking) their check boxes. If you don't want to delete a category of files, clear the check mark for that category. The amount of drive space you'll recover by deleting all the selected categories appears under the list. After you've selected the categories of files you want to delete, click OK. The files are deleted and the dialog box closes.
Deleting system restore files and unwanted features
If you click the Clean Up System Files button in Disk Cleanup, a More Options tab appears on the Disk Cleanup dialog box. Clicking that tab provides two more options for freeing up drive space:
- Programs and Features: Takes you to the Programs and Features window, where you can uninstall programs and Windows Features you don't use.
- System Restore and Shadow Copies: Deletes all restore points except the most recent one. This can be significant because system protection files are allowed to consume up to 15 percent of your available drive space.
Defragmenting and optimizing your hard drive
When a drive is newly formatted, most of the free space on the drive is available in a contiguous chunk. This means the disk clusters (the smallest amount of storage space that can be allocated) are side-by-side in contiguous fashion. As Windows writes a file, it can do so in contiguous clusters, writing the entire file in one pass. When it reads the file back, it can also do so in one pass, making drive performance as good as possible.
However, the more a drive is used, the more fragmented the data becomes. Instead of writing data contiguously, Windows writes it here and there on the drive, splitting up the file into fragments (thus, the term fragmentation).
When that happens, the drive heads move around quite a bit to read and write files. You may even be able to hear the drive chattering when files get seriously fragmented across the drive. This movement puts extra stress on the mechanics of the drive and also slows it down a bit.
To get your drive running more smoothly, you can defragment (or defrag for short) the drive. When you do, Windows takes most of the files that are split up into little chunks and brings the pieces together to make each file contiguous again. It also moves most files to the beginning of the drive, where they're easiest to get to. The result is a drive that's no longer fragmented, doesn't chatter as much, and runs faster.
You don't need to defragment your drive too frequently; four or five times a year is probably sufficient. The process can take a few minutes or up to several hours, so consider running it overnight. However, note that Windows 10 automatically defragments the drive. You can view the current schedule, if any, in the Disk Defragmenter program.
To defragment a hard drive, follow these steps, starting at the desktop:
- Open the This PC folder in File Explorer.
- Right-click the icon for your hard drive (
C:), and choose Properties. - In the Properties dialog box that opens, select the Tools tab.
- Click the Optimize button. The Optimize Drives program opens, as shown in Figure 31.20.
- In the Optimize Drives dialog box, you can set up a schedule to run the optimizer. Click Change Settings to establish that schedule. You also can click the Analyze button to get the current status of the drive and to see if an optimization process (defragmentation) would be beneficial. The program starts analyzing your drive and may take as little as a few minutes or as much as a few hours.
- When the defragmentation is complete, the Current Status column shows an OK (0% Fragmented) message for the drive you optimized.

FIGURE 31.20 The Optimize Drives applet.
When you optimize the drive, the Disk Defragmenter tool defragments all the fragmented files and moves some frequently used files to the beginning of the drive, where they can be accessed in the least time with the least effort. Some files aren't moved. That's normal. If Windows decides to leave them where they are, it has a good reason.
You may hear lots of drive chatter as Disk Defragmenter is working. That's because the drive heads are moving files around to get them into a better position for defragmentation.
When Disk Defragmenter is finished, close any open dialog boxes and the Disk Defragmenter program window.
The Power Settings
The power settings under Power Options in the Control Panel provide features that enable you to adjust the performance of your system while conserving energy. To get to the power options for your system, open the Control Panel. If the Control Panel opens in Category view, click the System and Security link. Then click the Power Options icon. The Power Options applet opens, as shown in Figure 31.21. Click the down arrow beside Show Additional Plans to show the High performance plan.

FIGURE 31.21 The options for power settings for a powerful computer.
The Power Options applet provides the basic configuration for the power options on your system. The three plans listed — Balanced, Power Saver, and High Performance — are the default power plans for the system. You can alter the settings for the three default plans by either clicking the Change Plan Settings link beside the plan or, for the selected plan, clicking either Choose When to Turn Off the Display or Change When the Computer Sleeps from the left column. Clicking any of these links brings up the Edit Plan Settings dialog box shown in Figure 31.22.

FIGURE 31.22 The basic options for setting the power conservation features of Windows 10 running on a powerful computer.
Adjusting either of these options alters the default plan you've selected. Clicking the Change Advanced Power Settings link brings up the Power Options dialog box, which includes the Advanced Settings tab shown in Figure 31.23.

FIGURE 31.23 The Advanced Settings tab.
With these options, you can drill down on individual options at a more advanced level. If you change something that you think you shouldn't have, you can click the Restore Default Settings for This Plan link to get back to where you were. Note that notebook computers have additional power options not typically available on desktops.
Create a power plan
If none of the default options meets your needs and you'd like to build your own power plan, click the third link on the left side of the Power Options applet, Create a power plan. Clicking this link brings up the window shown in Figure 31.24.

FIGURE 31.24 The first step to creating your own power plan.
To make it easier, Windows lets you create your power plan from one of the three defaults. You also can name the plan on this page. After you've set the name of your plan, click Next. The next window allows you to set when you want to turn off the display and when you want to put the computer to sleep.
After you've configured these last two options, click the Create button. When you're back at the Power Options applet, your plan should be first on the list and selected. If you want to change some of the advanced options in your plans, click the Change Plan Settings link and then click Change Advanced Power Settings, as mentioned earlier in the chapter.
System settings
Choosing What the Power Button Does located at the left of the Power plan applet takes you to the System Settings page shown in Figure 31.25.

FIGURE 31.25 Options for power buttons and password protection on a powerful computer.
With older computers, when you pressed the power button, the system would power off. With current computers, the power buttons take on a different role. Under the first heading in this window, Power Button Settings, you determine what happens when the power button is pushed. You're given two options:
- Do Nothing: Nothing happens when you press the power button.
- Sleep: If you select this option, the data you're working on is stored in memory and to the hard drive. The system runs using very little power until you press a key on the keyboard or move the mouse. On a notebook computer, when Windows notices that the system is running low on battery power, Windows starts writing the information to the hard drive. Upon restarting, the system moves all the information from the hard drive to memory, just as the system was left originally. Usually, bringing the computer back from Sleep takes two to three seconds. Sleep mode is not limited to notebooks. Most newer desktop computers also support it.
- Hibernate: The computer shuts down but saves data to a disk in order to resume where it left off when you power back up.
- Shut Down: This selection shuts down the computer without saving any of the data you have in memory. Windows prompts you to save your work before you shut down. This method does a gradual shutdown of Windows.
- Turn off the display: This selection is mainly for laptops and handhelds. The display is turned off to conserve power.
After you've decided which option you want, click the Save Changes button.
On the System Settings window, you also can set the password option for what happens when the computer wakes up. As indicated by the text next to each of the options, when your system wakes from Sleep, the user may be prompted for a password. Obviously, the more secure option is to use a password. However, if this is your home system and you're the only one with physical access to the system, the second option is good enough.
With all the power options available in Windows 10, you should be able to conserve resources on your system while still making your system very responsive. The power options probably benefit portable users more than desktop users.
Wrapping Up
The components of your computer system that most affect performance are its CPU and memory, but hard drive performance also affects overall system performance. (Internet access speed is determined primarily by the bandwidth of your Internet connection but can also be affected by slow system performance.) As an alternative to buying a faster computer, you can do some things to make your current computer run faster and keep it running at top speed. The main points in this chapter are as follows:
- The System Information program provides detailed information about all the components that make up your computer system.
- To ensure that your computer is responsive to your every mouse click and keyboard tap, Windows automatically prioritizes programs as foreground (high-priority) and background (low-priority) tasks.
- Windows automatically uses a portion of the hard drive as virtual memory to handle the overflow.
- ReadyBoost uses flash memory to store frequently accessed disk files to provide a faster, more fluid computing experience.
- If your computer is usually sluggish and unresponsive, consider turning off some of Windows 10's visual effects.
- The speed of your hard drive determines how long it takes to open and save files.
- To keep your hard drive running at top speed, consider deleting temporary files, scanning for and fixing bad sectors, and defragmenting the drive four or five times a year depending on how much time you spend at the computer.
- Power settings play a role in your system's overall performance and can also be adjusted to conserve power, especially when using a laptop.