
CHAPTER 12
Case Studies
12.1 Spare Supply System for Worldwide Telecommunication System Globalstar
The software tool Optimal Spare Allocator (OSA) has been designed at QUALCOMM (San Diego, California) by the International Group on Reliability (IGOR). The International Group on Reliability includes Igor Ushakov (the lead), Dr. Sergei Antonov, Dr. Mikhail Konovalov, Dr. Sergei Shibanov, Dr. Sergei Shorgin, and Dr. Igor Sokolov (all from the Russian Academy of Sciences). OSA has been developed for a spare supply system of the worldwide low orbit satellite telecommunication system Globalstar. The OSA computer model allows for solving direct and inverse problems of optimal redundancy for hierarchical structure of spare stocks. It has a user-friendly interface and a convenient reporting utility.
12.1.1 General Description of the Spare Support System
Satellite telecommunication system Globalstar has a number of ground base stations (gateways) dispersed all over the world. Successful operation of such a complex system depends on the ability to perform fast restoration of its operational ability after a failure. It can be reached by designing a maintenance system with hierarchical spare supply stocks of field replaceable units (FRU).
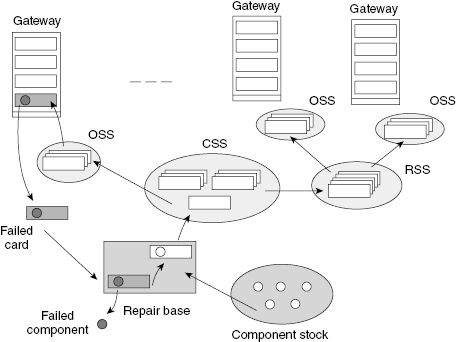
This supply system has a hierarchical structure with three levels: central spare stock (CSS), regional spare stocks (RSS), and on-site spare stocks (OSS) (see Fig. 12.1).
FIGURE 12.1 A hierarchical spare supply system.
Diversity of gateways and installing new ones leads to permanent change of FRU requests for replacements. Such a situation leads to the necessity of designing a computer tool that is both powerful enough and easily operational enough to solve the problem of optimal spare allocation.
The problems that arise are: (1) finding an optimal allocation of spare FRUs at each OSS depending on the size of the corresponding gateway, (2) finding the geographical location and size of each RSS and finding an optimal allocation of spare FRUs, and (3) finding the size of the CSS with optimal allocation of spare FRUs.
Gateway equipment consists of replaceable units. After each failure, a corresponding FRU from the OSS replaces the failed unit. A failed unit is sent to the repair base and after each failure a request is sent to the RSS, and the needed FRU is sent without delay (the so-called advance delivery). Regional and central stocks are usually supplied periodically: a request for replenishment is sent as soon as the level of stock declines to some critical level.
12.1.2 OSS, RSS, and CSS
We assume that gateways are highly reliable and their units are independent, so we neglect the possibility of overlapping of system down times due to different causes. For highly reliable systems, the approximate formula for the OSS unreliability coefficient, QOSS, is
The weights in Equation (12.1) are defined as ![]() , qk(xk) = unreliability coefficient of units of type k (cumulative Poisson function with parameter ak = nkλkθ), and xk = number of spares of type k in the OSS. For highly reliable systems, the approximate formula for the OSS unavailability coefficient, UOSS, is
, qk(xk) = unreliability coefficient of units of type k (cumulative Poisson function with parameter ak = nkλkθ), and xk = number of spares of type k in the OSS. For highly reliable systems, the approximate formula for the OSS unavailability coefficient, UOSS, is
(12.2) 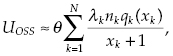
where θ is the time delay corresponding to advance delivery.
A regional spare stock is periodically replenished from the central spare stock. The number and location of gateways, which are served by a particular RSS, may change in time with the development of the telecommunication system. It seems that the best index characterizing the RSS is its reliability coefficient. The same might be said about the CSS, which is replenished by production (probably with a different period for different types of units). In principle, the solution for these cases is similar to the previous one with the difference that the advance delivery period starts with the installation of a failed unit.
12.1.3 Software Tool OSA (Optimal Spare Allocator)
OSA is a GUI-driven, user-friendly tool designed to solve the direct and inverse problems of optimal redundancy. Due to its terrestrial dispersion, the spare supply system has a multi-level hierarchical structure, as shown in Figure 12.2. In OSA it is possible to use a detailed branching type scheme with all gateways' stocks shown, as in Figure 12.3.
FIGURE 12.2 OSA tool: map of hierarchical stock system.
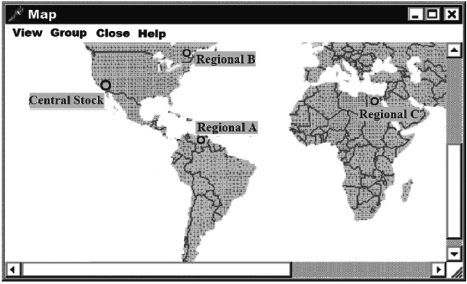
FIGURE 12.3 OSA tool: а hierarchical spare supply system structure.

For solving the optimal redundancy problem, the OSA tool uses the steepest descent method with insignificant modifications. The program's main window includes a menu of all available commands and a toolbar with the most frequently used operations.
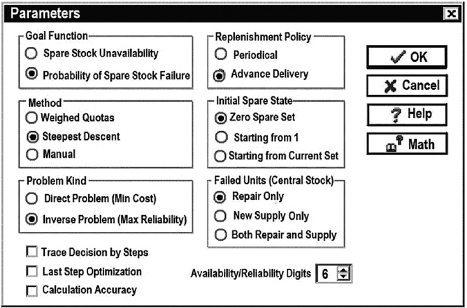
The “Parameters” window (see Fig. 12.4) allows the user to choose a goal function: probability of stock failure (no available FRU of needed type at a failure moment). It suggests method of calculation and gives a possibility to choose what kind of optimal redundancy problem is to be solved. The user also enters the replenishment policy (since the computer program is the same for all levels of stocks).
FIGURE 12.4 OSA tool: calculation options.
Other options are rather specialized and we will not describe them.
The window shown in Figure 12.5 presents a list of units with their main parameters needed for solving the optimal allocation problem.
FIGURE 12.5 OSA tool: Unit database.

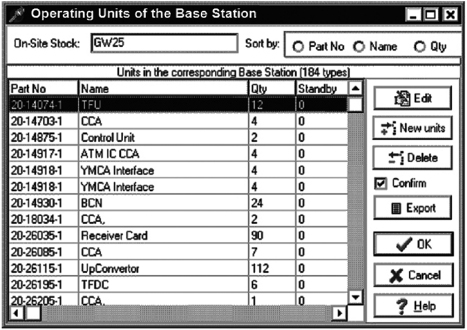
The next window (Fig. 12.6) shows specifications of the system: how many units of each type are installed within the system and how many active redundant units are installed. (The number of active redundant units influences the number of spare standby units.)
FIGURE 12.6 OSA tool: gateway specification.
The report of the results is presented in a customized table form (Fig. 12.7). A report can reflect results for any particular OSS or any chosen set of them. (It gives an opportunity to choose the shape and size of regions for each RSS.)
FIGURE 12.7 OSA tool: sample of a report.

The OSA tool is flexible and offers various calculation options to the user. It is able to solve the direct and inverse problems of optimal redundancy with two different goal functions. It also offers two separate replenishment policies. Results of calculations are presented in a report with layout specified by the user. Reports generated by the OSA tool may be saved for further processing or documentation.
12.2 Optimal Capacity Distribution of Telecommunication Backbone Network Resources
This project was performed for American telecommunications company MCI Communications Corp1 and was presented in 1991 at the MCI headquarters (Richardson, Texas). The objective of the project was to develop an algorithm that allowed optimal relocation of inner resources in case of failure of one of the main components of the MCI backbone network. The structure of the network and real data are given in conditional units.
12.2.1 Brief Description of the System
Consider an approximate and simplified backbone network. A backbone network is designed with some redundant capacity, so the network can stand periods of overloading and possible catastrophic failure due to natural cataclysms or intentional enemy action. To protect the entire system from lockout, each link of the network has a redundant capacity. Thus, in case of failures, neighbor links can take some traffic without jeopardizing their own successful operation. For instance, in Figure 12.8 triple lines denote links with higher capacity.
FIGURE 12.8 Backbone network structure.

12.2.2 Conditional Example
A network structure itself is a highly redundant system. Consider, for instance, the connection San Francisco–New York (see Fig. 12.8). The direct path serves not only the chosen terminal nodes but also serves to interconnect all cities lying on this path: San Francisco, Denver, St. Louis, Chicago, and New York all connect each other.
All links have such capacity that normal connection can be achieved even in hours of maximum traffic. Most of the time only a relatively small portion of the links' capacity is in use, so the network has a significant redundancy.
Assume that the traffic matrix is known (in conditional units of traffic intensity; see Table 12.1). From this matrix, one can calculate the traffic at each link. In the result, we will have the traffic distribution in Figure 12.9 in the network operating state with no failures.
FIGURE 12.9 Path between San Francisco and New York with loading on the links.

TABLE 12.1 Conditional Traffic Matrix

Let us consider the following scenario: the Denver–St. Louis link has broken down (see Fig. 12.10). What should be done to keep the normal connection between San Francisco and New York?
FIGURE 12.10 Breakdown of Denver–St. Louis link.

It is clear that the network having redundant capacity can redirect traffic through other links. However, a question arises: what is the best redirection of traffic?
To answer this question, one should formulate some requirements to the solution:
For finding the best redirection of the traffic, a linear programming model with some specific restrictions has been designed. The final solution of the traffic redirection is presented in Figure 12.11.
FIGURE 12.11 Example of redirection of traffic in the case of breakdown of the Denver–St. Louis link.

It is clear that a single link failure leads to traffic change in a significant part of the entire network. For instance, in the considered case we have to take into account not only traffic San Francisco–New York, but also traffic between other nodes laying on the original path. Actually, the model takes into account simultaneous traffic between all nodes of the network.
This model was intended to be used as a core controlling program for traffic redirection not only in cases of large breakdowns but also for temporary overloading of some parts of the network.
12.3 Optimal Spare Allocation for Mobile Repair Station
This project was performed by contract with Hughes Network Systems (Germantown, Maryland) for a maintenance service of clients of a global telecommunication system. Names of units are changed and real data are rounded, though are kept in original range.
12.3.1 Brief Description of the System
There is a service base (SB) that serves terrestrially dispersed clients within a particular zone (see Fig. 12.12). All clients have almost similar equipment differing by configuration and scale. When equipment fails, a corresponding client sends a request for repair to the SB. Immediately after getting a request, SB directs an available mobile repair station (MRS) to the client.
FIGURE 12.12 Schematic image of serving zone.

Each MRS has all needed instruments for repair and a set of spare field replacement units (FRU) for replacement of failed units. If there is a needed FRU, MRS performs a fast fix that takes just several minutes. Otherwise, a special request is sent to the SB and the needed FRU is delivered to the client in several hours. (In addition, it involves extra spending of money for restoration of the client's equipment.)
Equipment of clients can differ by configuration though it consists of almost the same set of components, the number of which exceeds several hundreds so it is impossible to keep FRU of all types in the MRS spare stock. Thus, one meets the problem of finding an optimal list of spares at MRS stock that provides maximum probability of first fix under the given restriction on the total available room for spares.
12.3.2 Formulation of the Problem
Denote available space of MRS stock V*. Let client j, ![]() , have equipment with
, have equipment with ![]() components of type k (let's call it component k). Denote failure rate of a component of type k by λk,
components of type k (let's call it component k). Denote failure rate of a component of type k by λk, ![]() . Then the flow of requests formed by components k, Λk, arriving at the SB, which can be written as
. Then the flow of requests formed by components k, Λk, arriving at the SB, which can be written as
(12.3) ![]()
The total flow of requests, Λ, is equal to
(12.4) ![]()
It is clear that a current failure occurs due to a failure of component-k occurs with the probability
(12.5) ![]()
Denote available space of MRS stock by V and physical volume of component k by vk. If one assumes that there are no multiple instantaneous failures and the probability that the second failure of the same equipment during FRS travel time is negligibly small, than the solution of the problem is very simple: one calculates values
(12.6) ![]()
and then takes the first S components that satisfy the following condition:
(12.7) ![]()
In practice, FRU of different types are approximately of the same volume, that is, vk = v. It means that instead of ordering values wk, it is enough to order values pk. Refer to Figure 12.13.
FIGURE 12.13 Explanation of the solution.

12.3.3 Case Study
In this particular case, the volumes of FRU are approximately the same, so the limitation is for the total number of FRUs, which is equal to 51.
Values of Λk for various components are given in Table 12.2. In this table, column “O” (for “old”) contains the number of spares in the initial list and column “N” (for “new”) contains the number of spares in the final list obtained by suggested method. For the sake of brevity, we omitted those types of equipment components for which both spare lists (initial and suggested) have zero spare units at the MRS stock.


From the complete list of equipment components (it is not presented), one can find that the total failure rate in the chosen service zone is equal to Λ = 0.254 (1/day), that is, approximately 1 failure in every 4 days. Failures covered by the initial set of spares form a failure flow with rate Λk = 0.136, and for a suggested set of spares the analogous value is equal to ![]() .
.
It means that the probability of FF has been increased from ![]() to
to ![]() .
.
12.3.4 Evaluation of Bargain
It interesting to evaluate what a financial bargain has to do with the application of simplest optimization technique. Approximate evaluation of expected gain made by customers showed that the entire service system spreading over the United States gets on average about 44,000 calls a year. MRSs with initial spare stocks made about 44,000 × (1 − 0.535) ≈ 20,500 extra deliveries due to lack of needed FRU in their stocks. The suggested spare stock leads only to 44,000 × (1 − 0.902) ≈ 4,300 extra deliveries, that is, about 16,500 deliveries fewer. Each visit takes on the average about 2 hours (round trip) and about 0.5 hour for equipment inspection at the client site. Each visit costs at least $150 (plus overheads), so the total gain is about $24.7 million a year.
Note
1 MCI Communications Corp. was an American telecommunications company founded in 1963. In the beginning of 2006 MCI was incorporated into Verizon with the name Verizon Business.
Chronological Bibliography
Ushakov, I. A., and Aliguliev, E. A. 1989. “Optimization of data-transmitting network parameters using the method of statistical modeling.” Soviet Journal of Computer and System Sciences (US), vol. 27, no. 1.
Ushakov, I. 1994. Methods of Research in Telecommunications Reliability (An Overview of Research in the Former Soviet Union). RTA.
Antonov, S., Chakravarty, S., Hamid, A., Keliinoi, T., and Ushakov, I. 1999. “Spare supply system for Globalstar, a worldwide telecommunication system.” Proceedings of the 24th International Conference on Computers and Industrial Engineering, Middlesex, England.
Chakravarty, S., and Ushakov, I. 1999. “Reliability Measure Based on Average Loss of Capacity.” Proc. of the 15th Triennial IFORS Conference, Beijing, China.
Ushakov, I., Antonov, S., Chakravarty S., Hamid A., and Keliinoi, T. 1999. “Spare supply system for Globalstar, a worldwide telecommunication system.” Computers and Industrial Engineering, no. 1.
Chakravarty, S., and Ushakov, I. 2002. “Effectiveness analysis of Globalstar gateways.” Proc. of the 2nd Biennial Conference Mathematical Models in Reliability, Bordeaux, France.
Chakravarty, S., and Ushakov, I. 2002. “Reliability influence on communication network capability.” Methods of Quality Management, no. 7.
Chakravarty, S., and Ushakov, I. 2002. “Reliability measure based on average loss of capacity.” International Transaction in Operational Research, no. 9.
Puscher, W., and Ushakov, I. 2002. “Territorially dispersed system of technical maintenance.” Methods of Quality Management, no. 2.
Puscher, W., and Ushakov, I. 2002. “Calculation of nomenclature of spare parts for mobile repair station.” Methods of Quality Management, no. 4.
Ushakov, I.A. 2005. “Terrestrial maintenance system for geographically distributed clients.” The International Symposium on Stochastic Models in Reliability, Safety, Security and Logistics (book of abstracts), Beer-Sheva.