What do you want? When do you want it? How much are we going to spend?
DESIGN IS an activity that can consume significant time and resources. In this chapter, we will present four tools that a small design team can use to manage and control a design project, particularly within an academic setting.
16.1 GETTING STARTED: ESTABLISHING THE MANAGERIAL NEEDS OF A PROJECT
All successful projects, whether large or small, whether on a grand scale or within an academic class, must address three essential concerns: The project team must (1) complete whatever tasks are required by the project, (2) do so within a specified time frame, and (3) work with the available resources. These three elements are summarized in terms of the “3S” model shown in Figure 16.1:
- The scope of a project sets limits on what the team must accomplish, particularly in prescribing the projects deliverables (e.g., a finished design, a working prototype, or fabrication specifications).
- Scheduling defines the time frame within which the project must be completed.
- Spending identifies and limits the available resources and how they may be applied to the project.
These project elements often compete with one another, so the project manager has to balance them in order to move the team to a successful outcome.
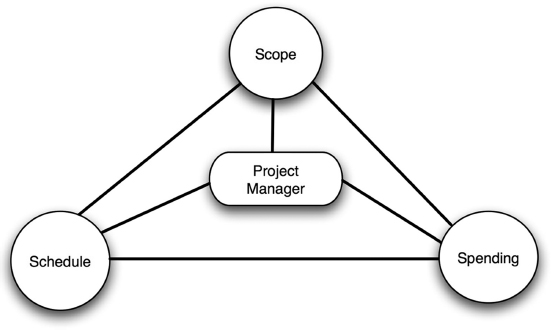
FIGURE 16.1 Project management can be thought of as balancing the three Ss; Scope, Schedule, and Spending.
We noted in Chapter 2 that a design problem may begin with a simple client statement, “We want a design for a new product.” The design team has to refine this open-ended statement into a clear list of deliverables consistent with the scope, schedule, and available resources. In direct analogy with the problem definition phase of the design process, successful project management begins with a questioning process aimed at articulating a clear understanding of what the client or sponsoring organization requires. Consistent with that analogy, we begin by asking questions—mostly, but not exclusively, of the client—in which aim to set the parameters for the project's three basic elements. So for our project we
clarify the scope of the project by asking questions like:
- Do you want a conceptual design, a detailed design, or something in between?
- Do you require a working prototype?
- Is full engineering functionality needed, or will a demonstration of key functions be sufficient?
- How much testing of the design and prototype do you want?
- Is a complete set of engineering drawings of the final design needed?
- How should the design be documented and formatted?
- To whom do we, the team, report?
establish the schedule for the project by asking questions like:
- When are the final deliverables due?
- Are there intermediate due dates?
- When should the team meet?
identify spending and resource limits for the project by asking questions like:
- Can we use outside resources (e.g., shop staff or drafting experts)?
- How many people will be on the team, and how much of their time is available for this project?
- What materials and supplies are available to the design team?
- Where will the team meet and work?
We can plan our team's work and avoid problems later if we get answers to these questions at the beginning of our project because we then can organize our time and resources to meet the project deliverables. Also, there will be no surprises at the end of the project about what was expected, when things were due, or how much the project cost. In Section 16.2 we look at two tools that are particularly helpful for clarifying and documenting the scope of a project.
16.2 TOOLS FOR MANAGING A PROJECT's SCOPE
It would be nice if everything about a project could be known at the start. Then a project manager could simply list the work, add up the time duration, sum up the costs, and announce a work plan to the world. Unfortunately, most engineering projects don't work this way, and design projects face even more unknowns than most other projects: How long will it take to have a good idea? What will it cost to build a prototype for a design that is as yet unknown?
Put simply, design project managers face the complexities of other engineering projects, to which are added the uncertainties associated with creative activity. While this might tempt a design team leader to forego management tools, successful project managers have found that some specific tools can be very powerful in setting up and controlling projects. Two of these tools are (a) the team charter, which is a “mini-contract” between the team, its client, or sponsor, and the organization within which the design team works, and (b) the work breakdown structure, which is an ordered list of what must be done to complete all the required tasks to complete the project.
16.2.1 Team Charters
A team charter is an agreement that the team has reached with other stakeholders about the project requirements, including what constitutes project success, and what limits on the project may apply.
The team charter is, in many ways, the management analog to the revised problem statement that we discussed in Chapter 3. Recall that at the outset of the project there may be errors, biases, and incomplete information in the initial problem statement. An effective design team works to restate the problem in a way that clearly states the client's needs while offering a large design space within which to meet those needs. In a similar vein, a project manager needs to understand:
- the goals of the project, including both minimally acceptable goals and “stretch” goals;
- how those goals align with larger organizational goals;
- the authority for the project;
- the project deliverables;
- the time frame for the project, including any limits on the schedule;
- the resources available for the project; and
- any unusual circumstances associated with the project.
This information, once gathered, can be written up in the form of a team charter and distributed to the client, managers within the larger organization, and all team members. In many organizations, drafting of the charter is begun before the team (or even a project manager) is selected, and is then completed by the project manager. Often the sponsor, senior managers of the design firm, and the project manager sign the charter or agreement to complete the chartering process.
The charter is used for a number of purposes throughout the project's life. It describes the project to prospective team members, elicits commitment from team members, and settles conflicts about resources, timing, or scope. Because of its written nature, it can also be used later in the project to avoid “scope creep” or “mission growth,” the tendency for project goals to be expanded as the problem becomes better understood, or as team or client interests change.
Like the revised problem statement, team charters are fairly short, usually only one or two pages long. It needs only to be long enough to lay out the goals, roles, resources, deliverables, and major schedule points. The key is that the project manager and the team include the information needed to make the charter valuable as a negotiating tool and a formal record when it may be needed later.
Figure 16.2 shows an example of a team charter for a student project. Notice the charter's overall structure. It first lays out the goals for the project in terms of the client or sponsor's goals, the team's goals, and the organizational goals (in this case, the course instructors). This helps identify any disconnects between the parties and also clarifies what each party hopes to get out of the team's work. The charter then specifically spells out the deliverables, or work products, for which the team is responsible. This sets limits on what must be done and helps the project manager define the resources needed to complete the project. Many charters also incorporate a schedule of key milestones in the deliverables section by specifying due dates. The charter also calls out the resource limits for the project. This is important so the client does not misunderstand the intended work effort—thinking, for example, that the student team is working full time on the project. It also commits the team members to full participation at the level of a course, avoiding free rider problems. Many charters will also include a section for project-specific remarks that may be important to some of the parties. Finally, the charter, while not truly contractual in nature, may include a signature block to help commit the team and other stakeholders to the project's intentions.
The information used to develop the charter is usually readily available to project managers early in the project. For example, the aforementioned revised problem statement should identify project goals and deliverables, and it may include schedule constraints. Wise project managers also know to negotiate resources early in the process of taking on a project; the project manager's authority and any special circumstances are also likely to emerge during these early discussions.
It is important to note that project goals and organizational goals are distinct objects: Project goals are the specific accomplishments or outcomes expected of the project itself, such as a solution to a specific problem. Organizational goals reflect the intentions of the larger entity (such as the college, for a student project). These organizational goals may include exploring potential technologies or developing skills that will be useful in future endeavors. If project goals and organizational goals are not aligned, it is quite possible that a project may seem like a success but ultimately go nowhere—because the organization chose not to pursue it. If the project and organizational goals are aligned, it may be that a project that appears relatively unexciting on its own will be seen as part of a larger, more exciting program.

FIGURE 16.2 A team charter for the Danbury support arm project sets out goals, relevant parties, deliverables, and time and resource limits.
16.2.2 Work Breakdown Structures
Most engineers address complex problems by breaking them into smaller problems, with decomposition continuing until each piece can be solved with known methods, or until the hardest part of the problem has been characterized. In a similar fashion, engineering managers like to decompose projects into small enough units that they can identify who will be responsible, establish how long the smaller task will take, and determine the resources required to complete that smaller task (or subtask).
The primary tool that is used to determine the scope of a project is the work breakdown structure (WBS). The WBS is a hierarchical representation of all of the tasks that must be performed to complete a design project. Project managers generally use WBSs to break the work down (hence the name) into pieces sufficiently small that the resources and time needed for each task can be estimated with confidence.
Consider the everyday task of driving a car. Even though this is a common task, many of us might be overwhelmed if asked to describe exactly how to start and drive a car. We might start with something like “first you adjust the seat and mirrors”—which presupposes that you have already gotten into the car and thus know how to get in. If forced to describe this task to someone who rarely drove or relied exclusively on public transportation, we might break our description down into a number of task groups, such as unlocking the car door, getting into the car, adjusting the seat and mirrors, starting the engine, maneuvering the car, and so on. We might even want to review the entire plan before starting the car so that our novice driver is comfortable with all of the steps between unlocking the car at the start and safely exiting at the finish. This decomposition of tasks and subtasks is the central idea of the work breakdown structure. When we are confronted with a new, large, or difficult task, one of the best ways to figure out a plan of attack is to break it down into smaller, more manageable subtasks.
A more compelling example is that of a team that has been asked to design a spacecraft. The team will have to design across several specialties, including propulsion, communications, instrumentation, and structures. Here the design team leader will want to be certain that all the necessary tasks have been listed and included to ensure that there are no surprises when the craft is in flight. The WBS lists all of the tasks needed to complete the project and organizes them so as to help the project leader and the design team understand how all those tasks fit into the overall design project.
Figure 16.3 shows a work breakdown structure for the tasks from the juice container design. At the top level, the WBS is organized in terms of eight basic task areas:
- understand customer requirements;
- analyze function requirements;
FIGURE 16.3 A WBS for the juice container design project. Because the design project is just beginning, the structure necessarily takes on a formal and somewhat generic framework. Note, however, that the designers are already aware of some details, such as the distinction between identifying consumer needs and prior designs.
- generate alternatives;
- evaluate alternatives;
- select among alternatives;
- document the design process;
- manage the project; and
- detailed design.

Each of these top-level tasks has been broken down in subtasks. Because of page size limitations, we show in great detail only a few of the tasks (e.g., understanding customer requirements) for this example. If we were actually on a team carrying out this project, we would likely go into greater depth in all of the areas. We look for four properties in a WBS such as that displayed in Figure 16.3:
- Full breakdown into parts: Each item that is taken to a lower level is always broken down into two or more subtasks at that lower level.
- Adequacy: The breakdown is adequate to allow the parts to be managed. If we cannot determine how long an activity will take or who will do that activity, then a key WBS rule is that we should break the task down further. In fact, experienced project managers will be more inclined to have shorter, less detailed WBSs than relatively inexperienced managers, because their greater experience makes them more able to aggregate subtasks into identifiable, measurable tasks.
- Completeness: Any task or activity that consumes resources or takes time should be included in the WBS explicitly or as a known component of another task. That is why the tasks of documentation and management are shown in Figure 16.3. Activities such as writing reports, attending meetings, and presenting results are essential to the completion of the project, and failure to plan for them as work will certainly result in problems later.
- Additive: All the lower subtasks of the hierarchy must be equivalent to completion of the full task above them. This also means that the time needed to complete an activity at a top level should be the sum of the times for tasks listed at the level below. Therefore, breaking work down to the next level below must be done thoroughly and completely.
It is also important to note what the WBS is not. First, a WBS is not an organization chart for completing a project. Although “org charts” are visually similar, a WBS is a breakdown of tasks, not of titles, roles, or people in an organization. Second, a WBS is not a flowchart showing temporal or logical relationships among tasks. The listing of tasks in a WBS may be organized such that a task (e.g., writing the final report) is shown in a different part of the hierarchy than other tasks that must precede it (e.g., all of the design, building, and testing that is being reported). Third and last, a WBS is not a complete listing of all the disciplines or skills required to complete the project. Tasks performed by team members with many different skills can be combined into the same part of the hierarchy as long as the WBS meets the above criteria.
Figure 16.4 shows a sample WBS for the Danbury arm support project. It is organized as an indented list rather than a graph, and the tasks are arranged differently than the juice container example, with areas like “Preliminary work,” “Zoning in,” and “Overarching work.” The key point here is that a team can arrange the WBS in some other way (i.e., the WBS does not have to be a graph), so long as it reflects the four basic properties: full breakdown into parts, adequacy, completeness, and additive. In fact, teams often find it easier to start with an indented outline when they first draft a WBS. We will see later, however, that the graphical form has some advantages for monitoring a project's progress.

FIGURE 16.4 An excerpt from a WBS for a third Danbury support arm team. Notice that the overall structure is not the same as that in Figure 16.3, but many of the same tasks appear. Ahmad etal. (2007).
In the end, the WBS is a tool for a project team to use to ensure that they understand all of the tasks that are needed to complete their project. That is why a WBS is so valuable for determining the scope of the project.
16.3 THE TEAM CALENDAR: A TOOL FOR MANAGING A PROJECT's SCHEDULE
Scheduling tools help us to plan activities, remind us of important project due dates, and also assist in identifying those things that might really mess up our project if we don't do them on time. We focus here on the team calendar, which shows the time that is available to the design team, with highlights that indicate deadlines and time frames within which work must be completed. Team calendars are used by virtually all teams, particularly those doing design work, and it is the most suitable scheduling tool for doing conceptual design projects in an academic setting.
A team calendar is simply a mapping of deadlines onto a conventional desk or wall calendar. Such deadlines will certainly include externally imposed ones, such as commitments to clients (or to professors for academic projects), but should also include team-generated deadlines for the tasks developed in the WBS. In this sense, the team calendar is really an agreement by the team to assign the resources and time necessary to meet the deadlines shown on the calendar. Figure 16.5 shows a team calendar for a student design team that is seeking to complete its project by the end of April, an externally imposed deadline. Note that the calendar includes several deadlines over which the team probably has no control, such as when the final report is due and when in-class presentation of results is to be done. It also includes routine or recurring activities, such as Tuesday night team meetings. Finally, it includes some deadlines that the team has committed to realizing, such as completing a prototype by 5 p.m. on April 2.
Several points should be kept in mind in setting up a team calendar. First, the idea of a team calendar implies that the deadlines are all understood and agreed to by everyone on the team. As such, the calendar becomes a document that can—and should—be reviewed at every team meeting. Second, the team calendar should allow times that are consistent with the time estimates generated in the WBS. If a task was determined to take two weeks to complete, there is little point in allowing that task only one week on the team calendar. A final point to note is that a team calendar, while easily understood by members of a team, cannot by itself capture the relationship between activities. For example, in Figure 16.5 we see that building the prototype precedes proof-of-concept testing only because the team chose to put it that way. For many devices a proof-of-concept may precede building a final prototype. A team calendar cannot address this sort of problem, nor can it “remember” team decisions of this sort.
It is important to note that the WBS and the team calendar are related. Although the WBS is not structured to reveal the temporal relationships among tasks, it can often remind us of them, especially if we have followed the principles of completeness and adequacy. For example, just noting that work on a foundation includes digging a hole, erecting forms, and pouring concrete, does not guarantee that we will do this in order, but it certainly should help us remember. Similarly, the adequacy property says we should have broken our tasks into pieces for which we can assign responsibility and estimate durations. This means a project manager can, while building a team calendar, go to the responsible individual to ask about timing. In order to facilitate this, many teams modify their WBS to include a box for each task and subtask showing the duration. Using the additive property, we should only need durations for each of the lowest level tasks.

FIGURE 16.5 A team calendar for a student design project that includes externally imposed deadlines, team commitments, and recurring meetings. It is usually better to make the team calendar “too complete” than it is to leave out potentially important milestones or deadlines.
Finally, we note two other scheduling tools that are frequently used in project management: the Gantt chart, which is a horizontal bar graph mapping activities against a time line; and the activity network, which graphs the activities and events of the project, showing the logical ordering in which they must be performed. Gantt charts and activity networks are both powerful graphical representations of the logical relationships between tasks and the time frames in which they are to be done. Both are used for large-scale projects and are almost always generated using project management software.
16.4 THE BUDGET: A TOOL FOR MANAGING A PROJECT's SPENDING
A budget is a list of all of the items that will incur an economic cost, organized into some set of logically related categories (e.g., labor and materials). The budget is the key tool for managing spending activities in a project. Note that there is an important distinction between the budget for doing the design, or design activities, and the budget needed to produce or build the artifact being designed. Our concern is primarily with the budget needed to do a design.
Budgets are difficult but essential tools for project management. They permit teams to identify the financial and other resources required, and to match those requirements to the available resources. Budgets also permit teams to account for how they are spending project resources, some of which are reflected in money, others in hours (e.g., student time on an academic project). Finally, budgets also formalize the support of the larger organization from which a team is drawn.
Fortunately, we usually don't need large, complex budgets for doing the sort of design projects we are likely to do in an academic setting. Remember that we are concerned with the budget for doing the designs, not with the budget for making the designed objects. Figure 16.6 shows what a budget for the Danbury School project might look like. Design project costs normally include labor, research expenses, materials for prototypes, travel, and other support expenses. We limit our budget discussions to these cost categories, looking specifically at labor, materials, travel, and incidental expenses.
Estimating labor budgets usually begins with analysis of each type of labor required for the tasks of the project, estimated in hours of work, and only then multiplied by a labor rate. For student projects, it makes more sense to estimate the hours involved than worry about wage rates, since students generally don't get paid to do their coursework. A good starting point for estimating labor hours are the durations implied in the WBS, although this is not sufficient. Because the WBS provides durations, no distinction is drawn between a one-week task done by the whole team and a one-week task done by one team member. This means that the WBS must be broken down into more detail to identify the number of people working on a task during its duration as specified in the WBS.
In budgeting for materials in a design project, it is necessary at the outset to think about what sorts of solutions are possible and also to keep in mind what the charter requires. If, for example, a functional prototype is a deliverable, we need to plan and estimate costs to build and deliver it, including labor and materials. Similarly, if the final report is to be bound in a particular way, we should budget for that cost. This is not to say that we have implied a particular design solution; rather, we should consider our resource needs as early as we can. To address this uncertainty, design teams often use not-to-exceed budgets for design projects. This type of budget specifies an upper limit on what costs are allowed. There are two dangers in this approach: First, if an organization budgets this way routinely, resources set aside for design projects may never be used. Second, teams may overspend, viewing not-to-exceed as “Why not? We have budgeted this much money.”

FIGURE 16.6 A team budget for the Danbury support arm project. The budget allocates hours to the project for labor, and uses dollars to track out-of-pocket expenditures. In a company, the hours would typically be translated into dollar costs. Notice that the team has been given a not-to-exceed amount, so it is allowed only $116 for materials for its prototype.
Travel expenses arise if we need to meet with clients or users, or if we have project needs that can only be met with off-site visits. Most organizations have internal rules about travel (e.g., mileage allowances, per diem limits on meal and lodging). Thus, it is a good idea to check with internal supervisors (e.g., faculty advisors) before making travel budgets.
Many budgets include a “miscellaneous” category. This reflects a temptation to set aside resources, time, or money, to balance later overruns in other project categories. We should avoid this trap. Using such “fudge-factors” muddies our understanding of project cost structure, needlessly ties up organizational resources, and reflects a lack of clear thinking on our (and our project manager's) part. We should only call out specific costs we expect to incur (e.g., library-related research expenses). Using safety factors or a “miscellaneous” category to hide reserves reflects poorly on our team and our management skills.
Finally, it is important that we properly value the time invested in a design project by each and every member of a design team. This is important even in projects done in design courses. (In fact, there is a tendency to undervalue this very scarce resource simply because we typically do not attach a dollar figure to student labor in the budget.) In practice, most engineering firms charge between two and four times an employee's direct compensation when they bill a client for that employee's time. That multiplier covers fringe benefits, overhead costs, supervision, and profit. If we were to pay student time at a wage rate of only $8.00 per hour, a team of four students working 10 h each week on a project for 10 weeks would be billed out by a design firm at $6400–$12,800 for the entire project. Put in dollar terms, time is a valuable, scarce, and irreplaceable resource—don't waste it! Put in human terms, when we undervalue the time of our fellow team members, we are disrespecting the contributions we expect them to make to our project's success.
16.5 MONITORING AND CONTROLLING PROJECTS: MEASURING A PROJECT's PROGRESS
We have now developed a plan, expressed in terms of a charter, a schedule, and a budget. How do we track our team's performance relative to that plan? This is an important question, but it can be very hard to answer even for a simple academic design project. If we were managing a construction project, we can go out and see if a task has been done by the date planned. In a design project, however, monitoring and control are more subtle and, in some ways, more difficult. Therefore, it is essential that our team agree on a process for monitoring our progress before the project gets very far underway.
There are a number of techniques and tools available to monitor projects, but these often involve team members filling out time sheets, punching clocks, or other accounting tools. For smaller design projects, especially academic projects, these kinds of tools may not be very effective. We therefore present a highly simplified version of the percent-complete matrix (PCM) that is widely used in an industry to relate the extent of work done on the parts of a project to the status of the project overall.
The goal of the PCM is to use the information in the WBS and, if available, the labor budget, to determine the overall status of the project. Constructing a PCM requires only that we know the cost (or time requirements) of each item or area of interest, and the percent of the total cost or time corresponding to that item. The PCM then allows us to input the percent of the work on that task or work item and, by summing over all the items in the project, we can calculate the total percent of the project completed. In general, the method is best suited to cases where there some clear method of calculating progress is available. If, for example, the foundation work of a building project constitutes 25% of the total expected costs of a project, then completing one-half of the foundation work means we have completed 12.5% of the cost basis of the project. A manager can periodically update progress in each of the general areas in the WBS to determine overall project progress.
In design projects a physical measure such as yards of concrete poured is not available for estimating progress on a task. In fact, design managers are generally more concerned with progress relative to allowed time than to available budget or any physical measures. One way around this is to use the tasks in our WBS as a control tool. Recall that we estimated the time duration of each activity, and that completion of all the lowest level activities of the WBS sums to completion of the project. This means that if we track progress along the bottom of the WBS, we will have tracked progress for the entire project.
Some design teams use a simple algorithm for tracking task-level progress. When work is begun on a task, a share of that task's hours (e.g., 25%) is immediately credited to the team. At team meetings, the responsible individual for that task is asked for updates. When she says that the work is half finished, the task is credited with 50% progress. When the responsible individual says the task is finished, 90% is credited, and the remainder is credited to the task when the relevant work product is accepted by the team or the project manager.
Consider the simplified WBS in Figures 16.7 and 16.8. Figure 16.7 shows a total time estimate for each task. Figure 16.8 shows the progress on each task with a graphic legend, as follows: Tasks are highlighted in bold when begun, marked with a slash when completed halfway, marked with an X when turned in, and shaded when accepted. If we use this crediting scheme, we can estimate the percent of the project that has been completed. In this case, the team has held meetings with its client (32 h), completed its research (120 h), held half of its meetings with users (32 × 50% = 16 h), and half of developing its objectives tree (12 × 50% = 6h). They have also begun reviewing drafts of the objectives tree (4 × 25% = 1h) and have completed the written design specifications task—although the final product has not yet been accepted (40 × 90% = 36 h). Adding up the numbers, the team has completed 211 h (32 + 120 + 16 + 6 + 1 + 36). Since the total project time is 1248 h, the team has completed 17% (211/1248) of the project. This may represent good progress if we are monitoring early in the project. If we're measuring halfway through the project's projected calendar, the results are likely not so good.

FIGURE 16.7 A WBS with allocations for tracking team progress in hours. Notice that the hours for the lower subtasks sum up to the hours for the level above, which is consistent with the requirements for WBS. With this version of the WBS, the team can use cross-outs to indicate an estimate of the percent of work completed.

FIGURE 16.8 The WBS in Figure 16.7 used as a monitoring tool. The boxes in bold represent tasks which have begun (credited with 25% of the task hours), those with slashes are half finished (50%), those with Xs have been turned in as complete by the responsible individual (90%), and those shaded have been accepted by the project manager or client (100%).
This simple approach allows a project manager to monitor progress in several ways. By adding up (percentage × duration) products, the manager can estimate the overall task share done and compare it to the actual calendar time used. The manager can also note whether there's a problem with a particular team member. If, for example, A always begins projects (bolded boxes) but never completes them (X's), the manager (and the entire team) will see this as the project unfolds.
We can't, however, monitor design projects just with charts. We need team meetings, private conversations, and techniques such as those we presented in Chapter 15, to motivate our team. At times, we may even use creative conflict. Nevertheless, formal tools are useful to teams, both to describe progress and to serve as a basis for conversation in the person-oriented aspects of management.
16.6 MANAGING THE END OF A PROJECT
In practice, most projects do not simply end with the delivery of materials to the client, but with a project postaudit: An organized review of the project is conducted, including its technical work, management practices, work-load and assignments, and its final outcomes. This is an excellent practice to follow, even for student projects that end with teams disbanding completely.
The key point behind a postproject audit is to focus on doing an even better job next time around: What mistakes did we make that we can avoid in the future? Are there particular things we can do better? As a practical matter, a postproject audit may happen in simple hour-long meeting, or it may be part of a larger formal process that is directed by a design team's organization. Regardless of the mechanism, there are four elements in a basic postaudit process:
- review the project goals;
- review the project processes, especially in terms of ordering of events;
- review the project plans, budgets, and use of resources; and
- review the outcomes.
Reviewing the project goals is particularly important for design projects, since design is a goal-oriented activity. If the project was supposed to solve problem A, then even an idea that results in earning a patent for solving problem B may not always be viewed as a success. We can only evaluate a project meaningfully in terms of what it set out to do. To this end, we should review how we used the problem definition tools and techniques as part of our postaudit.
Closely tied to reviewing the results of using design (and management) tools is evaluating the effectiveness of the tools themselves. Just as a toolbox may contain many items that are only useful some of the time, many of the formal methods and techniques that are presented in this book and elsewhere will be more effective in some situations than in others. No catalog of successes or failures by outside authors will have the same purchase with a team as its own experience. Reflecting on what worked and what didn't and coming to grips with why a tool did or did not work are important elements of a postproject audit.
Similarly, it is also important to review how our team managed and controlled our work activities. We tend to learn how to organize activities, determine their sequence, assign work, and monitor progress only with practice and experience. Such experiences are much more meaningful if we review and reconsider them after the fact. As with design tools, management tools are not equally useful in every setting—although some, such as the WBS, appear useful in almost every situation. In commercial settings, reviews of both budgets and work assignments provide critical grounding for future projects.
The last postproject audit step is a review of the project's outcome, in terms of the goals set and the processes used. While it is obviously useful to know whether or not we achieved our goals, it is important for us as team members to know whether this was a result of good planning, good execution, adequate resources, or simply good luck. In the long run, our team will have repeated successes only if we learn to plan well and to execute well.
Finally, we should not use a postproject audit to assign blame or to point fingers. Many project and institutional settings have formal mechanisms for peer review and supervisory evaluation of team members, and they provide valuable means for highlighting individual strengths, weaknesses, and contributions. But they also provide team members with important insights that they can use to improve their own work on design teams. That is why individual performance reviews are not central to, or even a desirable aspect of, a postproject audit. The audit is intended to show what the team and the organization did right to make the project successful, or what must be done differently in the future if the project was not successful.
16.7 NOTES
Section 16.1: The underlying conceptual model for the 3S approach is from Oberlander (2000).
Section 16.2: The WBS for the Danbury project comes from Ahmad et al. (2007).
Section 16.5: The use of the standard form of the percent-complete matrix is given in Oberlander (2000).