Toward Analytics and Prediction
“The world is full of people whose notion of a satisfactory future is, in fact, a return to the idealized past.”
—ROBERTSON DAVIES, A Voice from the Attic, 1960
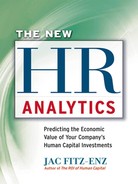
I introduced human resources metrics in 1978, with a series of public workshops based on my experience running a human resources department for a bank and later a computer company. Since then metrics have experienced a long, slow, and somewhat unsteady evolution. With every economic downturn we seem to retreat to the old familiar, if ineffective but comfortable, ways. As the market reopens, so do our minds and we try once again to make progress. In my view, human capital metrics passed through several evolutionary steps and continues to evolve. These are shown in Figure 2.1.
The Language of Metrics and Analytics
If HR professionals truly want to be part of the business, metrics—and especially predictive analytics—will open the door to that citizenship. Metrics are the language of organizational management. If you do not speak the same language as your audience, you cannot make an impression. Conversely, when people share an idiom, and more important, a mindset, they have the basis for a relationship. The research reported in Workforce Intelligence Reports 2007 and 2008 revealed the rationale for a management model that promises to help establish better communications between line managers and human resources professionals.1
Figure 2.1. Evolution of human capital metrics.
Human resources analytics is a communications tool, first and foremost. It brings together data from disparate sources, such as surveys and operations of different units or levels, to paint a cohesive, actionable picture of current conditions and likely futures. As in most cases, human capital measurement began with simply recording inputs and outputs of the workforce. This is the province of accounting. Accountants monitor income and expense to tell management what ensues as a result of past decisions and investments. HCM takes us beyond that. It positions management with a view of tomorrow.
First Steps
There are five ways to measure anything in business. They are cost, time, quantity, quality, and human reaction. The central question is: Which is most important to track? The answer is: It depends. If we accept that measurement is an activity and activity is expense, it follows that we don’t want to waste our time on metrics of little value. Value comes from knowledge of things that matter. And what matters is a business question, not an HR question: what matters at what points in time and for what organizational purpose.
This takes us to the five steps of analytics.
Step 1: Recording our work (i.e., hiring, paying, training, supporting, and retaining). If we learn through measurement how efficient our processes are, we can improve them, thus creating value for the organization indirectly by saving money or time, or by increasing the ratio of output to input, or by making an employee or customer happier as the result of a less intrusive process or a better result.
Step 2: Relating to our organization’s goals (i.e., quality, innovation, productivity, service [QIPS]). QIPS encompasses the fundamental goals of any organization. Targets are set periodically by senior management across these process outcomes and are reviewed on a regular basis. We want to link the results of our work to its impact on QIPS goals. This shows there is value in our work.
Step 3: Comparing our results to others (i.e., benchmarking). To be effective, benchmarking requires knowledge of the organizations to which we will be compared. Broad data about a comparative group in an industry or a region have only marginal value because of their great variance within that population. The more detail we can find, the more the value of the benchmarks.
Step 4: Understanding past behavior and outcomes (i.e., descriptive analytics). This is the first level of true analysis. It looks for and describes relationships among data without giving meaning to the patterns. It is exploratory rather than predictive. From it, we begin to see trends from the past; yet, it is risky to extrapolate from the past into the future, considering the volatile, rapidly changing markets of today and likely tomorrow.
Step 5: Predicting future likelihoods (i.e., prescriptive analytics). This form of analysis relates what we know to what we don’t know. It compares what happened yesterday to what will probably happen tomorrow. Predictive analytics ascribes meaning to the patterns observed in descriptive analysis. Banks use this method to predict the creditworthiness of borrowers. Insurers use it to predict patterns of illness and mortality. Human resources can apply it to decisions about the expected return on human capital investments in hiring, training, and planning.
Ascending the Value Ladder
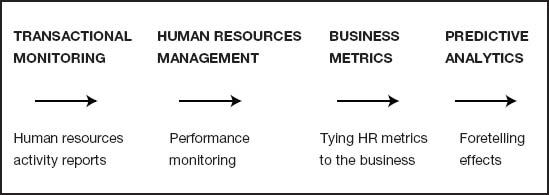
As we move from understanding the efficiency of our processes to being able to predict the organizational outcomes for a given human capital investment, we ascend the value ladder. Figure 2.2 shows the relative value of each step.
In almost every case, organizations start at Step 1, collecting basic data on cost, time, and quantity. This is where we began human resources measurement in 1978 and is described in detail in my earlier books. Up to that point, we had only vague notions of what had resulted from the work of the personnel and training functions. When HR is operating in a commercial business, or even a nonprofit organization, it needs to know and be able to explain why, what, and how it is doing what it does. It is only reasonable that when we ask for resources, we explain what we are going to do with them and the value that we intend to produce as a result. In a sense, it is not much different from asking our children what they are going to do with their allowance. When we learn from collecting cost, time, and quantity data, eventually we will ask ourselves what the quality of this work is and how it affects others. For example, we upgrade from cost per hire and time to fill requisitions to quality of hires. If we spend money on training, the questions are: How relevant is the training? Are the trainees doing a better job as a result of this experience?
Figure 2.2. Measurement’s ascending values.
To assume that our work has value without offering any supporting data is arrogant and a dereliction of duty. It is also dangerous. Why do you think every economic downturn decimates functions such as training? No reported value!
Eventually, some will come along with data that purports to show the greater value of their services. If we cannot provide contrasting data, management is obliged to shift resources from “we” to “them.” This is happening more and more as business becomes increasingly competitive—and that is reasonable. Management is charged with making the best use of the resources provided by shareholder investments.
Descriptive Analytics
There is a tendency within management for oversimplification. At the C-level, the workforce is seen as a mass, a monolith, when in actuality it is made up of many subsets. Descriptive analytics allows us to drill down into the workforce to uncover subgroups around given sets of characteristics. This type of analytics reveals and describes relationships and differences between the groups. It can also show past and current behaviors or interests among the groups, but it is limited to exploration rather than prescription.
There are many ways to use descriptive models to understand the workforce in detail. Practically any group characteristics can be carved out for consideration; all that is required are the variables that make up the characteristics (age, education, family status, benefits selections, skills, interests, potential ratings, etc.). Basically, this is workforce segmentation, just as marketing does customer segmentation. Why do this? Obviously, the purpose is to improve the return on investment (ROI) of subsequent HR services. This is what it means to be a business partner.
As an example, in Chapter 4 we deal with capability planning, and we segment the workforce into four groups for investment purposes. These groups are:
1.Mission-critical—the small group that has the largest effect on performance and revenues
2.Differentiators—the group with unique skill sets that help to generate competitive advantage
3.Important—the operatives who keep the organization functioning day to day
4.Movable—those with capabilities that can be outsourced, retrained, transferred, or terminated
From this categorization, we can make cost-effective investment decisions regarding development, retention, and recognition. By this segmentation, the organization optimizes its resources that are committed to the workforce.
Prescriptive Analytics
This form of analysis relates what we know currently to what we want to know about the future. Whereas descriptive analytics reveals current data patterns, predictive analytics gives meaning to those patterns for the future. With practice, one can look at historical data and foretell, to some degree, the likelihood of a future occurrence. The key phrase is “to some degree.” If we believe we can assess and mitigate risks with estimates based on the past, we are on dangerous ground. In the interconnected, unpredictable, explosive global market, that is a most difficult, if not impossible, task. It is true that simple behaviors such as years of perfect past attendance probably predict near-perfect future attendance. However, complex behaviors such as leadership and engagement require some rigor in forecasting.
Predictive analytics expresses the future in terms of probabilities. It helps management make decisions that minimize risks and increase ROIs. No analytic application can predict the future with absolute certainty; but, in my experience, when properly applied it will substantially reduce variability. And as casinos know, winning is only a few percentage points different from losing.
Models are an example of a predictive application. When we build a success model based on traits, skills, and experiences, we increase the probability of selecting the right people to hire, train, and promote. For instance, I used the model of a field-engineering manager at a computer company to prioritize engineers for management training. We found that there were a few key unforeseen differences between effective and ineffective managers. For example, effective managers had taken nonengineering courses when they had an option; less effective managers stayed strictly within the engineering curriculum. From this and other discriminating data, we developed an algorithm that ranked all engineers. Those persons who most closely matched the model were the first to receive training. Thus, the trick is to let go of biases (i.e., one’s alma mater) in favor of behaviors that are better predictors of the performance required. There is no way other than through analytics that management can come to realize the complex drivers of success.
Causation
I have left the highest and most sophisticated level of human capital analysis until now. It is the combination of descriptive and prescriptive analytics that we call causal analysis. Professor Nick Bontis, at McMaster University in Hamilton, Ontario, Canada, is one of the earlier and most effective practitioners of human capital causal analysis, sometimes called causal modeling. With causal modeling we can find the hidden root cause of a problem or make a business proposition for a human capital investment.
In Bontis’s learning-impact model he points out that the success of training is not a function only of the courseware and trainer delivery. It is very much the result of the perceived value of the training by the trainee. One way to find and express training’s business value is to survey the trainees, asking them to score their perceived value on a scale of 1 to 100 percent; the courseware, from 1 to 5 points; and the delivery, 1 to 5 points. Then you put these factors into an equation such as the one below:

As any of the ratings change, the cumulative score changes as well.
The various uses for this simple causal model are broad indeed, including how people are chosen for the training, how the perceived value of the training changes from before to after, how the training department’s performance can be tracked, and on and on.
When causal analysis is combined with predictive management, the power is truly remarkable. Predictive management is the model and mind-set that was developed by the Predictive Initiative. (It is described in Chapter 10 of the second edition of my book The ROI of Human Capital).2 Bontis was a key contributor to the initiative and has published several examples of his work on causal modeling over the past decade. They can be seen on his Web site, www.bontis.com.
The Power of Analytics
High-risk decisions have to be made under circumstances that are seldom completely clear. For example, what actions are necessary to retain mission-critical talent under certain market conditions? Would we select incentive compensation, challenging assignments, work-life balance, or rapid promotions? What data do we have to support such a critical future decision? If the mission-critical population is large, geographically dispersed, and its technology or customers are changing, who can say which action will have the highest success rate? Certainly, relying on the past to predict the future is the summit of stupidity.
Knowledge is the base from which prediction emerges. Without knowledge there would be no tools and no structure. If knowledge is power, then foresight is the lever to take advantage of that knowledge. This is where predictive management enters.
Being able to foretell what is likely to happen with a high degree of probability depends on four things:
1.Comprehension of past and current events
2.Understanding not only trends but also the drivers behind them
3.Being able to see patterns of consistency as well as change
4.Having tools to describe the probability of something in the future
Human Resources Analytics
Until now the missing piece within business intelligence (BI) has been data on human capital and especially predictive human resources analytics (HRA). HRA is an outgrowth of and marriage between human resources metrics and general business analysis. HRA brings to life the logic within HCM:21. Previously, human resources metrics has been confined almost exclusively to labor issues as they relate to the business plan. HRA has opened the door to a much broader and more useful view of the metrics. It can draw on any or all BI data to both support the delivery of human resources services and influence the behavior of all levels of employees, up to and including executives. HRA turns human resources metrics toward the future. It takes past and current strategic and operational data and adds leading indicators. Data on retention, readiness, leadership, and engagement speak to what is likely to come tomorrow. Indeed, this is the newest lever in the business intelligence machine.
The Model for Predictive Management
Today, organizations are huge pools of objective data, as well as subjective knowledge, attitudes, and beliefs. Electronic and behavioral science technologies—the tools to manipulate and make sense of that data—are available to almost everyone at reasonable cost. The only questionable element is the will to take advantage of these great resources.
HCM:21 is the broad strategy that provides the framework for analyzing an organization’s data. It takes brainstorming lists, interview and survey data, and market research and organizes these elements around human, structural, and relational capital phenomena. By applying HRA tools, predictive management uncovers the connections and interdependencies among organizational activities. Study of the outcomes at the strategic, operational, and leading-indicator levels yields insights into the future. It tells not only what, how, and why something happened yesterday, but, most importantly, also what is the likelihood of something happening tomorrow. Figure 2.3 outlines the four phases of HCM:21 and the arrows indicate how predictive analytics link the phases.
Within any population there is a range of skill, knowledge, attitudes, values, and interests. Many people say they are interested in doing something, but only a relatively small number have the skill or drive to do it, with or without training. If you are truly interested in learning how to conduct human capital analytics, and you have the stamina to see it through, you will have a competitive advantage over 95 percent of the population.
Figure 2.3. The HCM:21®model.

Notes
1.Workforce Intelligence Reports, 2007–2008, Workforce Intelligence Institute, San Jose, California.
2.Jac Fitz-enz, The ROI of Human Capital (New York: AMACOM, 2000), 160–85.
WHY ANALYTICS IS IMPORTANT
The three essays that follow deal with why measurement is important, what strategic metrics are, and how to translate analytics into action.
MEASURING WHAT IS IMPORTANT
Luis Maria Cravino
“Everything that can be counted does not necessarily count and everything that counts cannot necessarily be counted.”
—ALBERT EINSTEIN
This is an opportunity to summarize my personal connection with the measurement approach of human capital management in the last twelve years. I hereby state certain contradictions, uncertainties, discordant perspectives, or just starting points to begin reflecting about assumptions that are automatically or mechanically applied and that, in many cases, cause serious problems. First, I deal with what is not working right in the field of measuring human capital management, which I have called “measuring system crises.” Then, I introduce my version of which indicators we should bear in mind and what constitutes what we could call “measuring what is important.”
The Crises in Measuring Systems
The current situation in human resources measurement is a series of crises.
The Excess Indicator Crisis
Research published in the magazine Psychological Review, quoted in the book The Knowing-Doing Gap by Jeffrey Pfeffer and Robert I. Sutton, states that human beings can generally manage seven things at the same time, plus or minus two. That seems reasonable.1
In my work as a consultant, many times I have come across performance management systems that aim at focusing people’s efforts by limiting the number of objectives that can be set per year. The usual number is five, although in certain cases I have seen seven or eight, at the most. The purpose is to prevent dispersion, keep people focused, and so on. However, I have seen (and I’m not exaggerating) management systems with more than 500 indicators to monitor aspects of human capital management, even in medium-size, not very sophisticated companies. Too many indicators? Certainly. All this measurement can only create more confusion. In addition, so much effort expended in measuring takes time and energy away from the management process itself.
For a long time I have tried to work out what the actual cause is for such confusion. This confusion might occur because many managers are obsessed with measuring everything, with knowing everything that is going on, and with imagining that if they have many numbers, everything will be under control. Also, many managers have a simple way of thinking, based on the fact that people do things with the idea that they are being measured for what they do. Although it is true that there is a certain relationship between measurement and behavior, this connection is not 100 percent linear and direct. But if we believe that we can assess behavior by means of measurement, there is a possibility of believing that “the more indicators, the more control.”
The Crisis in Understanding What Measurements and Parameters Mean
I have no doubt that measurement is an important task in managing any process or function. Measurement gives us information, which in many cases is crucial to solving problems, making effective decisions, improving results, and the like. But when I think in detail what measurement means in itself, I can end up with serious problems. This lack of detailed thought is probably, from my point of view, one of the main sources of wrong decisions in company management.
In many organizations, there is an assumption, a very deeply rooted one, that cost reduction is essentially good, or else that increasing productivity levels is essentially good. The problem is that these two assumptions are not always true in every case. For instance, let’s consider the number of people who work in the human capital management function in a certain company, and let’s relate that to the number of people who work in that company. Based on those two figures we can establish a classical productivity indicator:
![]()
At first, this indicator may imply that if we want to improve productivity, in terms of what a collaborator of the human capital management area can “address,” we should reduce the number of collaborators in the human capital management area. Simple—but it may be wrong.
Another aspect of this crisis occurs when we obsessively study comparative data, when sources of comparison are inappropriate or inconvenient, or when they are not correctly understood. Using such data is more harmful than good. For example, when we do benchmarking in human capital management, we need to think that the companies that provide information have unique characteristics. Their implicit uniqueness does not invalidate the comparison process, but we need to remember that every detail the companies provide for a benchmarking sample has a history behind it. That is why we should think of a parameter as a piece of overall information (although calculated with great effort and level of precision) that provides overall information to serve as a reference point, to begin a reflection process.
The Crisis of Extremes
Benchmarking to prevent the “self-centeredness disease” is well known. Self-centeredness is thinking that the world around you, or the company, is “more or less” the world you see. Over time I have observed, in both large and medium organizations, such dysfunctional behavior that comes from self-centeredness.
For example, some managers make decisions always based on the background they themselves have generated to make such decisions. Their written procedure manuals or their informal culture is their major source of information and consultation, so when a problem arises the question they ask is: Where inside is the solution to this problem? In many cases, internal growth started when the company was unable “to go beyond its boundaries” and keep within its life limits. Consequently, their view of the world comes down to the view of the world that their company has: that their colleagues are their co-workers (although they are thousands of miles away and speak different languages), that their trips abroad are intracooperative, and that their literature is the newsletters that the company itself publishes.
On the other hand, corporate life has expanded in recent decades, so if there still is an openly self-centered manager, he or she would be a living dinosaur. Yes, we can say that self-centered people, in their several categories, are dying off; replacing them are “externalists” or “extreme benchmarkers,” who overuse the external view. They are always asking, searching, or in other ways trying to get to know what others are doing.
Nobody questions the importance of knowing what happens outside, but such knowledge should be preceded by knowing what happens inside. Generally, benchmarking will not help resolve incorrectly formulated questions or questions that are misdirected. Externalism can harm human capital management as much as self-centeredness can. An appropriate balance between looking outside and knowing the inside seems to be the obvious solution to this crisis.
The Crisis of Putting Process Measurement Ahead of Results Measurement
Is it surprising that most indicators of human capital management are more closely related to processes than to results? Cost accounting quickly tells us how much has been spent on any item. After all, counting money is easier than measuring happiness. Counting hours is easier than analyzing competence. Counting days is easier than estimating potential. Also, most process measurements can be analyzed without exceeding the limits of the function itself.
In many organizations, the administrative cost of paying salaries is a clearer indicator than staff performance levels and how much the cost of salary administration affects the company’s overall profitability. As far as I know, the latter is only a few dollars per employee; however, how much does the level of staff performance affect the operative and financial results? Unquestionably, it is much more when that performance is functioning at a level it should be.
The reasoning seems obvious. If we analyze how much every measurement contributes, we could say that the former (knowing the administrative cost of paying salaries) is a measurement of little added value, but that the latter (measuring the staff performance) can provide valuable information with a very significant impact. The explanation for why the processes are measured more frequently than the results is probably accounting convenience. It is easier to measure and fewer people are bothered. For many managers, measuring processes makes them feel in control. In some extreme cases, they come to think that their work is about managing processes, forgetting that their function is to deliver results that lead to the accomplishment of higher results.
The Crisis in Thinking That Everything Measured Equals Everything Existing and That Everything That Is Measured Can Be Managed
Obviously, this is not a crisis exclusive to human capital management. On the contrary, it is an existential crisis when certain organizations reduce, sometimes grotesquely, their own nature to their own measurements.
It is sad, and even difficult, to understand that this assumption has spread to human capital management, where participants are supposed to be aware that a significant and relevant part of reality exists even when it cannot be measured, and that the most important things have value but not an estimated price or cost. Indeed, we must be aware that time and cost measurements can be objective, but that other measurements are subjective or relative, and that some factors simply are impossible to measure. For instance, staff satisfaction exists and it is crucial for performance, even if it is not measured. Likewise, I have also found that sometimes certain measurements are viewed as if they were objective, when actually they are not.
This crisis can be resolved with an extra dash of common sense. Measurement is important for those situations where measurement is essential for management. For that reason, though, we should not assume that every management skill can be measured in objective terms. Management can be based on certain hypotheses, and it is not necessary to prove them all in order to know if management has been successful. For example, a handshake and a smile from a collaborator tell more about his or her “engagement” than an opinion poll. A sincere pat on the shoulder can do more to motivate than a bonus calculated with a rigorous algorithm. With interpersonal relationships, common sense is a key we should not forget.
The Crisis of Rearview-Mirror Vision
The most traditional and mostly noted crisis in control systems in the corporate field is what I term rearview-mirror vision. Most measurements are based on the past—an unchanged past. Information about the past is important as long as it helps us understand the present and enables us to make decisions about the future.
I have been in South Florida many times during the hurricane season. It is interesting to see forecasters showing a hurricane or storm path in three time dimensions—where it has been, where it is now, and where it will be. Of course, the first two are true and the latter is just a probability. The past is represented by a line that starts across the Atlantic Ocean from Africa, the midsection (the present) by a twirling storm icon, and the third (the future) by two or more lines that show the most likely paths. It is true that, in many cases, the hurricane does not respect the probable path signaled by forecasters and diverts in another direction, making a left or right turn unexpectedly.
In the measurement of human capital management, there are many more beginnings and middles, and probably infinitely more possible final paths. Trying to predict the future with certainty is always beyond our intellectual possibilities, even with wide and accurate measurements. Yet trying to predict the future and proactively attempting to make it favorable are two of the key elements of success in corporate activity.
Measuring What Is Important
Based on the crises mentioned previously, I provide a model for their solutions, founded on the following assumptions:
![]() That which is measured should possess obvious consistency. In other words, two or more people should be able to interpret the information provided by the measurement in the same way.
That which is measured should possess obvious consistency. In other words, two or more people should be able to interpret the information provided by the measurement in the same way.
![]() That which is measured should be important and should provide added value. For example, measuring staff satisfaction is important and valuable, as there is huge empiric demonstration that this aspect significantly affects results.
That which is measured should be important and should provide added value. For example, measuring staff satisfaction is important and valuable, as there is huge empiric demonstration that this aspect significantly affects results.
![]() The factors measured should be limited to a few, which allows focusing, and should be associated with the company’s strategic concerns. The model is based on the results and consequences of human capital management—that is, a company may invest in staff selection (process), and the consequence or result is how many people were hired. Most indicators to measure human capital management (standardized indicators) are based on processes.
The factors measured should be limited to a few, which allows focusing, and should be associated with the company’s strategic concerns. The model is based on the results and consequences of human capital management—that is, a company may invest in staff selection (process), and the consequence or result is how many people were hired. Most indicators to measure human capital management (standardized indicators) are based on processes.
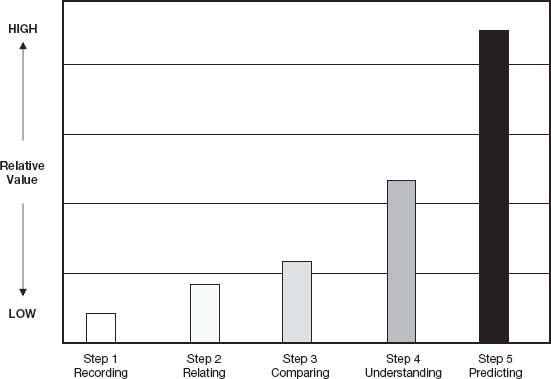
A value chain, shown in Figure 2.4, summarizes the model. This value chain has three stages. The basement, or “Past,” represents the consequences of previous actions or decisions like the financial information you can get from a balance sheet. The ground floor, or “Present,” represents the current reality. The first floor, or “Future,” represents the levers that build the next times. The figure illustrates what the important fields are and where the impact of human capital management on organizations can be observed. It also makes obvious the need to use very flexible criteria to develop the measurement indicators.
Figure 2.4. Value chain for HCM model.
First, there is a number and cost field. The company’s staff and working costs are figures that generally refer to the past. Human resources management generates the impacts that can be seen in this field. This chart’s specificity depends on the nature of the business, on the strategic concerns, or on the form that added value takes. But it is clear that people responsible for the area cannot ignore the variables, such as how many people work in the company or how much was paid for salaries.
The second is the performance field. It shows what is currently being achieved and how it is being achieved. Most human resources management actions and initiatives should be aimed at improving performance. What is human capital or human resources management for? It is to help working people accomplish what they set out to do. That is why performance management is by far the most important operating tool and assessment is just part of that. Human capital management works, or is supposed to work, so that every person, every group, and the organization as a whole can reach the objectives that have been set. Here, management by competence—generic as well as technical—is a crucial aspect, as it is practically impossible to meet objectives without the knowledge, abilities, attitudes, and values required for successful performance.
The third element, which also belongs to the present, is the satisfaction field. Here, I disclose my personal obsession—that everybody should have “a happy job.” Without a doubt, there is an extraordinary relationship between performance and satisfaction, a virtuous circle. People who work well are satisfied, and when they are satisfied, they work better. To achieve this satisfaction, people’s “engagement,” or commitment, should be developed. An important aspect of this is the boss-collaborator relationship, measured with 360-degree feedback—it is engagement’s alpha and omega. Also, among the best evidence of satisfaction is retention rate, which is calculated at 100 percent minus the voluntary turnover index.
But there is a fourth field, which is related to the future, and I call this the sustainability field. Here, I use two elements and two concepts for its analysis. The elements are talent and organizational knowledge; the analysis concepts are flow and stock. For example, the water in a container is stock, but if the glass is cracked and there is leakage, or if it is placed under the tap and is filling up, that is flow. What mainly assesses a company’s money flow and stock in the future is the stock and flow of talent and knowledge. For instance, the percentage of key positions that have an identified successor, or the percentage of promotions granted, is directly related to the positive flow and accrual of talent. Similarly, the number of patents, technical documents, papers, databases, or manuals produced by a company increases its intellectual capital.
The model takes us to the next point. In the past months, I have discussed with hundreds of colleagues and students from our profession the following questions:
1.What is the important thing that human resources management should do?
2.What should we measure?
The second question is the natural consequence of the first, so we begin by defining what to do, and then we measure. Figure 2.5 shows a command board developed from the result-field model shown in Figure 2.4.
For that reason, I suggest a debate. In the past months, I have discussed with hundreds of colleagues and students from our profession two critical questions: (1) What is the important thing that human resources management should do? (2) What should we measure? The second answer is the result of the first question. Therefore, we should define what to do, and then we should measure. However, the conclusions arrived at after these meetings have been really surprising to me, since many people admit to not having ever asked themselves the first question, despite their having tried to answer the second question.
Figure 2.5. Command board for result-field model.

This change of natural order, whereby we place the “what to do” ahead of the “what to measure,” may be one of the reasons human resources management has been so slow, uncertain, and sinuous about changing its destiny from a support area to a strategic partner. I encourage this debate; human capital management is the approach that deals with “making people work better to achieve their objectives, be happier, and provide a better future for all of us.”
Note
1.G. A. Miller, “The Magical Number Seven, Plus or Minus Two: Some Limits on Our Capacity for Processing Information,” Psychological Review, 63 (1956), 81–97, quoting Jeffrey Pfeffer and Robert I. Sutton, The Knowing-Doing Gap (Buenos Aires: Editorial Granica, 2005), 192.
STRATEGIC HUMAN CAPITAL MEASURES: USING LEADING HCM TO IMPLEMENT STRATEGY
Stephen Gates and Pascal Langevin
While the field of human capital measurement has been gaining ground over the past twenty years, it still remains largely disconnected from business strategy. In a recent report published by The Conference Board, only 12 percent of respondents reported making significant use of leading human capital measures (HCMs) to meet their strategic targets or key performance indicators (KPIs).1 Nevertheless, 84 percent of the same respondents predicted that their use of HCMs to meet these goals will increase over the next three years. In this essay, we explore how HR professionals can align leading HCMs with strategy and use these measurement tools to enhance the implementation of human capital strategy through greater accountability and communication. We first provide results of a study showing that performance is indeed related to the implementation of HCMs, but also that few companies have yet to reach an advanced stage. We address the role that the HR function plays in the definition and implementation of strategy and HCMs. We then explore the leading HCMs that may predict the achievement of strategic goals. Finally, we present results regarding how HCMs are reported in scorecards to increase managers’ information as well as accountability.
Implementation of HCMs and Performance
In many companies, benchmarking HR practices with rivals or “aspirational peers” has developed as a way of testing whether HR efforts and HCMs add value. Becker and Huselid warn, however, that a company should track HR practices against its own strategy: “Strategies are successful when they create a unique value proposition… . [T]hat means the measure of HR’s strategic performance must be focused internally on those unique, strategically relevant contributions—not externally on non-strategic measures such as cost per hire or benefits as a percent of revenue.”2
Since human capital plays a fundamental role in the creation of value, the use of relevant HCMs can contribute greatly to achieving the company’s strategic goals. First, managers can use HCMs to identify and pay attention to key competencies, which can thus be used to build a competitive advantage. Second, HCMs can improve the evaluation of strategy execution. Instead of using lagging indicators that measure performance after the fact, practitioners have developed approaches that aim at using leading indicators to measure drivers of performance.
Satisfactory performance at the human capital level increases the predictability of a good performance at the company level. Strategy maps in their various forms, such as the Balanced Scorecard with its “learning and growth” quadrant,3 and Skandia’s Value Scheme4 and its formulation into the Navigator, are striking examples of models where HCMs are considered to contribute in a fundamental way to achieving strategic objectives. We can expect that the more advanced a company is in the implementation of HCMs, the higher its performance will be.
Yet, implementing HCMs is a difficult process that can stretch out over a long period, especially if the resources allocated to the project are inadequate and subject to cuts. Typically, the first step is to determine an accurate headcount, which can be a formidable task in itself, especially in large, global companies. Next, tracking the cost of HR activities with HCM efficiency measures of time and cost—more operational metrics— comes into play. Later, monitoring investments in workforce capability, with HCMs measuring effectiveness and impact, are created and implemented. Accordingly, Boudreau and Ramstad5 propose three categories of HCMs corresponding to the stage of advancement of HCM implementation: (1) efficiency measures that focus on cost and report the financial efficiency of human resources operations; (2) effectiveness measures that reflect the effectiveness of human resources programs on the competence, motivation, and attitude of the workforce; and (3) impact indicators that measure the impact of human resources programs and processes on business performance.
To analyze the predictability of HCM implementation on performance, we designed a study that relies on a quantitative analysis of survey questionnaires collected from 104 HR executives, as well as on a qualitative investigation using six interviews. Our results show that performance is positively associated with the stage of implementation of HCMs.6 The development of HCM systems—as well as, in a general way, the implementation of performance measurement systems—enables an organization to measure and, it is hoped, to better manage its performance.
Quotes from our interviews confirm that measuring human capital helps decision making. For example:
![]() “The new director intends to use human capital metrics in a dashboard to open each monthly meeting with the HR managers in the businesses. This dashboard will be used as a diagnostic tool to help information-driven decision making.”
“The new director intends to use human capital metrics in a dashboard to open each monthly meeting with the HR managers in the businesses. This dashboard will be used as a diagnostic tool to help information-driven decision making.”
![]() “Once they were in managers’ performance scorecard, human capital metrics entered into their line of sight and results improved.”
“Once they were in managers’ performance scorecard, human capital metrics entered into their line of sight and results improved.”
However, most companies in our survey have not reached an advanced stage of HCM implementation. Table 2.1 indicates that only 43 percent of the sample respondents have reached the last two stages, where the greater benefits of linking HCMs to strategy could be realized.
In this sample, fewer than half of the respondent companies would even be able to align with strategy. Until companies achieve this last phase, the value of the HCM measurement effort is often unclear, which can slow progress even more. HCM implementation can also depend on HR managers’ involvement in developing the company’s strategy.
The Role and Perspective of the HR Function
HR professionals can enhance the role that the human resources function plays in strategy formulation and implementation. Our results show that the more HR managers participate in the definition of strategy, the more advanced the company is in the implementation of its HCMs.7 HR managers who participate in the development of strategy seem to be aware of the importance of using HCMs to align human resources with the strategy. Furthermore, our study shows that HR managers would like to develop HCMs that are consistent with strategy.8 In companies following a differentiation strategy, they are interested in HCMs measuring employees’ innovative capacities,9 whereas in cost-leader companies, HR managers prefer HCMs measuring employees’ ability to manage costs.10 This confirms the “fit” (or alignment) literature that maintains that performance measurement systems that are aligned with strategy can be extended more specifically to HCMs.
This result was confirmed in interviews. For example, one respondent stated:
Table 2.1. Stage of HCM implementation (% of respondents).
| HCM Implementations | Percentage Response |
| Our company does not measure human capital. | 98.0 |
| We are working on defining HC measures and beginning to collect data. | 27.7 |
| We have efficiency (time and cost) HC measures in place. | 27.7 |
| We have efficiency and effectiveness (ability, motivation, performance) HC measures in place. | 35.7 |
| We have efficiency, effectiveness, and impact (on business process and strategic outcome) HC measures in place. | 6.9 |
We are trying to develop a three-level human capital scorecard. The first level will consist of company-wide basic core key performance indicators for all [of] the workforce. The second level will be more strategic, linking human capital metrics to next year’s business units’ development plans. The third level will be a top-down human capital measurement effort focused on talent and performance management for a selected group of employees. So this requires that we develop a high degree of strategic alignment for the second and third level of human capital measures.
Thus, HR professionals can create or customize strategic HCMs and implement them within the company’s strategic performance measurement system to enhance performance. The more knowledge that HR professionals have about which human capital enablers help implement strategy, the more they can focus on customizing HCMs aligned with strategy.
However, Figure 2.6 indicates that only 22 percent of respondents claim that HR is a full partner in developing and implementing business strategy. Less than half (47 percent) claim that HR does more than simply help implement business strategy once it has been developed.
Figure 2.6. HR’s role in strategy formulation.
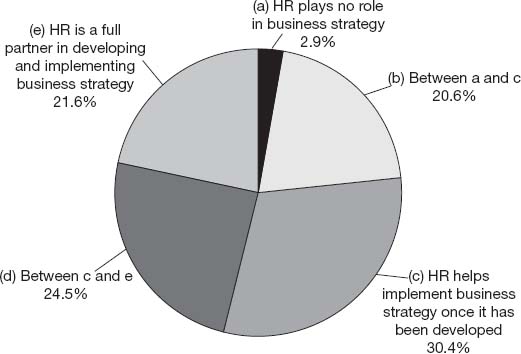
HR’s lack of involvement in formulating or actively implementing strategy could limit HR partners’ ability to understand their managers’ business KPIs, and to help them deliver these KPIs with the help of HCMs. It could also explain why so few companies do create HCMs to measure the capacity to innovate or to identify new business opportunities. In our sample, the low involvement of the HR function in the strategy formulation could explain the low stage of HCM implementation.
One solution can be found with Huselid, Becker, and Beatty,11 who advocate a new, supplementary scorecard for executives to manage and measure their workforce in conjunction with HR. They argue that a “workforce scorecard” should be the means to execute their people strategy, in addition to the overall balanced scorecard and the specific HR scorecard for the activities of the HR department. The authors encourage senior executives to take greater responsibility for setting measures and targets for people. In this way, HR’s lack of involvement in setting strategy would not hinder the execution of the company’s people strategy through selecting the best-aligned HCMs.
The Quest for Predictive HCMs
While human capital measurement could vary according to the company’s strategy, HR’s involvement in strategy formulation, and the stage of HCM implementation, the search for predictive metrics continues. The performance indicators that human resources people monitor and the tasks they undertake are directly linked to financial performance. Success in recruitment increases productivity through increasing revenue per person or decreasing cost per unit produced. Success in training has similar effects, provided the lessons are remembered and used. But as with other human capital metrics, establishing direct causal relationships and translating these truisms into a system for controlling action is tricky. Identifying which create leverage is trickier still.
But how can a company determine which HCMs are the most effective leading indicators? By comparing the rankings for the most frequently used measures to the measures that survey participants found to be leading metrics, we can make a number of observations (see Table 2.2).
First, the percentages indicate that there is a low level of consensus on what constitutes a leading HCM. Only a third of respondents consider that leadership or readiness measures are leading. Second, of the four main leading HCMs, only one—employee engagement—is frequently used (more than 50 percent of cases). The results raise two questions:
Table 2.2. Leading HCM and frequency of use.
| Human Capital Measures (HCMs) | Leading HCM* |
Frequency of use† |
| Employee engagement | 69.2% | 77.9% |
| Leadership | 38.5 | 47.1 |
| Employee commitment | 36.5 | 40.4 |
| Readiness level | 33.7 | 44.2 |
| Turnover (voluntary) | 28.8 | 94.2 |
| Employee satisfaction | 28.8 | 64.4 |
| Competence level | 27.9 | 36.5 |
| Workforce diversity | 24.0 | 78.8 |
| Training | 21.2 | 57.7 |
| Promotion rate | 17.3 | 44.2 |
| Executive stability (or churn) | 17.3 | 31.7 |
| Workforce age | 16.3 | 65.4 |
| Health and safety | 14.4 | 48.1 |
| Span of control | 8.7 | 39.4 |
| Depletion cost | 5.8 | 14.4 |
| Other | 4.8 | 8.7 |
*= % of HR professionals naming these HCMs as being leading indicators; † = % of HR professionals naming these HCMs as being in use in their company.
1.Why is there so little agreement on what is considered to be a leading HCM?
2.Why are the most frequently used HCMs lagging, not leading, measures?
One would expect that for HCMs to align with strategic KPIs and help managers achieve them, leading, rather than lagging, HCMs would be more appropriate. However, other studies have shown that some HCMs seemed to be adequate in many situations. For example, Dr. Jac Fitz-enz’s work with companies since the 1980s suggests that eight predictive HCMs have wide validity in a large number of circumstances:12
1. Professional/Managerial Ratio: The number of professionals and managers expressed as a percentage of the total number of full-time equivalents in the workforce. In general, the higher the ratio, the greater the prospect for future growth and profitability.
2. Readiness Ratio: The percentage of key jobs with at least one person ready to take over. This measure suggests the resilience of the organization against disruption. The closer to 1, the better.
3. Commitment Ratio: The percentage of staff committed to the company’s vision. Measured by employee survey, the higher, the better.
4. Leadership Rating: Performance rating of current leaders, as measured by the staff, again through a survey.
5. Climate-Culture Rating: The percentage of staff giving top scores about whether the company is a good place to work. Measured by survey, this is predictive of the employee retention rates, and therefore retained knowledge.
6, Training Rating: Scores from current programs. But what’s important is developing skills to get the job done now, not necessarily those needed for prospective future requirements. Having skills you don’t use and don’t need subtracts from corporate value, rather than adding to it.
7. Accession Ratio: The ratio of new and replacement hires as the percentage of total employment. In most organizations a high number indicates hidden costs and delays, which damage productivity.
8. Depletion Ratio: Annual percentage of top talent lost. This is a negative indicator. The higher the number, the worse your future prospects.
Other experts suggest additional formulations of predictive HCMs. Although Michael Bokina, former manager at Saratoga/PwC, stressed that every organization is different, making it difficult to offer “typical” leading indicators, generic correlation analysis shows that three HCMs are leading indicators.13
1.Executive Stability Ratio and Separation Rate: Corporations with executives having more than three years’ executive experience lowers voluntary turnover.
2.Management Ratio and Promotion Rate: The number of employees that each manager supports impacts the number of promotions. Span of control is important in developing employees professionally: A manager supervising fewer employees has a lower number of promotions available.
3.Training Investment Factor and Promotion Rate: More dollars allocated to training will increase professional employee development.
Mark Graham Brown suggests using as a starting point a simple human capital index made up of four submetrics: number of years in the business or field, level in the company by job grade or organizational chart, performance rating, and number of positions or assignments held. The index would then assign a percentage to each of these. Brown also suggests a more complex index involving one component in which experience and performance measures are grouped together and a second that groups competencies and skills.14
As a major company ERP software provider, SAP reported on its own effort, starting in 2003, to link human capital practices with performance improvements.15 When the business was struggling a few years earlier, management also became dissatisfied with its efforts to track investments in human capital. It knew these investments were growing in importance, but the systems it had in place to measure them weren’t adequate. Working with Accenture, it developed a model involving measuring thirteen human capital processes that fed into seven HC capabilities. One year into its turnaround efforts it found that many initiatives seemed to be paying off in relatively high process and capability scores.
Nevertheless, many HCMs get reported only at quite a high level of aggregation, which may be sufficient for understanding what’s happening in functions with a large number of largely undifferentiated workers. But Huselid and colleagues make the point that “companies simply can’t afford to have ‘A players’ in all positions. Rather, businesses need to adopt a portfolio approach to workforce management, systematically identifying their strategically important A positions, supporting B positions, and surplus C positions, then focusing disproportionate resources on making sure A players hold A positions.”16 The risk associated with having the wrong person in a job is high, as is the opportunity cost of keeping an A person in a C job. The implication is that human capital measurement needs to be quite granular: “We all know that effective business strategy requires differentiating a firm’s products and services in ways that create value for customers. Accomplishing this requires a differentiated work-force strategy, as well.”17
Moreover, even when well focused on a differentiated workforce, leading HCMs can backfire if not properly integrated with the complex system of the organization. John Boudreau and Peter Ramstad say that attempts to link HR practices to strategic ones are often crude and not really integrated.18 An organization might have the strategic goal of increasing sales of solutions, and then set an HR measure to increase bonuses for solutions-selling activities. But without business integration to ensure that products themselves integrate into solutions or that the right talent pools are in place, the bonuses won’t work.
Increasing Accountability and Communication with HCMs
Use of HCMs in Scorecards
In order to learn more about how widespread these techniques are for increasing HCM accountability, our questionnaire asked about the use of HCMs in scorecards and in managers’ bonus plans.
In Figure 2.7, 69 percent of our survey respondents acknowledged that HCMs are being used in a scorecard. Logically, this would increase the chance for a regular review of key HCM metrics. However, 69 percent of respondents also rated the effectiveness of the HCMs in their scorecard as moderate or less than moderate. Clearly, even when HCMs are found in a regular reporting tool such as a scorecard, this does not necessarily guarantee that they are successfully applied.
One method to sharpen managers’ focus on HCM metrics and targets is to embed the metrics in bonus plans. While they might not agree with the construction of the metrics or the measures as targets, managers will become more aware of the company’s people goals. Survey data also suggest that putting people measures in bonus plans correlates with successful links between business strategies and certain people measures (turnover, leadership, and health and safety).19 In our study, 56.7 percent of respondent firms reward managers based on people measures; 47.8 percent of respondents also reported that HCMs receive over 15 percent weighting in bonus plans. At this level of weighting, managers have a strong interest in taking HCMs and people activities more seriously.
Nevertheless, when asked if the HCMs are aligned with company strategy, 63.8 percent admit that they are less than moderately or only moderately aligned in bonus plans. This lack of alignment does not bode well for the role of HCMs in helping managers achieve their strategic business goals or KPIs.
HCMs as Communication Tools
Human capital measures are communication tools that can convey important information to HR and business leaders. Figure 2.8 shows that 78 percent of respondents to our survey indicated that their companies release their HCM results to senior leaders on a quarterly basis, perhaps reflecting a desire to align the perspectives of HR professionals with those of business managers, who also report on a quarterly schedule. But it should also be noted that 52 percent of participating companies present HCM results on a monthly basis, allowing the measures to be of greater help in identifying where corrective action is needed at an earlier stage.
Figure 2.7. Use and effectiveness of HCMs in a scorecard.
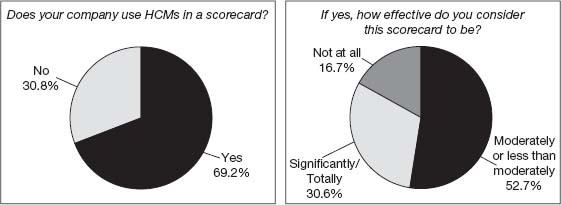
Figure 2.8. Frequency of reporting HCMs to top management.

Not only does the timing of the reporting vary from company to company, there are wide differences in the number of measures presented to top management: 23 percent of companies report one to three HCMs; 34 percent report four to six HCMs; 10 percent report seven to nine HCMs; and 33 percent report ten or more. The majority of respondent companies offer between four and ten HCMs, reflecting the belief of performance management experts that managers may have difficulty focusing on more than seven measures at a time.20
The number of HCMs may also be influenced by the fact that the distribution of people metrics reports in surveyed companies is limited primarily to top management. That is, 43 percent of respondents distribute HCMs to selected business managers, while only 19 percent of firms circulate HCM results to all business managers. One HR professional spoke from experience in saying that when the people measures spread good news, then the report is widely distributed; if they do not reflect a positive picture, then circulation is limited. She explained that broad distribution of results without a clear understanding of what the people measures mean and how they are linked to business strategy could lead to misinterpretation. While this may be true, the relatively small distribution of results also means that the findings are seldom broken down to the appropriate level for action planning.21 A potential solution for both problems would be to provide both HR generalists and managers with systematic training in the use and interpretation of people measures.
Making HCMs Deliver on the Promise
Developing a strategic human capital orientation and applying human capital metrics to implement it remain high on the list of HR directors’ priorities in many companies. While human capital strategy should derive from the company’s overall strategy, which by definition should be unique and inimitable, many HCMs are standardized and often benchmarked against competitors. Nevertheless, our results demonstrate that HR managers do align their interests in choosing and/or creating leading HCMs with their companies’ strategy.
While there was little consensus about which HCMs are leading, employee engagement seems to be one likely candidate for most survey participants. Experts are proposing a number of creative HCMs that could fit company strategy. Moreover, HR professionals are experimenting with leading HCMs that are applied to specific elements of the work-force—notably, those identified as strategic talent groups.
Accountability for human capital measurement could be enhanced by first convincing business managers that HCMs will help them to manage their workforce better, not just to manage HR activities better. To equip managers with the necessary knowledge to use HCMs, HR should also invest in training not only HR partners but also the business managers themselves. Training could show managers how human capital targets link to their strategic plan KPIs, and help them meet the HC targets set in their bonus plans.
Even when they are not used to set targets in bonus plans, HCMs can improve communication about the impact of human capital activities for workforce performance and results. The frequency of reporting HCMs could be greater and the breadth of distribution of HCM reporting could be widened. If monthly HCM reporting were done throughout the management ranks, HCMs could play a more important role as leading indicators of human capital performance and so allow managers to take more timely corrective actions.
Notes
1.Measuring More Than Efficiency: The New Role of Human Capital Metrics, R-1356-04, p. 7. The authors appreciate the contribution of The Conference Board, a not-for-profit organization that works as a global, independent membership organization in the public interest, with offices in New York, Brussels, Hong Kong, and Beijing. It conducts research, convenes conferences, makes forecasts, assesses trends, publishes information and analyses, and brings executives together to learn from one another.
2.B. Becker and M. Huselid, “Measuring HR? Benchmarking Is Not the Answer,” HR Magazine, December (2003), 57–61.
3.R. S. Kaplan and D. P. Norton, The Balanced Scorecard: Translating Strategy into Action (Boston: Harvard Business School Press, 1996).
4.L. Edvinsson, “Developing Intellectual Capital at Skandia,” Long Range Planning 30, no. 3 (1997), 366–73.
5.J. Boudreau and P. Ramstad, “Strategic HRM Measurement in the 21st Century: From Justifying HR to Strategic Talent Leadership,” in HRM in the 21st Century, eds. M. Goldsmith, R. Gandossy, and M. Efron (New York: John Wiley, 2003), 79–90.
6.R2 = 0.280, p < 0.01. We used Boudreau and Ramstad’s categories to measure HCM stage of implementation. We measured performance with an eight-item question designed by T. C. Huang, “The Effects of Linkage Between Business and Human Resource Management Strategies,” Personnel Review 30, no. 2 (2001), 132–51.
7.R2 = 0.251, p < 0.01. We measured HR involvement in the definition of strategy by using the items given in Figure 2.5.
8.We measured strategy by asking respondents to indicate the percentage of their sales accounted for by products representing use of a low-cost or differentiation strategy, the total amounting to 100 percent. We also measured their interest in HCMs by designing a question listing eight categories of HCMs reflecting innovation or cost reduction. Two types of HCMs were derived: One factor measured employees’ work efficiency and cost-consciousness (efficiency indicators), whereas the second factor measured employees’ entrepreneurial and innovative capabilities (innovation indicators). We then analyzed the association between these two variables.
9.R2 = 0.297, p < 0.01.
10.R2 = −0.193, p < 0.05.
11.M. Huselid, B. Becker, and R. Beatty, The Workforce Scorecard, Managing Human Capital to Execute Strategy (Boston: Harvard Business School Press, 2005).
12.J. Fitz-Enz, Webcast presentation to The Conference Board’s working group on human capital measurement, May 4, 2006, New York.
13.M. Bokina, presentation to The Conference Board’s working group on human capital measurement, Washington, D.C., June 6, 2006.
14.M. G. Brown, “Human Capital’s Measure for Measure,” Journal for Quality and Participation 22, no. 5 (September–October 1999), 28–31.
15.S. Cantrell, J. M. Benton, T. Laudal, and R. J. Thomas, “Measuring the Value of Human Capital Investments: The SAP Case,” Strategy & Leadership 34, no. 2 (2006), 45.
16.M. Huselid, R. W. Beatty, and B. E. Becker, “ ‘A Players’ or ‘A Positions’? The Strategic Logic of Workforce Management,” Harvard Business Review 83, no. 12 (December 2005), 110–17.
17.Ibid., 117.
18.J. Boudreau and P. M. Ramstad, “Strategic HRM Measurement in the 21st Century: From Justifying HR to Strategic Talent Leadership,” a Cornell University working paper, 2002.
19.Linking People Measures to Strategy: From Top Management Support to Line Management Buy-in, The Conference Board, 1342-03-RR, p. 26.
20.A. Davila, R. Kaplan, and R. Simons, Performance Measurement and Control Systems for Implementing Strategy (Upper Saddle River, N.J.: Prentice Hall, 2000), 239–40.
21.A. Yeung and B. Berman, “Adding Value Through Human Resources: Reorienting Human Resources Measurement to Drive Business Performance,” Human Resource Management 36, no. 3 (Fall 1997), 334.
FROM BUSINESS ANALYTICS TO RATIONAL ACTION
Kirk Smith
Now that organizations have fine-tuned human performance, supply chain, operations, processes, cycle time, and other targeted areas, how can they continue to improve performance? In their book Competing on Analytics, Thomas Davenport and Jeanne Harris identify business analytics as the key to gaining competitive advantage. According to the authors, it is this “extensive use of data, statistical and quantitative analysis, explanatory and predictive models, and fact-based management” that can drive the decisions and actions that will yield performance improvements and opportunities for innovation. When metrics were introduced to human resources in 1978, the purpose was to give HR the tools to understand and communicate the value of its services. Today, it is no longer a choice. This essay describes how and why analytics must become part of HR’s tool kit.
Getting Started
Beginning with the business intelligence and decision support systems movements of the 1960s, and the ubiquitous enterprise-wide technology systems such as Enterprise Resource Planning (ERP) and Customer Relations Management (CRM) of recent decades, the data for business analytics have become available. While many companies, overwhelmed by all these data, cry “data, data everywhere but not a drop to drink,” others are what Davenport and Harris call “analytic competitors”—the companies with the skills and support needed to use data effectively. But both groups struggle with the same endgame, or how to use the data to make good business decisions that lead to effective action and provide positive business results.
The gap between data and action is bridged by good decision making. The business analytics literature uses the term decision making a lot—I mean, a heck of a lot. But decision making is usually portrayed as a given. It assumes that people know how to make good, rational decisions as long as they have data and the chops to take action. It assumes that if you can find hidden gems in data, the decisions are automatically made. Maybe they are; but are they good, rational decisions that have a positive impact on business results? The literature tells us what needs to be done, but not how to do it. It’s like the first step of the old Steve Martin comedy routine on how to get rich: “Okay, first you get a million dollars, then you …”
One roadblock people often encounter with decision making is knowing where to start. I recommend starting with a decision statement—a short statement describing what you need to decide or recommend. This helps keep your attention focused on the purpose of the decision. An example of a decision statement is: “Select high potentials to be included in the leadership development program.” Keeping the statement visible to all involved in the decision helps keep everyone focused on what you are trying to accomplish. You may have to refer back to it often. Simply agreeing on a decision statement will often bring a group much closer to making a decision.
The next step is to develop objectives. These are the criteria that will influence the choice and help you define success. The reason you do this is to help evaluate your alternatives fairly. Without these objectives, how will you know when the goal—your decision—is met? Another common mistake in decision making is to look at your alternatives before developing your objectives, allowing pet alternatives to influence your objectives and bias your decision process. For example, in the leadership development program stated previously, the objectives taken from correlative data of existing successful leaders could be as follows:
![]() At least two years of service
At least two years of service
![]() Managed at least one high-profile project
Managed at least one high-profile project
![]() Team lead or higher
Team lead or higher
![]() At least some graduate-level education
At least some graduate-level education
![]() Good communication skills as assessed by the manager
Good communication skills as assessed by the manager
Next, you classify the objectives into “musts” and “wants” to help determine the role that these objectives will play in the decision; that way you can be clear about what is mandatory and what is desired. To qualify as a “must,” the objective has to have a yes answer to these three questions:
1.Is it mandatory?
2.Is it measurable (with a limit)?
3.Is it realistic?
Once you have determined your “musts,” everything else is a “want.” It should be noted that a “must” is not necessarily your most important objective—just a minimum standard for screening. The biggest mistake people make here is having too many “musts.” If you follow the above criteria, there should be very few. For our example, let’s say that “At least two years of service” is our only “must.” This process sometimes requires patience on the part of the decision-making group. Next, you weigh the “wants” by assigning relative values to them to show how much each “want” will influence the choice. The most important “wants” get a value of 10. These are the benchmarks. All others are given weights based on their relative importance to the benchmarks. There can be more than one benchmark; leading this discussion in the group can sometimes require a modicum of facilitation skills and patience.
After you have classified your objectives into “musts” and “wants,” now and only now do you generate alternatives by identifying or creating possible choices to expand the number of choices and increase the chances of picking winners. Continuing with our example, querying your data warehouse with your criteria should give you alternatives.
But suppose you generate twenty alternatives and have only ten slots available? The next step is to screen the alternatives through the “musts” to determine if any alternatives meet the “musts.” This eliminates choices that do not meet minimum requirements. Gather and record factual data, determine if alternatives are a “go” or “no go,” and eliminate any “no go” alternatives. With the remaining alternatives, compare them against the “wants,” evaluating their relative importance to determine which alternatives create the most benefit. You do this by:
![]() Recording factual, accurate supporting data
Recording factual, accurate supporting data
![]() Scoring the best performer for each objective with a 10
Scoring the best performer for each objective with a 10
![]() Comparing the relative performance of other alternatives (0–10)
Comparing the relative performance of other alternatives (0–10)
![]() Multiplying the objective weight by the performance score
Multiplying the objective weight by the performance score
![]() Totaling the weighted scores
Totaling the weighted scores
In our example, you would consider the top ten scores, but you have not made your decision yet. You have to consider risks. In the risk-management step, you try to identify potential adverse consequences by identifying future threats for the best performers. This helps you understand the risk of choosing the alternative. In our example, you would take the top ten performing alternatives and ask questions such as:
![]() What could go wrong, short and long term, if this alternative were chosen?
What could go wrong, short and long term, if this alternative were chosen?
![]() What disadvantages are associated with this alternative?
What disadvantages are associated with this alternative?
![]() Where might information about this alternative be invalid or wrong?
Where might information about this alternative be invalid or wrong?
![]() What are the implications?
What are the implications?
An example of a risk in our example might be “If we choose John, he would have to be taken off the ABC Project and that would jeopardize its success.” For each risk, ask if you are willing to accept the risk to gain the benefits of the choice. If yes, pick it. If no, repeat for the next alternative until you have your ten candidates for the program.
The Rewards of a Decision-Making Process
Having a common, fact-based decision-making process requires commitment, critical thinking, and rational thought. It is not easy to implement in an organization that is used to shooting from the hip, going with the gut, or winging it, but the benefits are plentiful. It consistently brings logic and clarity to the way decisions are made. When a structured, evidence-based decision process is used, the following are likely to occur:
![]() Focus is maintained.
Focus is maintained.
![]() Objectives are identified and weighted.
Objectives are identified and weighted.
![]() Facts and not politics play a larger role.
Facts and not politics play a larger role.
![]() Facts are more fully shared.
Facts are more fully shared.
![]() Biases are minimized.
Biases are minimized.
![]() Common language facilitates communication.
Common language facilitates communication.
![]() Less information is overlooked.
Less information is overlooked.
![]() Experience and judgment are used more effectively.
Experience and judgment are used more effectively.
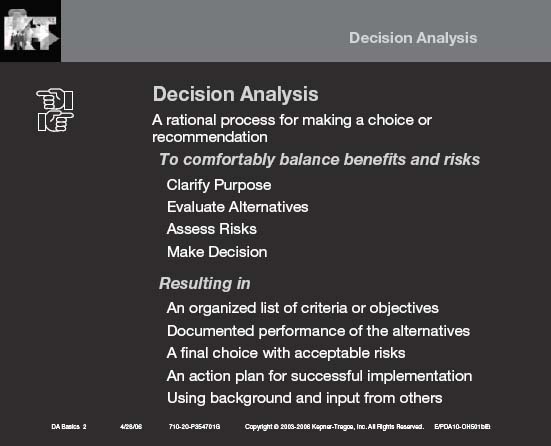
The point is that sound, systematic decision making complements the skilled use of business analytics, creating a powerful performance-improvement tool. Figure 2.9 summarizes the decision analysis process.
For those organizations interested in reaping the benefits of a fact-based decision culture, a good measurement system is a necessity. You should have a good measurement system, but you need to be careful that you are not just setting up a measurement bureaucracy. It is tempting to fall into the trap of measuring what is easy or just measuring for its own sake—but neither of those does any good. To be able to make sound decisions, you need to measure the right things. Start at the top. What metrics does the organization value most? Is it net profit, EBITDA, operating profit, cash flow? Find out and make sure what you measure is linked to the most important organizational measures. What are the drivers in human capital management? Whatever you choose, it should support the organization being managed as an adaptive system.
An Example
This powerful decision-making tool can be demonstrated in the way we at Kepner-Tregoe (KT) use a specialized human capital analytics system to collect, store, retrieve, and report on the effectiveness of our skills-transfer programs. The data mart helps us uncover gaps, patterns, and trends that allow us to make process-improvement decisions for our clients that are based on relevant data. The system uses a participant survey to gather data in seven categories—instructor, environment, courseware, learning, job impact, business results, and ROI. Sixty days later, a follow-up survey is sent to true-up the job impact and business results data and to gather information from participants about the barriers to and enablers for using their new skills. We then analyze these data to find correlations, patterns, and gaps. From here, we can make decisions and take actions that remove barriers, encourage enabling factors, improve processes, and optimize the effectiveness of future interventions.
Figure 2.9. The decision analysis process.
For example, in a recent study, we sent a customized follow-up survey to determine the overall effectiveness of a large-scale KT training program and the key variables that contributed to its effectiveness. The highest correlation with improved productivity was with participants who had met with their managers before and immediately after the training to discuss expectations and intended actions for using new skills. While this result is hardly a surprise, a significant portion of the managers did not bother to conduct this key step. There was also a strong association between confidence in using the new skills and awareness of when to use them—that is, the triggers or signals to perform. Similarly, those with the most confidence in using their skills tended to demonstrate the greatest performance improvement.
We worked with the client to use these and other data to make informed decisions for future training. More sophisticated statistical analyses are planned to determine causal links between variables that will help us build predictive models and optimum profiles of participants, as well as discover leading indicators to predict trends.
Business analytics and decision analysis are powerful tools in the performance-improvement toolbox. With annual spending on learning and development alone estimated to be as high as $100 billion in the United States, human capital analytics, as a subset of business analytics, and systematic decision making have great potential for uncovering untapped opportunities for improvements in human performance through good decision making about future required resources, plans, policies, schedules, or structures.