]>
CHAPTER 6
CONTENTS
Chapter Objectives
Audiences: Consumers and Customers, Viewers, Listeners, Readers, Users, Players, Friends, and Followers
Research and Content
A Day in the Life of Debbie Carter
Identifying Market Segments
Summary
What’s Ahead
Case Study 6.1 Audiences and Programming
References
Then head of Programming for nBc television Brandon tartikoff … was commenting on the take-over of cBs by lawrence tisch. tisch was a consummate businessman and was going to make cBs “mean and lean” (his actual words at a press conference). He owned and ran many very, very successful companies in tobacco, insurance, and hotels, none of which were remotely like tV or radio.… Brandon respectfully said something to the effect that tisch, although a bril-liant and successful businessman, had never had to bring in a hit television show. nothing about that had to do with business. It was all about everything but business. and without hit shows you’re out of business. I thought it was a brilliant line from a brilliant guy. long story short, they dumped cBs nine years later to westinghouse … still dead last and the company decimated. I’m sure the shareholders were thrilled with his stewardship.
Pat Holiday1
Chapter Objectives
The objective of this chapter is to provide you with information about:
- Audiences: Consumers and customers, viewers, listeners, readers, users, players, friends, and followers
- Research and content
- Identifying market segments
- Media consumers: Demographic segmentation
- Media consumers: Psychographic (lifestyle) segmentation
- Media consumers: Behavioral segmentation
- Measuring audiences
- Measuring audiences: Television
- DMAs, sweeps, and Nielsen ratings
- Local people meters replace people meters
- Measuring audiences: Radio
- Measuring audiences: Print media
- Measuring audiences: Internet
- Measuring audiences: Videogames and other emerging advertising channels
- Media consumers and media companies
AUDIENCES: CONSUMERS AND CUSTOMERS, VIEWERS, LISTENERS, READERS, USERS, PLAYERS, FRIENDS, AND FOLLOWERS
Media content can be fun, entertaining, moving, fascinating, compelling, informative - even life-changing. We are all very familiar with the media expe-rience as consumers. But media professionals think about media consumers in ways that are different from how consumers see themselves, just as the doctors think about patients differently from the way patients think about themselves.
The first two chapters of this book talked about the nature of the media and the people and companies that create content. In this chapter, the focus changes from creators, marketers, and distributors of content to receivers of content - as seen by media professionals. It looks at the nature of the content people receive, and the methods producers and marketers use to match receivers with content products. Providing content to people who would like to receive it is as much art as science - but sustained success does require that the science be every bit as sophisticated as the art.
All commercial ventures involve transactions between buyers and sellers or, as is the case in the media industry, sources and receivers. Media creators, dis-tributors, and sellers must begin with the same approach as companies in any industry do - with their customers. The kinds of questions they might ask are: Who are they and where are they? How much money and time can they spend? What do they like, dislike, care about, ignore? What are their characteristics and media preferences and habits?
Both questions and answers may change for different media industry segments. After all, even the names they have for the media consumers are different. Fans that go to see the latest Kate Winslet blockbuster are movie-goers or theater-goers (reflecting the fact that they go out of their homes to attend an event); however, they may also be termed viewers or audiences. Mass media consumers are TV viewers, radio listeners, print readers, cable subscribers, and, when they purchase DVDs, buyers. For interactive media, the Internet has users, videogames have players, and some online games have subscribers. Facebook connections are friends and Twitter receivers are followers.
They all have in common that they are media consumers. Creatives are think-ing up ideas to attract and delight them. Marketers are making plans to reach them. And many consumers are eagerly awaiting the next big blockbuster.
RESEARCH AND CONTENT
Media companies have several purposes for collecting information about media consumers. Before they produce or acquire content, they need to make sure there is a market for it. They need to convince advertisers to pay to reach them. And, if they want to market content directly to consumers, such as motion pictures, DVDs, magazines, newspapers, and so forth, they need to understand what kind of appeals will induce people to pay to consume it.
This chapter begins with a consideration of what the research tells media marketers about the size and characteristics of potential and actual consumers for content of all types - movies, programs, publications, songs, software, and games. Estimating the demand for a product is the job of market research ; gath-ering information about how to communicate about the product to motivate consumers to buy it is called marketing research. In some segments of the con-tent industries, such as radio and television, these types of research are called audience research. In print media, they are referred to as readership studies.
The purpose of all these types of research is to inform marketers, guide them as to how they should proceed, and help them reduce risk. Risk means that there is uncertainty about an outcome - it could be good; it could be bad. The movie could be a blockbuster; the movie could be a flop. The TV show could be a hit; the show could get cancelled after two episodes. The Web site could have 8 million unique visitors; the Web site could have 54 unique visitors, half of them company employees. By learning as much as possible in advance about the potential demand for the product, the characteristics and preferences of the potential consumers, and their likely reactions to the content, managers reduce the risks inherent in producing and marketing content products.
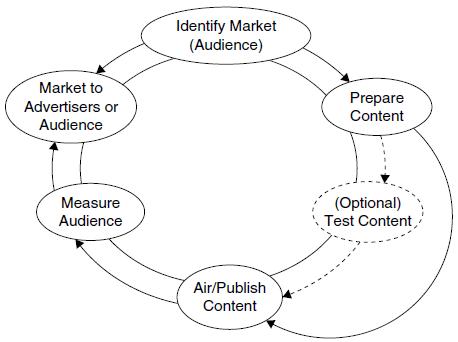
In theory, there is a regular cycle of audience research and content develop- ment and marketing, as shown in Figure 6-1.
However, in practice, the picture is somewhat different. Marketing consumers to advertisers requires detailed information, because advertisers demand it. As a result, media companies draw upon sophisticated research procedures to capture such data. Yet compared to the rich array of consumer research to attract advertis-ing dollars, as well as to support new product development within most indus-tries, content-creating companies have historically been much less creative about their research, sometimes appearing even reluctant to gather information.
Some media sectors do use research. In particular, videogame companies conduct both formal and informal research before releasing games. Television executives and producers carry out some research before they put series on the air, although it is hardly extensive. For example, producers and networks conduct concept test-ing to see whether the idea of the show appeals to the potential audience. They also carry out pilot testing of a finished pilot, using the results to reshoot footage, change the ending, recast a role, or make other alterations. This type of research is sometimes called formative evaluation.
Companies that make radio programs, publish books, magazines, research reports and write papers, and design and publish Web sites conduct less research than television program creators. They certainly do considerably less research as companies in other industries, such as packaged goods companies. A review of consumer research in the project approval (green-lighting) stage of motion pic-ture production by Eliashberg et al. (2005) notes that: “While maximizing the green-lighting success rate … is extremely challenging, it is staggering to discover how little ’science’ usually goes into the process.”2
To the extent that they collect data at all, there are two ways to get data. Primary research occurs when the organization gathers its own data. Secondary research is the use of data collected by others. In the media industries, market research typically begins with the analysis of data collected via secondary research - census, government-funded economic reports, and commercial data sources and market reports, such as credit card data or viewership data.
There are also two kinds of data and analytical methods: quantitative and qualitative. Quantitative research methods collect numerical data. It examines characteristics or behaviors that can be observed and counted - quantified. For example, the number of people who play World of Warcraft online next Saturday afternoon between 3:30 p.m. and 5:30 p.m. (U.S. Eastern Standard Time) can be observed and counted by the game Web site’s administrators. When there are large numbers of observations, it is not necessary to analyze all of them. Researchers can observe some of them: a sample. If the sample is rep-resentative of the whole, they can use statistical analysis to estimate the entire population or universe of potential observations.
Qualitative research collects information about a value or attribute that may not be observable by the researcher. An example is that a researcher can ask a group of people who watch House what they like about the show. She cannot observe their “liking.” But she can ask them about it - what characteristics they like, how much they like them, when they like them, and so forth. She may even be able to tally the responses - quantify them - but that number will never be as impor-tant as the “qualities,” the lead actors, the humor, Dr. House’s snarky dialog, the medical animations, and so forth. Most likely, the research report will be a verbal summary of the session or interviews, with direct quotes highlighted to provide insight into the thoughts, beliefs, feelings, and attitudes of the respondents.
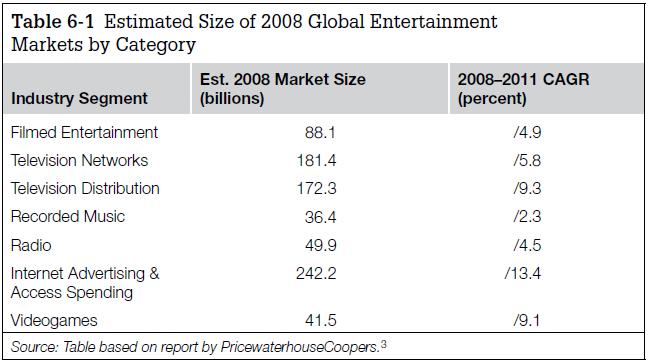
For most media content, if the information from secondary research suggests that there is a large enough market for a company to make the product and distribute it profitably, then the organization may go forward with that prod-uct. In the creative industries, there are established, known markets for con-tent products. For example, in Chapter 1, the global market for entertainment markets, reported by PricewaterhouseCoopers as shown in Table 6-1, provides estimates that companies can use as a starting point to forecast the size of a potential market for a specific content product:
A DAY IN THE LIFE OF DEBBIE CARTER
Debbie Carter, Vice President/Director of Sales, Petry Media
I am a VP, Director of Sales, and the thing I can always count on in advertising sales is constant change. Every day will be different from the previous. I have been in the business for 25 years. I started as a Sales Assistant and learned the ropes by taking messages on pink message pads and sending orders on a Twix machine that was similar to a typewriter but would produce a ticker tape of information; you would then dial up the station to send your order. There were no computers, no faxes, and no voicemail. Today, most transactions from order-ing to invoicing are electronic.
The electronic advertising age is still evolving. We now have many more tools available with computers in the digital age. I work for a national television representative firm. My clients are television stations. Back in the 1980s, most TV sta-tions were individually or family owned and operated. Now most TV stations are owned by a station group like Gannett or Sunbelt Communications, who own anywhere between 5 and 50 stations. Some groups will also own other media such as radio, newspaper, or digital.
My company is hired by TV stations to sell the commercial time they have available within their programming lineup. Some of the time is sold by the station’s local sales team call-ing on smaller individually owned businesses within their market. My company sells to national advertisers, which include big names such as Wal-Mart, Wells Fargo bank, and McDonald’s - large businesses that have multiple locations in many cities. These clients hire an advertising agency to plan, produce, and place their advertising dollars.
My day starts early, as I live on the West Coast and I have client stations in the Eastern and Central time zones, 2-3 hours ahead of Los Angeles. I begin by checking my email and reading the daily trades to make sure I am up on the latest information regarding the economy, updates on national advertisers and news to check what the competi-tion is up to. As the director of sales, I am responsible for the national sales of our station clients. I am always plan-ning the next quarter’s sales and activity as well as moni-toring current sales and revenue. My company has sales offices across the country that call on national advertising agencies in their region. I make sure all aspects of the busi-ness are covered from sales to planning to collections and troubleshooting. A typical day usually includes all of these duties.
Station sales managers will often schedule to come in and make calls to their most important agencies and buy-ers. A call sheet is made up with agency appointments prior to the stations arrival. Sometimes these calls are for a meal or event before or after hours. It is the sales rep’s responsibility to accompany the client and make sure that they meet with key contacts and have a smooth and pro-ductive visit.
Organization and the ability to prioritize are key to success in advertising. I have approximately 25 TV sta-tions across the country that can have several requests or needs. You think you have your day planned out until one phone call comes in with an urgent request that can change your entire day. You must have the ability to refo-cus and redirect yourself to the most pressing matter at hand. On a typical day, I will interact with TV stations’ national sales managers, general managers, company sales reps, other directors of sales, as well as the presi-dent/CEO of my company. The most important tool I have is communication. It is critical to keep the flow of infor-mation moving to the stations, salespeople, agencies, and core management.
The most challenging issues I face often stem from lack of communication - a communication breakdown. People do their best work when they are working in partnership. Com-munication can help spark sharing of best practices, brain-storming creative ideas, or just keeping everyone focused on goal. When the lines of communication break down, people become frustrated and the doors open for misinformation and misunderstandings.
The best part about being in this industry is the oppor-tunity to work and get along with many types of people. I have met people from all over the country and all walks of life. Getting to know and understand people and work together toward a common goal is very rewarding. There’s a lot of hard work along the way, but it’s well worth the payoff.

IDENTIFYING MARKET SEGMENTS
Media companies use information they gather about the people who consume their products for many purposes: to forecast the appeal of a specific product to a particular consumer segment, launch new products, and refine and improve existing ones. For companies that own the means to exhibit, display, or present content to consumers (networks, stations, theaters, newspapers and magazines, popular Web sites and games, etc.), the most important reason to learn about consumers is to segment them into groups with specific characteristics to sell them to advertisers.
Consider this question: What is the product of television? Is it programs? Yes, television companies, particularly networks, do offer program products. They market collections of programs to other stations and overseas markets, a pro-cess called syndication. They repackage all the episodes of programs that aired in a season, put them on a DVD, and rent or sell the DVD through retail out-lets and video rental stores like Blockbuster. They stream programs and parts of programs to enhance their web offerings, build traffic on a Web site, or sell them as downloads.
However, these revenue opportunities are not the media industry’s only product: The other product is the audience. Specifically, it is people’s atten-tion that allows marketers to reach consumers with their messages, sometimes called the eyeballs. Consumers are a critical source of income to companies that bring media to audiences. Consumer segments are most often described with demographic information , such as geography, age, and sex. An example of a demographic segment is women 18-49 in the Dallas-Ft. Worth market or children 3-7 in the New York market.
Other consumer segment characteristics include psychographics and lifestyle (interests, opinions, attitudes, or values) and behaviors, such as voting, media preferences and habits, and so forth. Marketers rely on different combinations
Variable: Something that varies or changes. For example, a person can be male or female, live in an urban, suburban, or rural location, or earn between nothing and millions, even billions, of dollars per year.
universe: A specified population of consumers. A universe could be all consumers, all women, all teenagers, all suburbanites - the universe depends on the group (or population) under consideration.
Sample: A subset of a population or universe.
Consumer segment: A group of present or potential customers with some common charac-teristic that is relevant in explaining (and predicting) their response to a supplier’s marketing stimuli.
of variables, depending on what they are selling. They don’t just sell products; some sell ideas or candidates. For these messages, the advertising effort may need to know other characteristics of the consumer. An effort to recruit for an anti-property tax campaign might seek registered voters, who vote or lean Republican, making more than $60,000, suburban, married with children, own their home, have strong religious beliefs, and support small government. In this example:
- Demographic: $60,000+, own home, suburban, married, have children
- Psychographic (lifestyle): Lean Republican, strong religious beliefs, support small government
- Behavior: Registered voter, vote Republican Media companies try to attract consumer segments that have certain character- istics. Classic criteria for desirable segments are:
- Identifiable: It is possible to identify potential customers.
- Accessible: It is possible to communicate with people in the segment and to deliver content products to them.
- Substantial: The segment is large enough to justify a marketing effort that will result in a profit or other desirable outcome.
- Unique wants and/or needs: The marketer needs to be able to match a specific segment to their products or mix of products.
- Durable: The segment needs to exist for a sufficient time to communi-cate with them and to deliver products. This is a particularly important consideration for content companies, whose hit products may last for only a short time.
Media Consumers: Demographic Segmentation
Demographic variables of interest to most buyers of consumer segments include such characteristics as age, sex, ethnicity and nationality, marital status, location of residence, number of adults and children in the household, socioeconomic level, household income, employment status, occupation, education level, and so forth.4 Virtually all marketers and communicators want to gather and analyze demographic information about actual and potential customers, because it is a crucial indicator of the kinds of products they need and want. Toy companies want to reach children. Food companies seek women. Beer makers target men. Many pharmaceutical concerns market to older consumers.
A key demographic variable that marketers usually want to know is geography: Where is the consumer? Traditionally, the answer to this question was a physical place - a city, a state, a region, a country, even a continent. Some industry sectors use the term geographies and others use territories to describe location-based markets; the two terms mean the same thing. Broadcasters use the term designatedmarket area (DMA) , used by Nielsen to define a local television market. Some of the geographic considerations that can affect the kinds of content products consumers might buy are whether they live in a rural or metropolitan area, the climate of the region, and the availability of high-speed Internet access.
However, the question “Where are they?” takes on a different meaning in the Internet age. Today, the answer may be a virtual location: Which media plat-form does the consumer respond to and use to communicate? Which Web sites do they visit? Which social networks do they frequent? Which blogs do they read? How much information do they seek with their mobile phone? In short, in some new media marketing efforts, physical geography takes second place to characteristics of media use. Brick-and-mortar retail establishments still want to reach customers who live in a particular place, even a particu-lar neighborhood. But companies like Amazon don’t really care where people live and work, and it makes little sense for them to try to reach consumers by geography; rather, they want to communicate with people who buy products online, no matter where they actually live.
Media Consumers: Psychographic (Lifestyle) Segmentation
Demographic data tells a marketer a great deal - but not everything. Two men may each live in Akron, Ohio; be 33 years old; be married with three children; earn $48,000 a year; drive Ford Explorers; and work in the computer industry. But these shared commonalities do not mean that they engage in the same activities, have the same interests, opinions, attitudes, or values. As a result, they probably consume very different content products.
Demographic variables describe external factors; psychographic variables describe internal factors. Psychographic information includes such items as interests, opinions, attitudes, values, and lifestyle - these are the criteria used to define con-sumer segments based on psychographic (or lifestyle) characteristics. A complete psychographic profile may also describe in detail the person or the segment’s religious, political, and other personal preferences. A communicator is likely to choose a specific set of variables to narrow the universe of receivers down to the best potential prospect for the message. Demographic and psychographic vari-ables work together to give a more complete picture of consumer segments.
Media Consumers: Behavioral Segmentation
If demographics describe what people are and psychographics describe what they believe, behavioral variables describe what they actually do. How do they vote? How often do they actually attend church? What organizations have they joined, and so forth? Most important to marketers are the answers to questions like how often they shop, where they shop, and how much they spend. Media companies that market content want to know: What media do they use? What kind of content have they purchased in the past? What information do they need to know and where do the currently get it? How do they want to pay? As life circumstances change, such as a generation of college students graduat-ing and entering the workforce, marrying, having children, raising children, and leaving the workforce in retirement, how do their information needs and wants change? Most communicators want the target of their messages to do something, to take an action. Behavioral information offers a special value about a segment because the data offers insight into the likelihood that a message can convince receivers to act in the desired way. In short, it is directly linked to the goals of the communicator, whether encouraging a purchase, a vote, or some other action.
Measuring Audiences
Every content-based business needs to know how many people are listening, watching or reading their product and as much as possible about their charac-teristics. Each industry segment measures some specific aspects of behavior, yet they share some common methods as well. They all use technology to measure behavior - what do consumers actually do? They use surveys to ask individu-als about themselves, their media habits, and their opinions about genres and specific content products. And they use focus groups and depth interviews to probe the deepest thoughts and feelings of a small number of consumers to understand more about why consumers act, think, and feel the way they do.5
At the same time, each industry segment has specific questions they want to ask that apply to their content products. They may also differ in the access they have to their customers. For example, Internet content providers can measure clicks and the amount of time they spend on a site precisely, down to the nanosec-ond. Using Portable People Meters™ (PPMs™) and personal diaries, as shown in Figure 6-2 , radio broadcasters can measure listening behavior continuously. However, the Arbitron service that collects listening data reports listenership in 15-minute increments. Game companies, newspapers and magazines, and cable companies can measure subscriptions in addition to media use; free over-the-air TV companies and open Web sites can measure only usage.
When media students listen to the radio or watch a TV show, they should take special note of the advertisers they hear or see. They will notice distinct types of advertisers that appear on the media they consume, even the Web sites they frequent. They will quickly figure out who advertisers think is listening or watching. As a result, those who have become aware of such segmentation are unlikely to ever listen to a radio station, watch TV, watch movie trailers before a movie at the theater, or play a videogame without recognizing how advertisers are targeting them !

Measuring Audiences: Television
In the television industry, the results of measurements of the number of people watching a specific program on a specific channel, at a specific time, are provided by the ratings. They also provide basic demographic data about the audience that is watching the program, including geography, sex, and age. Thus, the overall rating might be 9.4, the rating for men 18-49 might be 14.2, and for women 18-49, 3.2 - this result could apply to a hockey game, for instance.
More detailed information about viewers, such as lifestyle, purchasing behavior, and media use, may be provided by the company that gathers ratings data for the television industry, the A. C. Nielsen Company. Data about viewers may also come from a third-party research firm, hired by the program producers, TV net-work, or advertisers who want to understand more about the programming envi-ronment where they are placing commercials for their products. For example, if a program has a violent or sexual content, the advertiser might want to make sure that it does not affect public perception of the brand in a negative way.
Knowing about potential and actual audiences is crucial to broadcasters. Thus, companies specializing in providing such information to radio and then televi-sion networks and stations emerged early in the history of the industries. These research firms are sometimes criticized for not being accurate. However, they have existed for nearly a century, constantly refining the methods by which media companies can determine the level of popularity of a product.
Each industry has its own most widely used research firms and metrics , just as Nielsen serves the television industry. For newspapers, ABC, the Audit Bureau of Circulation, has measured readership and circulation numbers for newspa-pers since 1914. Radio companies turn to Arbitron, founded in 1949, to iden-tify listenership levels. Metrics are the specific measurements that are reported, such as viewership metrics (TV ratings), listenership metrics (radio ratings), readership metrics (number of subscribers and newsstand sales), and Internet metrics (unique site visitors, click stream patterns, conversion of click-throughs to sales), and so forth.
Both Nielsen and Arbitron are now in the process of developing new methods to measure demographic data for Web site traffic, mobile phone applications and out-of-home media habits. As technology advances, these long-standing companies are faced with the challenge of how to accurately identify these new behaviors and habits of consumers. An A. C. Nielsen subsidiary, Nielsen/ AdRelevance, is a leading data provider about advertising spending on new media. Another A. C. Nielsen company, Claritas, performs market segmentation , separating consumers into different groups based on demographic, psycho-graphic, or behavioral characteristics. Claritas also uses these characteristics to predict how the people in a particular segment might behave in the future, a field of study called data or predictive analytics.
Sweeps, DMAs, and Nielsen ratings
Before examining the details of obtaining audience data for television, it is important to understand some of the basic terminology. It is difficult to over-estimate the importance of measuring viewers for the television industry. The industry business model, income, and ability to make a profit depend on con-fidence in the measurement of viewers. Now this measurement takes place daily, but in the early days of television when there were no people meters, it was only feasible to measure quarterly four times a year, in February, May, July, and November, the sweeps. The following sections describe some of the key terms used in the TV industry to describe the way the industry learns about its viewers.
Measurement Terms
- Sweeps (sometimes called Ratings Months): Four times a year, in February,* May, July, and November, Nielsen measures the television station audience in each DMA to determine the number of viewers by demographic categories. Sweeps begin on a Thursday and end on a Wednesday, a tradition begun many years ago by NBC. The ratings and share metrics reported by Nielsen are a report card of sorts, where television stations are graded on pure audience numbers.
- DMA (Designated Market Area): A geographic area, comprised of one or more counties, defined by Nielsen as a television market. Each year, Nielsen ranks each of the 210 DMAs by size. For example, New York City geographically reaches 7,433,820 TV households and is ranked as DMA #1, as it has the most in the United States. These rankings are reviewed yearly and based on changes in population can either move up, drop down, or simply stay the same.
For example, when New Orleans was devastated by Hurricane Katrina, the population dropped drastically and along with that change in population, so went the DMA ranking. For the 2008-2009 television season, New Orleans was ranked as DMA #53 with 602,740 households (HH). Before August 2005, there were over 672,000 TV HH and it was ranked #43. In fact, the devastation to that area resulted in Nielsen suspending ratings research for over a full year, until February 2007. This suspension of measurement had never taken place before in the history of the Nielsen Company.
- Daypart: The broadcast day is divided into dayparts to help program-mers plan programs that people will want to watch at a particular time and to set prices for advertising. For example, few people want to watch Desperate Housewives at 7:30 a.m. or a morning talk show at 10:00 p.m. TV dayparts are: Early morning: 5:00a.m-9:00a.m Daytime: 9:00am-3:00pm Early fringe: 3:00pm-5:00pm Early news: 5:00pm-7:00pm Prime access: 7:00pm-8:00pm Prime: 8:00pm-11:00pm (M-Sat), 7:00pm-11:00pm (Sunday) Late news: 11:00pm-11:30pm Late fringe: 11:30pm-2:00am Overnight: 2:00am-5:00am
- Panels: Refers to the group of individuals who comprise those participating in the Nielsen ratings.
- Diaries: A paper booklet that is completed by those in the panel to represent the viewing habits by each person in the household.
- Set Meters: Devices that are connected to a participating Nielsen household and that capture the channel(s) being viewed.
- People Meters: A box that is hooked up to each TV set and is accompanied by a remote control unit. Each member of the family is assigned a personal viewing button, which is matched to that person’s age and sex. Whenever the TV is turned on, a light flashes on the meter, reminding viewers to press their assigned button.
- Local People Meters (LPM): A new type of People Meter is in the process of being rolled out. The LPM offers several improvements over the older People Meter technology: (1) it measures continuously, not just during sweeps periods; (2) it captures data from individual viewers in the home by giving each person a code to punch in when watching TV.
- Portable People Meter: Carried by radio listeners, Arbitron gives these meters to people in their sample to measure their listenership when they are on the go because so much of radio listening occurs out of the home.
The Metrics (Results of the Measurement)
- TV HH (Television Households): The number of households with television sets within a given DMA. When calculating ratings, this number is often referred to as the television viewing universe.
- HUT (Houses/Homes Using Television): HUT levels can change throughout the day and typically reach their peak during prime time.
- PUT (Persons Using Television): >Whereas HUT levels measure homes, PUT levels calculate the total number of persons viewing television with their sets turned on.
- Rating Point: The percent of the universe of households or persons viewing a program during the average minute. For example, Days of Our Lives earns a 5.0 HH rating point. That means that 5 percent of all television households in that DMA were watching to see if Sami Brady was up to her old tricks.
- Share: The percent of TV sets in use (or persons viewing) tuned to a program. This differs from rating as that number is calculated on a fixed number of TV households. As an example, Deal or No Deal earns a 20 share. That means that 20 percent of all TV households with their television set turned on were watching Howie Mandell open the next case.
- Impression: An instance of a consumer’s attention to an advertiser’s message.
- Cost-per-thousand (CPM): Advertisers pay an amount per one thousand television viewers or radio listeners. The M in CPM stands for the French word mille , which means thousand in that language.
The Pain of Precision as Local People Meters Replace People Meters
The traditional People Meter didn’t so much measure people as it did sets. Placed on the back of the set, it measured the channel to which the set was tuned. For a number of years, it has been attached to a telephone line, so the meter could automatically dial up a remote computer and download its mea-surements. From that data, local stations who paid for the service received the overnights the next morning. In order to collect information about people, Nielsen relied on diaries , filled out by a member of the household appointed to track who watched what and when. Naturally, there was limited participation, flawed record-keeping, and heavy reliance on (perhaps) unreliable memory.
Local People Meters(LPM) make more precise measurements, because they really do measure people. The residents of a household are each given a code that they input when they watch TV. Nielsen has already gathered information about each person, so given the code, the ratings service can match the tuned in TV chan-nel with demographic characteristics of the individual watching. In addition, without the imposition of writing diaries, using LPMs enables Nielsen to meter a larger number of households. This larger sample means that the statistics the company reports are more accurate and reliable.
Starting in 2004, Nielsen began rolling LPMs in the top TV markets, beginning with Boston, New York, Los Angeles, Chicago, and San Francisco. By the end of 2009, the top 25 TV markets had LPMs, accounting for nearly 50 percent of the U.S. television viewing audience. The original plan called for a continued rollout through 2011, putting LPMs in the top 56 TV markets.
However, in 2008, Nielsen announced that it would reconsider the rollout schedule after placing LPMs in the top 25 television markets:
we all face a very challenging economic climate. our clients have made it clear that we need to work closely with them to establish the right pacing of lPM rollouts, determine the right business model in light of current market conditions, and identify the most appropriate People Meter technology for these mid-size markets. as 2009 progresses and the economic condition becomes clearer, we will be better positioned, along with our clients, to adjust our moving forward plans.6
The introduction of LPMs has proved to be quite controversial. Although the more accurate measurements have generally increased size of the audience, it also redistributes a substantial amount of viewing away from broadcast channels and toward cable channels. The large change in ratings has nega-tively affected broadcasters, substantially reducing the amount they are able to charge advertisers. In Miami, the local Fox affiliate WSVN-TV is suing Nielsen, claiming that inaccurate data costs the station $12 million a year in lost rev-enue.7 By contrast, cable companies are elated with the increased viewing of cable channels the new devices report.
From the Desk of Lisa Poe-Howfield, General Manager, KVBC-TV, Channel 3, Las Vegas
Leading up to the ratings months, the promotions and news departments are busy at work analyzing the competition, their previous ratings to search for success stories, and previous failed attempts to garner audience. Larger stations may have a full-time research analyst who specializes in reviewing and analyz-ing the measurement results to provide direction for the station to be more successful in attracting as many viewers as possible.
TV and radio stations live (and die) by the ratings. A good rating means receiv-ing higher advertising rates to bring in more revenues to the company. They guide the development of content during sweeps and beyond. The news divi-sion will present ideas for sweep pieces that are targeted at raising viewership among favorable demographic audience segments - those likely to generate the most advertising revenues.

Once stories are approved, producers write rough scripts, photographers shoot the footage, editors edit the pieces, and the on-air talent presents the story as you see it on television. The stories are strategically placed in newscasts that will have the potential to be the most successful. In the meantime, the pro-motions division will create teasers and promotional spots to air in specific programs that are most likely to drive eyeballs to a specific newscast. These promotional spots need to be creative and clever, but representative of the final product. (There is no worse backlash from the public if a TV station overhypes a story, but does not deliver.) It is a very fine line, as the goal is to create a need to watch a story.
Over the course of these four weeks, larger TV stations appoint a ratings team , composed of the top executives, such as the general manager, sales manager, news director, and research analyst, who will meet regularly to see how the game plan is working. Monitoring of ratings and shares can occur daily for those cities which are metered markets. In the larger cities, Nielsen connects People Meters to participating families, which are able to read every channel that is tuned in to a TV set.
The data from the meter is fed to Nielsen Media Research in Florida from 50 markets each night and transmitted back to the stations by the next morning. Considering that the broadcast day ends at 4:59 a.m. and starts at 5:00 a.m., it is very impressive that these numbers can be relayed so quickly. The metered numbers are broken out in 15-minute intervals, and, if needed, Nielsen can provide special reports that show minute-to-minute viewing habits.
Most People Meters only provide household data, although some meters allow individual household members to enter a code to indicate who is watching. For the most part, in order to determine the demographic characteristics of viewers, Nielsen collects diaries from a select number of households that pro-vide data about all the programs people in the home have watched during one week. These diaries are mailed to a new panel of homes each week, and over the course of a year, the company analyzes about 2 million diaries.8
In smaller markets, viewers do not have set meters attached to their TV sets, so stations may have to wait as long as a month to determine whether they did well, until all the numbers have been received and calculated. In the larger markets with people meters, the diaries serve as part of an equation to deter-mine the viewing habits of several demographic groups. Typically, age and sex define these groups, such as females 18-49 and males 18-49.
Usually within a month after the sweeps period, TV stations receive the much-anticipated ratings book. (Yes, they still send hard copies by snail mail.) Many stations also receive the electronic feed of the data and begin to decipher the numbers as soon as they are available.
If a station earns the #1 ratings in households for their evening newscast, the pro-motions department will quickly put a promotional spot on the air to let viewers know. When a station did not earn the #1 spot, the research analyst will look for a way to put the station on top. For example, maybe the newscast was first in the category of females aged 18-34. That qualifies for a promotion, right?
This practice explains why many people are not sure who is really number one in news, because every news station begins running spots about winning. Usu-ally, the TV stations will provide the source of that message in the fine print of the spot, but in a 15-second or even a 30-second spot, most people are unable to read and comprehend the source data. It is also not unusual to see some TV stations run ads that they are #1 in a particular newscast without the source. When confronted on this matter, the promotions department can claim that they took a survey from their Web site that indicated they were first. That type of promotional strategy will drive many others in the business crazy, but it is difficult to stop.
After the ratings are completed, the fun is just beginning. The most recent rat-ings will now exercise a strong effect on the amount of money the station can charge advertisers to air a commercial on any program. The ratings are imported into a software system and the sales managers review them to see whether there is a need to raise or lower any advertising rates. The number of commercial spots, also called avails , available in a program will also influence the rate.
For example, if a program only has three avails (commercial spots), even though the rating is low, the station may be able to ask for a higher rate because there are so few spots. Advertising clutter is the reason - when there are many commercials in a row, viewers pay less attention to each one. So a commercial that runs in a program with fewer spots may actually perform better than one airing in a program accompanied by a large number of spots. Determining the correct rate that will make a program effective and attractive to advertisers is the job of the sales manager, and the task can be extremely difficult. In the end, the audience research is key to estimating how many households and persons are watching so that a television station can provide a proper rate and generate revenues needed.
It is clear that ratings are of paramount importance to the profitability of the station. However, programming managers, who determine the programs airing on the station, and the news staff more often look at shares. Shares tell them what percentage of the audience that was viewing at the time watched the show, as contrasted with ratings, which report the percentage of the audience that has a TV set in the home, on or off at the time. In other words, shares report how well a program did against the competition, and that measure means a lot to the people working day in and day out creating shows.
Advertising agencies and media buyers look at the same Nielsen data, but from a different perspective. They buy entire demographic groups that number in the thousands, even millions of individual consumers. They pay a dollar amount based on cost per thousand or CPM. They pay for consumers, but that’s not what advertisers really want - they want consumers’ attention to their mes-sages. In order to ensure they capture that attention, they run ads over some period of time, sometimes called a flight. The term agencies use to describe an instance of attention to their messages is impression. An agency might say: “Our CPM is $(cost) and we will get 12 million impressions over the entire six-week flight.”
Measuring Audiences: Radio According to Terry King9
There are more radio station frequencies, formats, and options for listeners than ever before in the history of the medium. Radio companies have con-glomerated and streamlined resources as they determined, often cyclically, if they were swallowing up radio stations or divesting them, spending freely or cutting back. As listeners tune into different stations, they encounter formats and musical tastes that did not exist 20 years ago. With many radio groups providing first and second HD radio frequencies and web-only radiocasts as well as on-demand radio podcasts, advertisers are targeting their core custom-ers like never before.
For example, suppose that an advertiser is trying to reach working moms because they are the most likely buyers of the company’s products. It would make sense to advertise during radio drive-time - morning drive and afternoon drive when these women are most likely on their way to and home from work. The advertiser could be a grocery chain or a food company marketing quick and easy meals, for example. Restaurants featuring lunch specials or happy hours might target people listening at work - a primetime segment of the radio day. An air conditioning repair company might run commercials or spots dur-ing afternoon drive in the summer in the Las Vegas desert, the hottest time of year, when a poor air conditioner is bringing attention to its weak performance and the need for repair, before the commercials even air. Advertisers want to get in the heads of the right people at the right time.
Arbitron is a media and marketing research firm that measures network and local-market radio audiences throughout the United States, both nationally and in local markets. The company uses a PPM, diaries, and other research techniques to collect data. The PPM measures what people are listening to by tracking audio that is picked up by the radio through embedded identification codes in the audio portion of the transmission. One valuable application is measuring radio listening when people are in their cars or out-of-home radio usage.
The use of ratings information about radio usage - how many listeners are listening to which stations - is of value to radio stations and groups to help them sell time to advertisers and other communicators. They put messages on the air to reach consumers to persuade them to buy products or take other desired actions. Ratings information is also valuable to advertisers, who can use the data for media plans to buy time on behalf of their clients. As with TV, radio shares of the audience report how well a given program performs, compared to other programs at the same time in the same market.
Radio advertisers also want information about consumers that goes beyond mere numbers, radio advertisers increasingly seek data that tells them some-thing more about listeners. Arbitron partners with the A. C. Nielsen Company in a venture called Scarborough Research that provides radio industry com-panies with qualitative data about listeners - psychographic and behavioral data. This information allows advertisers to go beyond mere demographics in targeting consumers for their messages.
Terry King, general sales manager for Clear Channel radio in San Diego, California, has worked in the radio industry since 1994. He created a list of terms for people who could not read through the legalese or “tech-ese” of the descriptions in an Arbitron book, some of which are available on their Web site at http://www.arbitron.com. He wrote simplified definitions because some of his clients had difficulty understanding the terms as explained in the book. And some terms such as cost per point (CPP) were not developed by Arbitron, but were nevertheless widely used in the industry. Terry’s more user-friendly version of the terms, affectionately referred to as the TK List , is a must-have for radio professionals.
RADIO RATINGS ACCORDING TO TERRY KING: THE TK LIST
Cume: The total number of people that listen to a station, in a particular daypart and demo [demographic].
Net reach: The total number of people that your client’s SCHEDULE will reach in that particular demo during that week or flight.
AQH rating: The # of people who listen to a station expressed as a PERCENTAGE of the population of that DEMO in the market. (Example: A 1.4 AQH [Average Quarter Hour] rating means that 1.4% of the market in that demo lis-tens sometime in that daypart that week.)
AQH persons: The AVERAGE # of persons that listen to a station for at least 5 minutes within that daypart during that week or flight. [Flight = a period of time during which an advertiser has purchased time to run messages; for example, a 6-week flight.]
AQH Share: The MARKET SHARE OF AUDIENCE within a daypart and demo that listens to THAT STATION during that time.
Exclusive Cume: The # of people who listen to only THAT station.
Cume Duplication: The percentage (or number) of people who listen to more than 1 station.
CPP: Buying term. A Cost Per Point represents the $ it costs to buy a GRP. Usually there is a goal for the market when an agency puts out an avail, rather than a goal for a particu-lar station. Also, it’s usually an arbitrary number determined by historical buying, the buying of a similar market size, or acquired from a “bible” of sorts that the agency used that gained ITS information from the same historical buying and the buying of similar market sizes.
GRP: (THIS ONE IS TRICKY. GRP is also not an Arbitron term - hence it’s not in any Arbitron book - but rather is a “buy-ing” term. Ad buyers pay a lot of attention to this, but many still don’t know exactly what it is.) A Gross Rating Point is quantified from the AQH Rating info above. The problem is that the AQH Rating is a percentage of a population, and a GRP figures ALL listeners into a particular daypart and demo. THAT means that 4 people that listen for different 15-minute periods in an hour are looked at as the same as ONE person listening for an hour. So reach AND TSL are figured into this. (Besides, if a GRP is a gross rating point, and rating points represent a percentage of the population, HOW COULD ANY AD AGENCY REQUEST 150 GRPs A WEEK? Can they reach 150% of the population?!) Additionally, the term GRP does not take into account a duplication factor.
So, it TECHNICALLY may be easier to remember that a GRP represents about 1000 hours of listening per week in that demo and daypart, whether it is, say, 500 listeners or 50. But if a buyer thinks that it is a percentage of the population, versus a percentage of LISTENING, there’s no point in cor-recting them. They just need to buy a certain number in the market, and mostly that’s that they care about. Just work to get that buyer to buy as many points from YOU!
Terry King Explains Radio Research
The methodology of radio listening has always been inexact, since it was developed in the 1940s. At that time, radio pro-gramming largely consisted of 15-minute serials like The Green Hornet and The Lone Ranger. Arbitron, the media research product developed by the American Research Bureau (ARB), used diaries to determine who was listening to what and when. These diaries were filled out by household members to docu-ment their listening - the days, times, and radio station(s) to which they were tuned. This documentation of listening was the basis of an Arbitron-developed metric, the Average Quarter Hour, or AQH, used by the radio industry to this day.
Until only recently, this archaic methodology of diary recall was the sole origin of the data that ranked the listen-ing level of individual radio stations. Pencil-scribbles and radio station call letters (e.g., KIIS-FM) and slogans (e.g., New Country) have determined which radio stations and programs are embraced by the public, capturing advertising budgets. Through Arbitron, the radio we listen to is placed in the hands of the small percentage of people who are sampled in each radio market.
Criticism of inexact measurement has abounded for decades, especially by radio stations that received poor rat-ings. Lower-rated stations have to overcome their ranking by either providing more value to advertisers by featuring lower rates or providing a desirable audience for specific advertisers that they could not easily reach anywhere else. (For example, a jazz station audience is a perfect target for someone wish-ing to market wine.) Of course, radio stations with great rat-ings often boast of their successes. Throughout many of our lifetimes, radio station formats have died or multiplied - and people have been hired and fired or become rich or poor - by the information provided in these diaries.
In 1992,Arbitron began investing in a new electronic meter-ing technology to monitor radio listening that is used today, the People Meter, or PPM. It better documents listening habits ( Continued ) and, in 2009, started to replace the diary method in many mar-kets and is continuing to expand. The technology itself looks like a small pager. Listeners wear it to allow it to capture and document radio station signals from radios as well as computer streaming sessions.
Arbitron’s objective is to acquire more accurate listening information for advertisers and broadcasters alike, who need the most accurate measurement stick to determine value for the advertising rates on the stations they buy - or, more accurately, the audiences they buy. In 2008, the A. C. Nielsen Company, a competitor to Arbitron from the start, acquired the rights from Arbitron to do the radio audience sampling in 51 small and mid-sized markets for various radio companies, touting their own superiority to Arbitron’s sampling methods. Competition is ripe even in sampling methodology and this will likely continue.
Measuring Audiences: Print Media
Print media, magazines and newspapers, measure how many people read their newspapers and magazines, or circulation. Total circulation includes subscrip-tions and newsstand sales, as well as copies sold in combination with events, educational programs, hotel delivery, and third-party sales. Market research firms measure and report back to publishers the result of their circulation research.
In addition, print media conduct readership studies to report the characteristics of their readers. Like broadcasters, they engage in demographic, psychographic, and behavioral research. However, as newspaper circulation has decreased over the past few years, they appear to be commissioning less of these kinds of research studies. For example, Dallas-based Belden Research, a 76-year-old company specializing in research for newspapers, closed its doors in early 2009 because fewer newspapers were willing to pay for such research.10
Circulation numbers have long been considered somewhat unreliable. As early as 1914, the Advertising Bureau of Circulation (ABC) was founded to provide independent audits , because the industry had earned a reputation for making exaggerated circulation claims. An audit means that the ABC examines a pub-lication’s circulation records, interviews circulation personnel, and examines internal circulation controls and practices.
Publishers issue a statement of circulation twice a year for 6 month periods that end on March 31 and September 30 for newspapers. Publishers of consumer magazines issue statements on June 30 and December 31. After the audit, the ABC publishes an audit report and verifies that the publisher’s claims with respect to circulation are accurate. The report will also note any discrepancies between the publisher’s statement and the findings of the audit.
Some publications will contract with ABC to conduct studies of readership and subscribers, as well as passalong information, which includes data about how much more actual readership there is due to one reader passing along the publication to others.
Measuring Audiences: Internet
So far the media we have considered are solely mass media whose messages flow in one direction from the content provider to many viewers, listeners, and readers. The Internet is an interactive medium, which means that mes-sages flow both to users and from users. Sometimes the information doesn’t even come from the users themselves - it might come from the user’s device, a computer, mobile phone, or personal digital assistant (PDA), or from software loaded onto the device.
When users go to a Web site, they are called visitors. During the time a user is on the site, the session , the Web site server is constantly pinging the visitor’s computer. In essence, a ping asks the question of another computer, “Are you still there?” and then waits for the user’s machine to reply, “Yes, I am.” The ping is the query-answer exchange between two machines. Throughout the session, the software on the Web site’s server keeps a record, or a log , of the pings passed between the user’s device and the Web site server. The log docu-ments the length of the session, the identity of the device, the pages, down-loads, web pages and services requested by the visitor, and downloads made by the visitor.
The Web site server is able to collect information about the device through the use of cookies. A cookie is a piece of software code that the server embeds in the memory of the user’s local machine. Its purpose is to identify users or devices and to track user and device activities. Typically, when visitors request information or services, they must register, providing a user name, password, and email address. Often, they must enter more information, such as their first and last names, complete address, telephone number, sex, age, and even more personal data.
If the information is stored and kept in memory for more than a single session, it is called a persistent cookie , meaning that it lasts over time. Knowledgeable users can set preferences for how their personal information is stored: not at all, for a single session, permanently. (Some sites will not allow page views or downloads if the user does not allow the site to set a cookie.) If personal information is stored, the next time that machine accesses the site, it sends the personal data to the Web site server. The server can use it to:
- Authenticate previously registered visitors by comparing the new user name and password to the stored versions
- Display a personalized web page
- Track a user’s activities across multiple Web sites
To avoid what they may believe is an invasion of their privacy, some users set the options in their browser to erase cookies when they leave the site. In these cases, only a session cookie is on the user’s device, kept until the end of the session. However, the Web site’s server log records all the information that is in the cookie during the registration process, so eliminating the cookie does not mean that the Web site, the content provider, or even an unknown third party, does not have the information provided by the user.
One of the questions a content provider, site operator, or advertiser might ask is: How many visitors have gone to this site during a specified time period? This metric is called unique users or unique visitors. If a site has a lot of visitors, then advertisers are willing to pay more than if the site has only a few visitors. However, cookies (and servers) cannot really identify visitors. They identify devices and authenticate user names and passwords. If someone else is using the computer and has access to the personal information, the site server will not be able to record that data. If a user has multiple accounts and devices, the same user may be counted as two users.
The Internet is the newest kid on the block: a recent media channel, compared to other mass media. The organization that hopes to standardize rules, poli-cies, and metrics for Internet content providers and advertisers is the Internet Advertising Bureau (IAB). More than 375 media and technologies make up the membership of the IAB that, together, sell more than 86 percent of online advertising in the United States. Stakeholders in the standardization of mea-surement and reporting of usage are content creators and distributors, market-ers, advertising agencies. The stated core objectives of the IAB are:
- Fend off adverse legislation and regulation
- Coalesce around market-making measurement guidelines and creative standards
- Create common ground with customers to reduce costly friction in the supply chain
- Share best practices that foster industry-wide growth
- Generate industry-wide research and thought leadership that solidifies the position of interactive platforms as mainstream media in the minds of advertisers and consumers.
- Create countervailing force to balance power of other media, marketing, and agency trade groups11
Being new means that the methods for gathering accurate measurements are still under development. The IAB conducts and sponsors research to develop the methods and metrics still needed to make advertisers comfortable in the online environment - and to increase their online ad spending. The IAB pub-lished guidelines for measuring the use of social media in June 2009, and metrics for audience reach in February 2010. The Internet and other interactive media are evolving rapidly, so measurement methods continue to evolve.12
The first order of business for the IAB is to standardized definitions and proce- dures to measure audience reach , or how many people does an advertiser reach with an ad placed on a web page? The IAB has proposed four ways to measure reach to a Web site “audience”:
- Unique cookies
- Unique browsers
- Unique devices
- Unique users
Notice that these measurements are in order from easy-to-collect and least specific to hardest-to-collect and most specific. In other words, it is automatic for servers to identify and log a cookie. It is more difficult to know whether a single user visits a site using more than one browser. It is even harder to know if the same user is using multiple devices. Finally, it is almost impos-sible to know if there is one user who has multiple devices and browsers, or if multiple users surf the Net from the same machine. For example, a wife may know her husband’s user name and password for commonly accessed sites. Indeed, there is some likelihood that roommates, friends, siblings, and significant others may know the registered user well enough to log on to some sites as that user.
In the online environment, the cost for reaching consumers is still evolving, and there are still many models and combinations of models for Web sites to charge advertisers:
- A reach-based fee, usually calculated by number of unique site visitors
- Click-throughs: Charge for click-throughs to the advertiser’s page ( pay-per-click or PPC )
- Part PPC, part information: Web site provides a link for the user to get more information, collects data from that requesting user, forwards data to the advertiser, and charges on a pay-per-lead or PPL basis - and keeps data
- Percentage of purchase
- Choice or combination: Fee structure is negotiated
Web sites seek to attract advertisers by providing them with precise informa-tion about users. For example, in addition to reach or the number of unique site visitors, they may offer behavioral data. For example, many sites tout user engagement as a key element in gauging the visitor’s value to a communicator. User engagement is described by such behavioral measures as:
- Length of time spent on the site
- Number of pages visited
- Length of time spent on a specified page
- Number of times the visitor returns to the site
- Average length of time visitors spend on site or specified pages, over multiple visits
Why do consumers find some sites more engaging than others? There is some research that has explored some possible answers to that question. O’Brien and Toms13 used earlier research to develop a scale to measure the factors that lead to user engagement. Their results found that the combination of the system and the task should be perceived as usable, aesthetically appeal-ing, and enjoyable. The user is more likely to be engaged when there is an easy flow from one point to another, sufficient novelty to hold attention, and endurable.
Many Internet companies believe that video delivery is The Next Big Thing (TNBT). They believe that it will bring even greater success to the medium by increasing advertisers’ online ad spending. So far, watching video has indeed proved popular, but it has not led to the bonanza Internet sites expected. One reason is the lack of standardized reporting of data about consumers that it is clear advertisers demand.
The IAB is working on standards for online video advertising. However, video content providers are not happy with the pace of development. In early 2009, Publicis, a worldwide advertising and public relations firm that has many cli-ents active on the Internet, put together a high-level group of content providers called The Pool. Members include Microsoft, Yahoo, CBS, and Hulu (NBC) to work on developing standards and metrics for video search, social media, mobile advertising, and other new media channels and platforms.14 More importantly, The Pool will develop additional video ad formats instead of sim-ply moving the classic TV ad format, the 30-second commercial, to the Web.
The overarching purpose of the group is to attract more online video adver-tising, to monetize new media channels. A subsidiary of Publicis, VivaKi, has started the process by creating five new online video ad formats. The company will convene consumer focus groups to explore their responses to the new types of online ads and narrow that number to two formats. Then the group will conduct quantitative studies to determine one that it will promote as the new industry standard. The timeline for release of the new format is the fourth quarter of 2009.
Measuring Audiences: Videogames and Other Emerging Advertising Channels
As another new media channel, the videogame industry has not yet developed standard metrics that allow advertisers to quantify their media buys and to determine the value of placing their ads in games. In 2006, the A. C. Nielsen Company announced the launch of GamePlay Metrics to provide videogame companies the ability to measure game playing and to establish standards for buying and selling ads placed in videogames. As one Nielsen executive put it, “The value of an entertainment medium is directly proportional to how well it is measured. A reliable and accurate standard of measurement for video gaming will drive advertising investment in this medium.”15
At first glance, measuring the reach of videogames seems like an easy task: Gather sales figures and online videogame subscriptions. From the perspective of videogame companies and game site operators, that simple procedure may be as much measurement as they need. NPD Group, a research firm, has tracked videogame sales for the past 25 years.16 The company uses sales data directly from retailers in the United States and Canada and reports the sales of the top ten games monthly. Beginning in 2008, NPD started tracking online game sub-scriptions as well.
But advertisers want to know much more about how they can use this medium effectively - this kind of data is not quite as easy to acquire. To accomplish the task, GamePlay Metrics, a Nielsen company, puts measurement devices on consoles to monitor daily usage and playing habits. Interpret, a partner in the enterprise, looks at the activity on social networks and gaming Web sites to provide additional information.17
Advertisers that buy time on television and radio and ads in print publica-tions and Web sites want to target their ads to customers who are likely to buy their products. Similarly, before they place ads in videogames, they require an accurate, reliable demographic profile of the people who play particular titles. As more games move online, it will be easier for game companies to provide usage and demographic information about players because they will be able to access information from their servers and from the credit card records required for ongoing payments for subscriptions.
One advantage offered by videogames is that they give advertisers a chance to put their messages before the eagerly sought young male demographic that advertisers cannot easily reach with other media. Nevertheless, media buyers want to make sure that they have the data they need to justify their decisions to their clients. For example, suppose 1,300,000 men aged 18-25 with incomes between $24,000 and $35,000 per year bought the latest version of Grand Theft Auto. Twenty percent of the group plays the game more than 500 hours; 20 percent plays between 250 and 500 hours; 20 percent plays between 100 and 250 hours; and so forth.18 If you were an advertiser and could place your ad in 20 percent of the games, which group would you like to make sure had your ad in their GTA game?
Games figure in yet another new media channel - mobile devices, especially phones. NBC Universal Mobile recently made an agreement with Rentrak Mobile Essentials™ to analyze the consumption of NBCU’s content that is distributed over mobile channels.19 The company will track such materials as video clips, SMS messages, ringtones, videogames, wallpaper, and other content. The company’s strategy is to collect data over time to shape promo- tional content that will lead users back to NBCU’s television content.
In addition to video sites and online games, advertisers would also like to be able to reach consumers on social media sites - blogs and microblogs, social networks, and wikis. Social media (Web 2.0) cut across many different catego-ries of Internet use, including retail sites, local listing sites like http://www.yelp.com, company Web sites, and even games. In a report about the role that social media play in the video gaming world, Networked Insights noted that in-game advertisers need to know about how the gaming audience is engaging, which elements it is engaging around in order to understand how to target players - in which games and what part of a specific game.20
Finally, publishing business reports and report excerpts, white papers, posi-tion papers, and press releases online is a new specialized form of reaching consumers about products and services. These activities combine marketing, PR, advertising, and promotion in an integrated package that endeavors to give consumers something to think about. Twenty years ago, a company offering expensive wares might have printed up a fancy four-color brochure, bought lists of executives and addresses, and mailed the brochure to them at the office.
Today, companies may still send such vehicles or give them away at meet-ings, conferences, and trade shows. But it costs far less to offer these materials for download. Moreover, people who download are taking an active role in securing the material, making it more likely that they will actually read it. Often the company will send out an email to existing and prospective custom-ers, providing a link on their own Web site for download. Usually, the request to download requires registration, giving the marketer valuable information about potential customers - valuable because this is a prospect that actively seeks the information. The marketer then contacts the person. Success of the marketing effort is gauged by counting the number of downloads and, more importantly, the number of conversions from prospects to sales as the sales process unfolds.
SUMMARY
This chapter examined how media companies learn about their consumers through research. It covered both market research, which provides infor-mation about the potential demand for a product, and marketing research, which tells companies how to communicate with their customers to sell their content products. When it comes to creating new content, some media industry sectors do not do as much market research as companies in other industries.
Media companies almost always do detailed research to market consumers to advertisers, using sophisticated research techniques. They are likely to use a combination of primary and secondary sources of data and to use quantita-tive and qualitative methods to analyze the information. Each media segment has its own methods for gathering data about consumers and vocabulary for reporting results: television and radio meter media use and employ either meters or diaries to collect demographic information about their audience. Print media use readership studies and sales and subscription records. Internet media automate data collection by requiring personal data in registration pro-cedures and monitoring activities. Learning about audiences that use emerging media platforms may be difficult until standards can be set.
WHAT’S AHEAD
The next chapter brings into focus one of the most exciting activities in which media companies engage: content creation and media production. It details the essential role managers play in fostering and leading creative projects, helping producers navigate the intricate development, budgeting, management, and completion of their works. And it looks at the new technologies that creators use to produce, market, and deliver content.
CASE STUDY 6.1 AUDIENCES AND PROGRAMMING
It is not uncommon for new hires as account executives (AEs) in radio or television to be handed the local Yellow Pages and guided by the sales manager with a simple task to “go get some business.” Perhaps that is a bit exaggerated, but it is eventually your call to action. Most media organiza-tions that take a chance on hiring someone without experi-ence or even those who do have experience will typically put an AE through some formal training or perhaps a mentor-ing program with another AE, but at some point, it all comes down to making the “cold calls” to businesses in hopes of closing that first sell.
As the new AE at a medium-sized market, you have just completed your official training period and now you are ready to get out and meet with prospective clients. The company has a very strict policy that requires you to complete a “Customer Needs Analysis” for these prospects. These CNAs are brought back to the station where you then work with Marketing to develop a well-rounded advertising plan, which will require you to understand how to use ratings and demographic data to fulfill the client’s needs. Choose a local TV or radio station that you would like to work for and complete the following assign-ment that will show you the value in conducting research com-pletely that is designed to generate business and ultimately income. The successful AE will gain a full understanding of the audiences that his or her station is able to reach with its vari-ous programs and match it to the target demo or audience that advertisers are attempting to reach.
Assignment
- 1. Develop a full Customer Needs Analysis form. What questions would you need to ask a business owner that would allow you to develop a full marketing campaign? Keep in mind that your goal is to focus on determining that businesses target demographic group both from a quantitative perspective and also a qualitative description.
- 2. Team up with someone in your class who will play the part of a business owner and complete your own Customer Needs Analysis. Now, switch roles, allowing the other person to ask you questions about your com-pany. In order to do this effectively, you may want to either research a local business or simply talk to some-one at a store where you enjoy shopping.
- 3. After you have conducted a full Customer Needs Analysis of the company that you are hoping to get on television, you can begin looking up the quantita-tive data that represents the media company you are representing. For example, you work at the local ABC station. What types of ratings or demographics do you have that would impress this business? If you are at a radio station, does the format lend itself to the company you have interviewed? If not, is there a specific program that airs on the TV or radio station that might be appealing? For example, every Sunday night, your radio station airs a Community Connection program or perhaps NASCAR in the second half of the year. What are the numbers?
- 4. Now, develop information on the qualitative aspect of the target customer for your client. Is it a high-price ticket that would require an upper household income? Are they more likely to be college graduates, parents with children, rent an apartment, own a home, concerned with the environ-ment or strictly convenience driven as opposed to be price-conscious? These are examples of qualitative descriptions that will assist you in developing not only a strong advertis-ing schedule, but also on how to develop a script.
- 5.Develop a : 30 television script that will be effective with the audience and sell the client’s product.
-
6. Present your findings in the form of a presentation to include:
- Overview of client’s business
- Quantitative data
- Qualitative descriptions
- Script
- Close the sell
Notes
* In 2009, Nielsen moved the February ratings to accommodate the original DTV conversion on February 17 that was then moved to June 12, 2009. This conversion was a government man-date that required TV stations across the country to switch from an analog to a digital signal.
REFERENCES
1. Simpson, G. (May 29, 2008). The FYI interview: Pat Holiday, Astral’s gentle giant. Accessed December 18, 2008, at http://fyimusic.ca/industry-news/broadcasting/the-fyi-interview-with-pat-holiday-radios-gentle-giant.
2. Eliashberg, J., Elberse, A. & Leenders, M. (2005). The motion picture industry: Critical issues in practice, current research & new research directions. Accessed on October 8, 2009, at: http://www.hbs.edu/research/pdf/05-059.pdf.
3. PricewaterhouseCoopers (2008). Media & entertainment markets , 2008-2013. New York: Price-waterhouseCoopers.
4. Smith, P. R. & Taylor, J. (2004). Marketing communications , 4th Ed. London: Kogan-Page.
5. Kvale, S. & Brinkmann, S. (2008). Interviews: Learning the craft of qualitative research interviewing , 2nd Ed. Thousand Oaks, CA: Sage Publications.
6. (2008). Ratings track: Update on Nielsen’s Local People Meter rollout. Accessed October 30, 2009, at http://www.tvb.org/rcentral/viewertrack/weekly/lpm-schedule.asp.
7. Zurswik, D. (May 4, 2009). Will Nielsen People Meters rock TV news in Baltimore? Accessed October 19, 2009, at http://weblogs.baltimoresun.com/entertainment/zontv/2009/05/nielsen_people_meters_baltimor.html.
8. Figures taken from A. C. Nielsen Company web site. Accessed November 2, 2009, at http://en-us.nielsen.com/tab/measurementv.
9. This section was compiled with the expert help of Terry King, general sales manager for Clear Channel, San Diego, California.
10. Mediapost (January 15, 2009). Newspaper research firm Belden to close. Accessed January 15, 2009, at http://www.mediapost.com/publications/?fa=Articles.showArticle&art_aid=98409&passFuseAction=PublicationsSearch.showSearchReslts&art_searched=belden&page_number=0.
11. Internet Advertising web site. Accessed January 10, 2009, at http://www.iab.net/about_the_iab.
12. Internet Advertising Bureau (December 8, 2008). Interactive Advertising Bureau audience reach measurement guidelines version 1.0. Accessed January 10, 2010, http://www.iab.net/media/file/audience_reach_022009.pdf.
13. O’Brien, H. L. & Toms, E. G. What is user engagement? A conceptual framework for defining user engagement with technology. Journal of the American Society for Information Science and Technology 59:6, 938-955.
14. Mandese, J. (January 22, 2009). VivaKi takes plunge, pools resources with CBS, Hulu, Microsoft, others for new video ad format. Mediapost. Accessed January 2, 2009, at http://www.mediapost.com/publications/?fa=Articles.showArticleHomePage&art_aid=98882.
15. Fox News (October 20, 2006). Nielsen to actively measure video-game usage in households. Accessed January 10, 2009, at http://www.foxnews.com/story/0,2933,222740,00.html.
16. NPD Group. Accessed January 11, 2009, at http://vgsales.wkia.com/wiki/NPD_Group.
17. Business Wire (March 21, 2007). Interpret’s new media reach and frequency study reveal measuring games by retail sales significantly under-values the advertising medium. Accessed January 11, 2009, at http://findarticles.com/p/articles/mi_m0EIN/is_/ai_n27255577.
18. Sherry, J. & Lucas, K. (2003). Videogame uses and gratifications as predictors of use and game prefer-ence. Paper presented at the annual meeting of the International Communication Association, Marriott Hotel, San Diego, CA. Accessed January 10, 2009, at http://www.allacademic.com/meta/p111471_i.
19. PR Newswire (January 6, 2009). Rentrak inks audience measurement deal with NBC Univer-sal. Accessed January 11, 2009, at http://news.prnewswire.com/DisplayReleaseContent.aspx?ACCT=ind_focus.story&STORY=/www/story/01-06-2009/0004949548&EDATE=.
20. (2008). Networked Insights measuring the social report, part 3: Video games. Accessed October 18, 2009, at http://www.networkedinsights.com/blog/uploads/MeasureTheSocialRe-port_games.pdf.