]>
CHAPTER 1
don’t hate the media. Be the media.
Jello Biafra
CONTENTS
Chapter Objectives
Introduction
Structure and Characteristics of the Media Industries
A Day in the Life of Craig Robinson
Common Characteristics of the Segments of the Media Industries
Summary
What’s Ahead
Case Study 1.1 Media Expansion
Case Study 1.2 Planning Ahead for Success
References
Internet Resources
CHAPTER OBJECTIVES
The objective of this chapter is to provide you with information about:
- The structure and characteristics of the content industries
- The segments that make up the content industries
- The wide range of businesses within the segments of the content industries
- The changing cultural, social, political, and economic conditions that establish the business context of the content industries
INTRODUCTION
Movies, music, games, magazines, books, newspapers, Internet, comedy, drama, news - this media content constitutes the exciting visible face of the media world that thrills and enthralls audiences around the world. Many peo-ple have fantasies of being in the public eye as actors, singers, writers, and journalists, and a few of us go on to perform. But behind the scenes, there are many rewarding careers in the media industries to discover, promote, support, and manage all the activities that must be completed to bring these wonderful works to life and to audiences.
The history of electronic mass media is short. The precursors, books and news-papers, have been around for several hundred years, but the phenomenon of mass media is less than 150 years old. Electricity-based technologies have their roots in the nineteenth century, but all emerge as media platforms in the twen-tieth century, as shown in Figure 1-1.

The short lifetime of electronic media means that the structure of media com-panies evolved somewhat differently from businesses in older, industrial enter-prises. They standardized products and processes, seeking greater production efficiencies. Once developed, manufacturing may not change for several years. But each content product has at least some unique properties, such as episodes of television series, and others are entirely unique, including motion pictures and music albums. It is only at the point of distribution that content products are standardized for delivery and consumption.
At the same time, there are also many similarities between companies in the media industry and those in other sectors. Most of the work in media organiza-tions is initiated and supported by managers - executives who have responsi-bility for directing, controlling, and supervising the affairs of the enterprise. To carry out the work, they draw on all the human, financial, technological, and environmental resources available to them.1
For example, in television, when a show’s popularity begins to slip, network executives begin to think about developing a new product, a new show to air in that time period. They will ask producers and writers to submit ideas that would appeal to the audience, sift through those ideas, develop a few of them, pro-duce a couple of pilots, test the pilots with a panel of people who would be in the audience, and order episodes of the show they think will succeed. Similarly, music executives are always on the lookout for new talent, but they might think a performer in a particular genre - country, hip-hop, ethnic - might be more successful than an equally talented jazz musician or Romanian gypsy band. Managers work in every kind of organization, industry, geography, nation, and society. Their responsibilities have a great deal in common, whether the task is managing a chemical company, a large farm, a not-for-profit social service agency, or a music label. Yet each business enterprise and environment has its own characteristics that affect how managers conceptualize problems and solutions and how they carry out their duties.
The glamorous media industries are no exception - even routine, predictable work carries the patina of the power and visibility that surrounds these enter-prises. Human resources hire personnel - sometimes performers like Sean Penn. Legal departments negotiate and approve contracts - sometimes for albums like OK Computer by Radiohead. Business development units estab-lish partnerships, finance and accounting departments handle payables and receivables and impose organizational cost-reduction programs, and market-ing teams traverse the complex wholesale and retail channels that finally put products in the hands of consumers, for all produced content - even a compel-ling hit TV series like House.
STRUCTURE AND CHARACTERISTICS OF THE MEDIA INDUSTRIES
It is a given that managers will know a great deal about the industry in which they work. They get that information from many sources. Some media enter-prises gather and analyze information about their consumers and customers from direct contact. If they don’t have internal information, companies receive research reports that tell executives about their audience, product performance, and markets. There is a lot of public information as well, as the media are fre-quent subjects of journalistic coverage that report on financial, technological, and cultural aspects of the industry. Managers also gain valuable information from their own personal experiences with buying and consuming content.
Another factor that influences how managers make decisions is the importance of the media in people’s lives. Many spend more time watching, listening, and reading the media than they do anything else, except breathing. Adding up all of the time they engage with media - waking to the sound of the clock radio/ CD player and television set, checking and responding to email throughout the day, listening to a car radio and an iPod, watching a portable DVD, play-ing games on mobile phones, surfing the Net, and watching television before bed - the average person in the United States spends more than 9.5 hours per day with the media and will spend $936.75 per year on media consumption.2 Nine and a half hours is more time than most people spend sleeping! Given the amount of time devoted to media use, it is no surprise that the media exert profound cultural, economic, political, and psychological influences. Indeed, the media constitute a pervasive, virtual environment whose impact sometimes seems to transcend even the physical world. Managers find that their business can be affected by the content they provide - remember Janet Jackson’s “wardrobe malfunction”? It upset many viewers, resulting in fines for the network and electronic banishment for Jackson.
Industry Size and Composition
In 2011, the global media industries will account for nearly $2.0 trillion in rev-enue.3 However, they are part of a larger commercial complex, called the copy-right industries. The organizations that make up the copyright industries engage in the “generation, production and dissemination of new copyrighted mate-rial.”4 The specific content may differ, but the management of these activities is strikingly similar, regardless of the specific industry segment or enterprise in which they take place.
Four components make up the copyright industries:
- Core industries: Industries whose primary purpose is to create, produce, distribute, or exhibit copyrighted materials, including broadcast, music, motion pictures, entertainment software, newspapers, and magazines, as shown in Figure 1-2.
- Partial copyright industries: Industries for which only some aspect or portion of the products qualify for copyright protection, such as the Ford Motor Company, whose cars may be patented, but not copyrighted. However, the brochures, TV spots, and other promotional materials the company produces are copyright-protected.
- Nondedicated support industries: Industries that provide distribution, marketing, and sales support to the copyrighted content economy, includ-ing transportation services, telecommunications services, wholesalers, and retail establishments. Examples of nondedicated support industries are telephone companies and Internet infrastructures that provide the trans-port networks for content.
- Interdependent industries: Industries that manufacture and sell prod-ucts that enable the creation, production, distribution, or consumption of copyrighted material. Such industries include manufacturers of consumer electronics products and media - televisions, DVD players, game consoles, cameras, microphones, lighting equipment, discs and tape, headphones, and so forth - the technologies that depend on the copyright industries for content that drive consumers to buy playback devices.
Media companies make up the largest component of the core copyright indus-tries. The primary purpose of these enterprises is to create, produce, market, and distribute books, newspapers, magazines, advertising, music and music media (records, CDs, and prerecorded tapes), motion pictures, television and

COPYRIGHT
A legal framework that applies to original works that reserves the right of copying to the creator. Different countries have different legal frameworks that define these rights in different ways with respect to duration, enforcement mechanisms, and penalties for violation. In the United States, copyright is constitutionally protected.
radio programs, and computer software (including videogames). As shown in Figure 1-2 , the copyright industries are an important part of the U.S. economy and copyrighted products are the largest U.S. export.
In Europe, the copyright industries are equally important. In 2000, they con- tributed more than a trillion euros (€1,200 billion) to the EU economy - about 5.3 percent of its total value. And they employed more than 5 million people in the European Union, constituting 3.1 percent of the total EU workforce.5 In the United Kingdom, the importance of the creation of copyrighted material is even greater: creative industries account for 8 percent of the economy.6 Although there are many management jobs in the core industries, they also exist in large numbers in the support and interdependent industries. The par-tial copyright category is an interesting one for today’s job seekers. This cat-egory covers the media needs of enterprises that offer products and services in other industries: automobiles, clothing, cosmetics, fishing gear, restaurants, and car washing establishments. All these companies need material to commu-nicate to consumers, investors, and employees. Increasingly, these communica-tions include video and audio, which require more expertise and management supervision than print media.7
Industry Segments
People who work in one of the copyright industry segments usually think of themselves as being in the music business, television business, or movie busi-ness. In other words, they identify with the specific segment they work for. Even so, they often know quite a bit about other segments, particularly those that are closely related, perhaps drawing on the same content or talent pool.
Analysts break down the media industries into segments in several ways. For the purposes of this chapter, segments of the media industries include filmed
In business, compound annual growth rate describes changes in value over time, taking into account year-to-year changes. In media and entertainment industries, CAGR normally refers to revenues, but the formula applies to any asset. It is a more accurate measurement than simply saying, “revenues are expected to double over the next five years.” (When an industry is shrink-ing, the CAGR will be a negative value.) The formula to calculate CAGR is:

entertainment, broadcast and cable television networks, television distribu-tion, recorded music, radio, Internet advertising, Internet access, videogames, book, newspaper, magazine and other print publishing, and corporate media. The next sections will look at the size and structure of each of the segments.
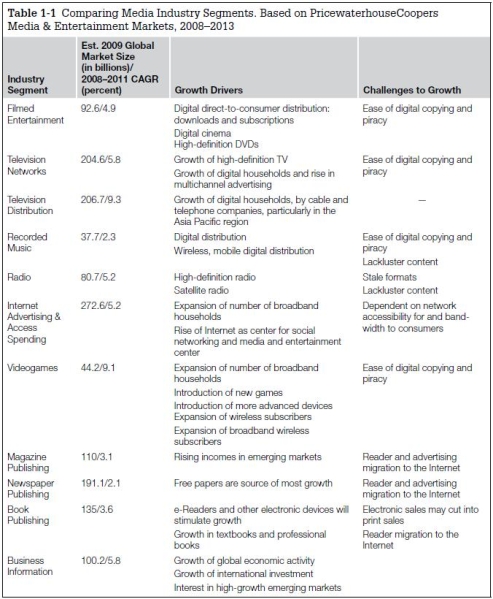
Managers within each segment of the creative industries need to consider the particulars of their organization and the markets they face. Typically, the markets are large, often global in scope. In some the growth rate (CAGR, for compound annual growth rate - see the box on this term) is high, in others more moderate. Table 1-1 describes some of the differences between creative industry segments. In the table, notice that all these segments face a similar formidable challenge: the ease of copying and large-scale piracy in the digital environment.
filmed entertainment
Los Angeles, New York, London, Paris, Mumbai, and Hong Kong are the global centers of filmed entertainment. The category includes revenues received from motion pictures, theater box offices, rental income from video stores, sales in retail establishments, and online subscriptions (including downloaded films and TV programs and DVDs sent through the mail). This category does not include revenues received from distribution via cable, satellite, telephone com-panies - all covered in the TV distribution segment.
Filmed entertainment occupies a special place in the media industry, because it drives revenues beyond the box office to many different businesses in the media industries. For example, when a motion picture is successful at the box office, it is likely to attract DVD purchases and rentals as well. It may spawn a sequel, prequel, or TV series. Its characters may be spun off to other properties. If the movie appeals to children, there may be lucrative downstream licensing opportunities for everything from calendars to bedsheets and keychain fobs. A hit TV show opens up some of the same opportunities and has the added advantage of running over a period of years.
Filmed entertainment is a fairly large segment of the media industries, but not nearly as big as the market for television networks and television distribution.8 Forecasts of worldwide revenues anticipate growth at a modest 4.9 percent (CAGR) over the next 5 years. The United States and Europe are the largest markets, but they are also relatively slow-growing. The Asia Pacific and Latin America regions are the world’s fastest growing markets.
Filmed entertainment brings in significant revenue, but it is also expensive to create. High costs impose a significant barrier to entry for many producers, although with the transition to digital production tools and distribution, there is some cost reduction. Nevertheless, the reality remains that big blockbusters come from big studios. With the exception of only a few independent studios and producers, large studios that are business units of huge multinational media corporations produce and distribute most globally successful motion pictures.
Forecasting revenues for this segment is difficult, because filmed entertainment is a hit-driven business - income depends on the release of compelling con-tent. However, they will continue to grow through 2010, stimulated by new technologies such as digital cinema, modernized theatrical auditoriums, high-definition television screens and DVDs, subscription and on-demand Inter-net downloading services, mobile players and receivers, and the expansion of the number of broadband households. According to copyright owners, one inhibitor of growth is the copying and distribution of content without permis-sion from (and usually without payment to) the copyright holder. Professional counterfeiters and casual copying through peer-to-peer networking both con-tribute to some loss of profits by media companies, although there is disagree-ment about exactly how much money is involved.
Broadcast and Cable television networks
Economists base the size of the market for broadcast and cable television net-works on the income these networks attract from advertisers as well as revenue from carriers, such as cable and satellite operators. The geographical centers of television networks mirror those of filmed entertainment, and they are usu-ally operated by the same media giants. In the United States, this category includes local television stations and cable operators. In Europe and Asia, it includes monies from public license fees. Estimates of global revenues for this segment predict it will grow from about $181.4 billion in 2007 to $228.3 in 2011, a CAGR of 4.8 percent.9 The fastest-growing regions are Latin America and Europe, which are likely to experience a modest growth rate due to net- works in the regions relying on stagnant government-collected license fees.
A rising standard of living in many countries around the world, increased advertising, and the penetration of high-definition television will stimu-late growth in broadcast and cable television networks. In the United States, Internet video and the growth of video-on-demand platforms will also drive increased revenue at 6.5 percent CAGR. Revenue from the release of seasons of TV programming on DVDs adds incrementally to income, although piracy is a concern as this market grows.

In the past, U.S. broadcast television networks created hit shows that had broad appeal. Many years ago, when there were only three networks, a hit show might attain a share of 70 percent of the viewing audience. (Nielsen Media Research measures the popularity of television shows for the industry by reporting rating points and shares. These terms will be covered more fully in Chapter 6, which examines audiences and programming.)
Today there are hundreds of networks and the mass audience has splintered under the onslaught of cable networks with niche appeal. In the first week of October 2009, Nielsen data showed that the four largest broadcast networks were a shadow of their former 30 percent or more selves: CBS averaged 11.3 million viewers (7.2 rating, 12 share). ABC had 9.6 million viewers (6.2, 10), NBC had 7.8 million (4.9, 8), and Fox had 7.6 million (4.5, 7). Even the most popular shows fare little better. In the fall of 2009, House began the new season with a 6.5 rating (6.5 percent of all TV households) and a 16 share (16 percent of all TV households watching a television show at the time).
Even though the number of people watching any particular television show went down, the cost of buying television advertising time actually went up. Broadcast networks actually charge a premium for commercial time. The rea-son? There are only a few places where advertisers can reach a mass audience. There may be a point of diminishing returns, but it is nowhere in sight. Any medium that can aggregate a large audience will attract advertisers who market products that have broad appeal, and television still does that job better than any other medium.
A steady rise in the number of digital households, which will bring in more advertising and high-definition television channels, will stimulate the growth in this segment. In addition, the rental and sale of DVDs that hold an entire season of shows is a growing source of revenue for television networks that have created hit shows. Both classic and contemporary TV shows can sell well. As with other content distributed on DVDs, piracy could threaten this new revenue stream.
However, the audience continues to fragment across multiple media venues. Broadband Internet access is growing rapidly. More than 54 million house-holds have access to video-on-demand services.11 More than 35 million have DVRs (digital video recorders).12 On April 9, 2007, Apple announced that it had sold 220 million iPods.13
Television Distribution
Television distribution includes the amount consumers spend on subscrip-tions and premium channel access, such as pay-per-view and video-on-demand access. It also includes revenues for TV programming distributed on mobile phones in Asia, where consumers pay subscription fees for this service. Growth for television distribution will be high: 9.3 percent CAGR between 2007 and 2011.14 However, this overall figure hides the large discrepancy in regional growth: TV distribution will grow 18.1 percent CAGR in Asia, with especially big increases in the Asia Pacific region, 12.3 percent in Latin America, and 12.3 percent in Europe, the Middle East, and Africa.
However, in the United States, growth will be a modest 5.4 percent, because consumers can already choose cable or satellite television delivery, and the market is saturated - subscription penetration is at nearly 90 percent. Viewers in other regions have fewer choices, and many have only satellite subscrip-tion service as a multichannel provider. As telephone companies begin to offer high-speed Internet access services, they are likely to market bundled offers of television subscription and Internet access both in all regions of the world, but in the United States, they are likely to take market share away from cable and satellite, rather than increasing the overall market very much.
Recorded Music
Music is recorded around the globe, in most major cities of the world. The equipment is essentially the same, whether the gig takes place in Los Angeles or Lima. In the United States, most music labels and much music recording takes place in New York, Nashville, and Los Angeles.
Executives in the recorded music segment have faced angry, skeptical, disdain-ful, and disbelieving audiences over the past decade and a half - audiences that include consumers, performers and musicians, and managers from other media industries. They point to poor planning and lazy marketing, inept tal-ent spotting and development, and lately, consumer-hostile responses to the threat posed by the Internet. Within the industry, managers have been divided over strategies to ensure profitability.
Ringtones: The sounds your mobile phone makes when it rings
Ringtunes: Sounds based on recognized songs that mobile phones make when they ring
Ringbacks:The sounds you hear in your mobile phone when the telephone you are calling is ringing
By any measure, it has not been a good 15 years for this industry segment. The market for recorded music encompasses physical media - albums, single recordings, and music video - and paid digital distribution via both wired and wireless net-works. In addition to songs and albums, the category also includes revenue from the sales of ringtones, ringtunes, and ringbacks. The global market is growing very slowly, from $36.1 billion in 2006 to about $40.4 billion in 2011, a 2.3 percent CAGR. Even in fast-growing regions like Asia Pacific and Latin America, the market will grow only at 5.4 percent CAGR. Forecasts call for the United States, the largest market in this category, to decline by 0.4 percent CAGR.
The decline of the market for recorded music seems to be accelerating. In mid- 2007, reported sales of the top-selling CD albums were down 30 percent, com-pared to the same period the year before. Some analysts attribute the lowering revenues to piracy, and both professional counterfeiting and peer-to-peer file sharing have probably played a role in the decline of sales. However, others point to poor market leadership on the part of large music companies, or music labels , as they are often called.
“The mighty music business is in a free fall - it has lost control of radio; retail outlets like Tower Records have shut down; MTV rarely broadcasts music videos; and the once lucrative album market has been overshadowed by downloaded singles, which mainly benefits Apple,” writes Hirschberg (2007) in the New York Times Magazine.15 Commenting in the article, David Geffen, the legendary music mogul, said, “The music business, as a whole, has lost its faith in content. Only ten years ago, companies wanted to make records, presumably good records, and see if they sold. But panic has set in, and now it’s no longer about making music, it’s all about how to sell music. And there’s no clear answer about how to fix that problem. But I still believe that the top priority at any record com-pany has to be coming up with great music.” One blogger offered the follow-ing explanation of the industry’s woes: “Free music downloading; suing your customers; alienating your customers by spying on them; inexpensive single downloads; low or no quality product; overpriced medium; greedy industry.”
The industry is in the midst of a rapid transition from physical distribution to digital distribution. Between 2006 and 2011, global physical distribution will decline by 9.6 percent CAGR. This change in the business environment means that labels that hope to be successful will need to find methods of doing busi-ness based on digital distribution.16
However, digital files are vulnerable to easy copying, so they have engaged in many efforts to reduce casual copying and file sharing by consumers. Between 2003 and 2007, the music labels’ trade group, the Recording Industry Associa-tion of America, initiated or threatened legal action against more than 20,000 people.17 They have also adopted technological barriers such as proprietary file formats that require special players or software that restricts copying. These technologies are often called digital rights management or DRM.
Radio
The radio segment includes advertising revenue spending, local over-the-air free broadcast radio stations, and advertising spending and consumer sub-scription spending for satellite radio. Companies that own radio companies are usually in financial centers of the country where they operate; however, transmitters can be anywhere or, as with satellite delivery, everywhere. Like the music industry, broadcast radio is experiencing a difficult business environ-ment. Overall global revenues are projected to grow at 5.2 CAGR.18 In Europe, increases in radio ad revenue are unlikely to top 3 percent between 2007 and 2011. In the United States, advertising on radio has been flat for 3 years and forecasters predict that 2007 levels will range between 2 percent up and 2 per-cent down.19 Despite the stagnant revenues, the sale of radio stations has not slowed, because investors continue to find radio stations very profitable busi-nesses, particularly in medium and large markets.
There are several explanations for the industry’s lack of growth in mature mar-kets, such as the United States and Europe. Some analysts cite concern with business processes, such as the complexity advertisers face when buying time on multiple stations, lack of electronic invoicing, and audience measurement. Other observers believe that formats and programming practices are a problem.
“Radio is a stale medium,” says Steve Kalb, senior VP and director of broadcast media for Mullen’s mediaHUB, who notes that he keeps a close eye on declining listening levels. “Every town has the same kind of format. It’s the same music. It’s very generic and white-bread. The homogenization of radio is frightening.”20
In the United States, consolidation is often blamed for the death of program-ming that would attract new viewers. Throughout the 1990s, large national media companies bought up many local stations that were formerly “mom and pops,” individual-or family-owned stations with ties to the locality. For example, Clear Channel, the largest radio group in the United States, owned more than 1,150 stations. However, there appears to be some deconsolidation occurring in 2007, as Clear Channel announced it was selling more than 362 of its stations, mostly in small, rural markets. By mid-2009, many analysts pre-dicted the largest U.S. radio conglomerate would have to declare bankruptcy, and later in the year, Citadel had filed for bankruptcy and several other terres-trial broadcasters were on the brink.21
In the United States, consolidation occurred as a result of changes in regulations by the Federal Communication Commission (FCC), which eliminated barri-ers to the number of stations companies could own. The FCC also lowered the requirements for local programming, so that many stations run simply as automated computer servers, transmitting content produced elsewhere. In this way, consolidation has reduced the number of jobs in the radio industry, so that a very small number of managers run a very large number of stations. The loss of individual stations has also caused station diversity to decline, so that stations (and their managers) appear to speak with one voice.
Analysts expect radio format audiences to shift in the next few years, with coun-try music listenership growing by 24 percent, news/talk formats by 20 percent, urban stations by 15 percent, and Spanish radio 14 percent. All other formats, such as oldies, adult contemporary, rock, jazz, and adult hits, are projected to decline.22 Independent music labels suffer the most from the near-monopoly on commercial radio by major labels - their pay-for-play domination of radio makes it impossible for independent musicians to get airplay, confining inde-pendent artists to the margins. Now file sharing and CD burning have created the first real opportunity to break the major label cartel, and independents have the most to gain. Many independents are no longer pounding on the doors of radio stations, because they believe that the link between radio play and music sales is now broken.23 In their view, the Internet provides a much more flexible, discovery-oriented medium for fans to find new music.
Internet Advertising and Access Spending
Internet advertising is the fastest growing ad medium. It is a segment where job seekers just out of college may be able to find a job and be able to grow a career as the industry matures. Much of the job of Internet managers is educat-ing those not intimately involved with the industry about what the Net can do for them and their companies.
Internet companies are everywhere, but they are thick on the ground in tech-nological centers. They are likely to be near universities that offer sophisti-cated computer science and other communications engineering programs and confer master’s and doctoral degrees. In the United States, these locations are Silicon Valley in California; Austin, Texas; and Boston, Massachusetts. In Asia, Tokyo, Seoul, and Singapore are major centers of Internet activity. In Europe, London, Paris, Rome, and other capital cities dominate. In Australia, Auckland and Sydney are centers of Internet innovation.
In 2003, Internet advertising and access spending made up 3 percent of global advertising; by 2011, it will rise to 14 percent. PricewaterhouseCoopers esti-mates that the global Internet advertising market will grow from $22.9 billion in 2007 to $73 billion in 2011, a CAGR of 18.3 percent. All global regions will experience double-digit increases. During the same period, revenues from the global Internet access market will rise from $169.5 billion to $298.4, a 12.2 percent CAGR. The access market differs across regions, because some territories already have a large number of subscribers. The U.S. Internet access market will grow at a 7.1 percent CAGR; Asia Pacific will expand at a 16.9 per-cent CAGR.24
In 2004, Internet advertising revenues surpassed those of out of home adver-tising (outdoor boards and signs). In 2007, the Net overtook radio. In 2010, it will bring in more ad dollars than magazines. However, as of 2007, Internet ad income ($49.6 billion) is far behind the remaining mass media - television ($196.9 billion) and newspapers ($117,878).
Globally, Internet advertising is growing at a double-digit rate, about 18.3 CAGR. As fast as this category is expanding, it is still limited by overall rates of connectivity. In the United States, where advertising is a long-established part of media environments, the Internet advertising market is well devel-oped. In 2007, almost 40.3 percent of advertisers’ budgets went toward key-word search - about three-quarters of this spending went to Google. Classified ads received 25.6 percent of ad money, video brought in 3.3 percent, and other forms of advertising such as banner ads and display ads accounted for 30.8 percent of all money spent on Internet advertising. Forecasts call for key-word search advertising to increase over the next 5 years. Spending on banner ads and other static formats will decline as broadband usage expands, allowing advertisers to use more video content.
Managers of Internet companies agree that one barrier to faster ad revenue growth in this media segment has been the absence of agreed-upon methods of measuring effectiveness, or metrics. Advertising managers use metrics to con-vince their supervisors to spend part of their budgets on Web sites. They also use metrics after the campaign to show the effectiveness of the ad spend.
The universal language of advertising, irrespective of medium, is impressions. The Internet Advertising Bureau (IAB), a trade group, has been working on establishing industry-wide metrics for impressions. Two companies dominate the measurement of Internet advertising, ComScore and Nielsen/NetRatings. Advertisers are concerned with discrepancies between the measurements of each firm of the same sites as well as differences between what the mea-surement companies report and the records maintained on the advertisers’ servers.
In April 2007, IAB president and CEO Randall Rothenberg wrote to ComScore and Nielsen/NetRatings, asking them to hold a summit meeting to resolve measurement issues: “We are seeking your agreement to a near-term timeta-ble for independent audits and accreditations of your companies’ interactive-audience measurement processes. We also hope to open a dialogue with you
Exposure of a person or household to an advertising message. Sometimes advertisers pay for the services of an ad agency, based on a particular number of impressions by specific demo-graphic groups, such as “men 18-35,” “women 25-49,” or even more narrowly targeted groups. As the focus narrows, the cost per impression goes up.
about assuring the integrity of audience measurement systems and processes as interactive technologies continue to evolve.”25 In 2008, the IAB issued guide-lines for audience reach measurement. The group hoped to establish consis-tent definitions of metrics and to set measurement standards. However, some of these issues were still not resolved by mid-2009, particularly for rich media, such as video.26
Internet advertising will become prominent when the industry reaches a con-sensus about how to collect, aggregate, mine, and apply specific metrics - and position themselves to supply them. This is the work of the today’s managers and executives in the Internet, and they are actively engaged in it. The use of Google Analytics is widespread, but does not provide a neutral measurement service, as Nielsen does for the television industry.
Once the metrics issues are more fully worked out, the Internet will offer a powerful complement to the mass giants, because it offers advertisers the abil-ity to reach individuals with offers tailored to their needs and desires. In a world where there are few information sources, advertisers must present gen-eral offers to an aggregated buying public. The Internet brings an almost infi-nite number of information sources that changes advertising and marketing strategy to one of applying data to individual customers.
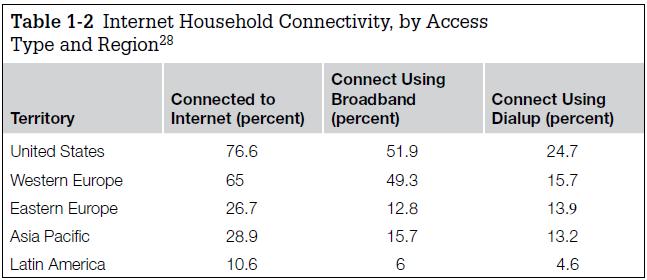
Internet advertising depends on the number of people who are connected, so managers in Internet companies support broadband subscription as much as they can. People with broadband spend more time online. The greater band-width allows advertisers to use graphics, animation, audio, and even video to communicate their commercial messages. In 2007, the United States accounted for 52 percent of Internet advertising revenues, but only 19.6 percent of Inter-net access spending. Asia Pacific spent the most on access, making up 39 per-cent of the global total, and Europe was the second largest market, paying out 35.8 percent of all spending.27 People around the world are trading in their dialup service for broadband access. Table 1-2 shows the percentage of the population that has broadband connectivity, compared to dialup access to the Internet in some regions of the world.
Videogames
Videogames are popular. In 2003, the industry surpassed the motion picture industry in revenue. The market for videogames includes consumer spending on the games themselves, rather than the hardware platform on which to play them. (The game platforms - computers, consoles, and handhelds - are all part of the consumer electronics industry, not the media industries.) Games are purchased individually or by subscription, as retail boxed games or down-loaded digital products. The types of games are console games, personal com-puter games, online games, streamed on-demand games, and wireless mobile games. In the United States, advertising spending for messages within games is included as well.
As in many other media segments, videogames are hit-driven. Sales can be volatile, changing from month to month. As of September 2009, the most popular console games were Halo 3 (Xbox 360), Sports Resort (Wii), and Pro-fessor Layton and the Diabolical Box (Nintendo DS). The most popular online games in mid-2009 were World of Warcraft, Habbo Hotel, and RuneScape.
The market for console games is cyclical: a cycle starts with the introduction of a new console. Then designers build games that take advantage of the more advanced features the new console offers. When one of the new games gener-ates buzz and becomes increasingly popular, gamers must buy the new console if they want to play the new hit game. Competitors introduce their own ver-sions of the upgraded consoles, developers create more games, and the market solidifies for awhile as the games and machines penetrate the market. Then a company introduces a new console with enhanced features - and the cycle begins again.
There is an ongoing competition between console and PC-based games. Con-soles are dedicated to gaming and can provide fast play and rich graphics at a lower price point than computers. However, computers are general-purpose machines that can emulate any game console. The chameleon-like characteristics of computers mean that gamers can play a game created for any platform on their computers, not just the console for which developers designed the game. In 2007, Microsoft introduced the Vista operating system. It shows how impor-tant videogames are in today’s marketplace that the purpose of many of Vista’s features was to enrich gaming by providing for faster graphics handling and game play.
The design of some games limits them to play by a single person; others allow small groups or teams to play. If the means of playing the game - console or PC - provides online connectivity, then the game may allow many people to play, sometimes numbering in the thousands. Such games are called MMOGs , which stands for massive multiplayer online games. Games fit into one or more genres, based on the design of the play, the theme, or the underlying reality that the game references. The most popular genres are action (including shooter games), adventure, fighting, role-playing, simulation, sports, and strategy games. Other genres are adult, arcade, advergame, artillery, education, music, party, pinball, puzzle, stealth, survival, horror, traditional, and vehicular combat games.
The growth of the videogame market reflects advances in rich, realistic, fast-changing graphics and the speed of game play. These characteristics depend on the processing speed of the hardware it runs on - console, computer, or handheld, so advances in processing precede sales and profits. The expansion
BANDWIDTH
The size of an information channel. One way to picture a communication channel is as a pipe that carries liquid. The bigger the pipe, the more liquid it will carry.
A water pipe carries a given amount of water in a given amount of time. For example, a pump might have the capacity to move 50,000 gallons of water per hour. Similarly, although the technical measure of bandwidth is the number of frequencies it includes, the more oft-used measurement is the data rate, or the amount of information bits carried, usually in seconds. For example, cable companies routinely deliver 3 megabits per seconds (3 mbps) of information to their computer companies. This measurement means that the channel permits the transmission of 3 million bits of information every second.
Communication channels are bundles of frequencies, which are waves of energy that move through the air. Like water, they flow. The greater the number of frequencies that a channel accommodates, the more information the channel can carry.
The word bandwidth is very descriptive. A band is a set of frequencies. Frequencies are the number of cycles associated with a wave of energy that moves through the air and even build-ings. (Your cell phone works in your house, for example.) The width is the number of frequencies that, taken together, compose the channel.
A technique called modulation involves modifying the frequencies of the waves that reflects the information to be transmitted. When the transmitter pushes out the waves, the receiver looks at the modifications and retrieves the information from the waves, one bit at a time.
of broadband network access, both wired and wireless, will also stimulate the growth of this segment.29 Near real-time knowledge of other players’ actions and the ability to launch immediate responses make for satisfying fast game action. This real-time tele-presence , accompanied by information about how the moves of hundreds (even thousands) of other players affect the environment, is a function of how much information can be provided to all the players in a given amount of time - the available bandwidth.
Bandwidth is a two-edged sword. It makes it possible for gamers to play with many people live over the Internet. The popularity of MMOGs like World of Warcraft, Habbo Hotel, and RuneScape, each with millions of monthly sub-scribers, testifies to the increasing appeal of online gaming. Media giants have taken notice of this trend and both Warner Bros. and MTV have developed game-like online environments to promote their brands.30 But plentiful band-width also allows users to download large files very quickly, enabling the piracy of game software - just as it facilitates downloading of music, movies and television programming.
A DAY IN THE LIFE OF CRAIG ROBINSON
Craig Robinson, President and Gm,
KNBC TV/Los Angeles, California
Craig Robinson is the President and General Manager of KNBC-TV in Los Angeles, California, the second largest tele-vision market in the United States. In his own words, Craig describes his climb to the top: “Through the years I’ve had the good fortune to hold many key jobs within a television station, including executive assistant, sales trainee, salesper-son, sales manager and vice president of sales. Working at all levels of the organization has given me an appreciation for some of the positions that aren’t high profile, but that are integral to the success of the business.”
When asked to describe a “typical” day in this high-profile and fast-paced position, Craig provides a quick snapshot: “Every day involves some revenue forecasting and expense pacing. On an average day, there will also be meetings with news, engineering and the web staff internally. I also meet with city leaders and community groups on a regular basis.”
How does a typical day begin for the President and GM of one of the top TV markets in the country? “Checking last night’s ratings performance on my BlackBerry.” Meaning that Craig’s day starts well before he sets foot into the tele-vision station. He first looks at his agenda upon arriving at the KNBC office, which will set the pace for the upcoming day. “After returning urgent emails and calls, I schedule the more complex meetings for the morning, while everyone is fresh.”
We’ve all heard that old adage, “It ain’t easy at the top.” So, tell us what are some of the most challenging issues you face?
“Keeping a motivated and healthy workforce is always the most challenging issue, particularly in a tough economic environment.”
It’s well known that you sincerely enjoy your position. Can you describe the highlights of your workday?
“Talking to the people who make it happen every day, acknowledging their successes. I meet on a regular basis with the heads of each department, but it’s always energiz-ing to hear from the people on the front lines.”
After a full day at the office, which is typically longer than eight hours, how do you end your day?
“Often with a community event or client dinner.”
At the end of the day, what advice would you offer those who are looking to follow in your footsteps?
“Concentrate on the job at hand. It’s important to have long-term goals, but if you spend all of your time looking at the next job, you won’t give your full attention to your current one. Excel at your current assignment and the other oppor-tunities will find you.”
Wise words from a man who is keeping his eye on the future, one day at a time.

BUSINESS MODEL
A business model is part of an overall business plan that describes how a company plans to make money from the mix of products and services it offers in the commercial marketplace. Chapter 13 describes media and entertainment business models in detail.
The rapid global expansion of number of broadband households, the intro-duction of new games and ever more advanced devices, the increasing popu-larity of MMOGs, and the rise in the number of narrowband and broadband wireless subscribers are all driving the growth of the videogames market. For the console segment of the industry, the introduction of games based on a new console marks the beginning of a high cycle. At the beginning and end of a cycle, the market drags. Jobs follow activity, so there is no better time to look for work in the videogame industry than when new games come that are tailored to the latest generation of consoles. The huge revenues of this segment has encouraged many educational institutions to offer curricula that lead to certificates and degrees in videogames.
Publishing
This category includes business information, magazine, newspaper, and book publishing, most of which are growing quite slowly - only business informa-tion is growing at a compound annual growth rate of more than 5 percent. These are mature industries that all face some degree of threat from the Inter-net, particularly newspapers and business information. The sale of print books may decrease because of the rise of e-readers, but these will act to stimulate books modestly.
COMMON CHARACTERISTICS OF THE SEGMENTS OF THE MEDIA INDUSTRIES
Despite the personal identification that people who work in a particular media industry have with it, there are striking similarities between the segments: they are sensitive to changes in technology, popular in both global and local environments, and involved in the creation of both information and enter-tainment products. They help create and are vulnerable to cultural, social, and political trends. They also face a long list of similar economic challenges and opportunities.
Sensitivity to Changes in Technology
All media employ technology to create and deliver content and, in modern life, most entertainment reaches consumers through one or more media. The continuing appearance of new technologies means that there is a constant shuffling of content and media platforms, as companies respond to the changed environment. The harnessing of technology to information and entertainment provides many opportunities to media enterprises, but changes in technology may also disrupt specific business models.
Today’s media managers need to understand about the technologies that affect their business. If they are not engineers, they need to find a way to learn about technology so that they are not intimidated by the many discussions that include such considerations. Earning the respect of colleagues, partners, co-workers, and subordinates depends on having a good grasp of key technologies that can affect the business and industry.
The Global Internet and the Broadband Explosion
Distribution over the Internet brings content owners and distributors enor-mous business opportunities and challenges. It offers the potential for world-wide, friction-free distribution, a term that describes the ease, speed, and lower cost of distributing digital products across the Internet, as compared to physi-cally moving them across geographies. It provides an infrastructure for imme-diate payment. And, most importantly, it allows the identification of individual consumers.
Consider broadcast networks. A television or radio station transmits a program and an audience tunes in to it. The company does not know who received the programming, which program elements and ads they responded to, or how long they viewed or listened. They can get ratings from the Nielsen service, measurements of a tiny sample that - no matter how carefully selected - can-not rival the accuracy of the precise measurement of each and every content consumer transaction that Internet data provides.
The Internet is a universal data carrier. It transports any kind of data, leaving it to the receiving device to decode the stream of information as text, sound, and image. Given sufficient bandwidth, it carries with equal facility written mate-rial, audio, graphics, and video. This flexibility is very different from traditional distribution systems: TV transmitters transmit video and audio; radio transmit-ters transmit sound; newspapers and magazines circulate text and photos; and so forth.
More bandwidth means more data, more content to the consumer. Globally, more than 400 million people have broadband service. Global broadband quadrupled during 2008, growing from 0.01 percent of broadband per capita in the first quarter to 0.04 percent in the fourth quarter.31 In the United States, it is available to 85 percent of U.S. residents and about 63 percent subscribe, as of March 2009. By 2011, the number of broadband subscribers is expected to rise to more than 90 percent.32 In 2009, European countries held eight of the top ten places for adoption of broadband Internet access The United States was in the eleventh position.33
From Push to Pull
Do you ask for content, or does somebody give it to you, whether you like it or not? Social systems and their related communication systems have a center and an edge, the periphery. Think of the organization of cities and towns with a cen-tral business district and suburbs. Different societies have different structures, so that one may be more centralized or dispersed than another; one may fea-ture frequent communication between members and another leave people in greater isolation. In top-down hierarchical social systems, command commu-nication moves from the center to the periphery - from the boss to the janitor. In flatter systems, some command communication may flow from the bottom up, so that the leaders are informed by the experience of the followers.
When information originates from the center and radiates outward toward the members at the edges of a communication network, it is called push.34 A broad-cast network, cable system, or satellite system is a good example of a push network. The originator decides whether to push information, what to push, when to push it, at what cost, and to whom. The audience has the choice to tune in or not under conditions set mainly by the entity at the center of the network.
The Internet is a system with two-way communication flow that allows users to request content, to pull information from the network. In a computer network, this distinction is captured in the phrase “server push, user pull.” When infor-mation is pulled (or requested) by the receiver, it is the receiver who decides when to make the request and defines what is to be received. The relationship between center and periphery may not be equal, but pull systems give more control to the periphery of the network than do push systems.
Digital, Downloadable Formats Are Replacing Physical Formats
In 2006, digital spending streams contributed more to global entertainment and media revenues than did the sales of physical media.35 Downloading text, graphics, and audio is possible over dialup connections and fast and easy over broadband. Some people are even downloading motion pictures and televi-sion shows, although many more watch in theaters, on DVDs, or over the air or cable. However, as bandwidth increases and downloads become faster and more convenient, the number of downloads will grow.
Mobile devices, especially when they are connected to the network at broad-band speeds, accelerate the move to digital, downloadable formats by increas-ing the opportunities and occasions subscribers have to download and pay for content. Narrowband mobile applications, like texting, playing games, and downloading and paying for games and ringtones, demonstrate the attractive-ness and convenience of untethered communication and entertainment ser-vices to consumers on the go.
The Move to Mobile
Cutting the cord is a global phenomenon. The number of wireless broadband-capable mobile devices continues to grow, including cell phones, PDAs, and notebook and palmtop computers. With broadband functionality, these devices are able to send, receive, and display music, video broadcasts, and videogames, as well as voice and data. The number of wireless subscribers will expand from 2.3 billion in 2006 to 3.4 billion in 2011.36
According to a study by Juniper Research, 204 million mobile phone custom-ers will generate $22 billion in mobile payments by 2011. In 2007, there con-tinued to be unresolved revenue sharing issues between sellers and mobile service operators and payment-processing service providers.37 However, the technology exists to enable such payments once the market participants reach agreement about their business arrangements.
Global Distribution, Local Diversity
Global communication systems extend the reach of media to almost everyone, everywhere, nearly instantaneously. At the same time, global economic growth is raising revenues in many regions, allowing people to pay for connectivity, access, and content. The immense profitability of global hits makes it tempting for companies to develop properties that can transcend cultural differences. However, the level of investment required to create and distribute such proper-ties is a large barrier to entry to small and medium-sized enterprises.38
Although there are obvious benefits to creating and distributing global block-busters, the vast majority of media is created and consumed locally. For example, some U.S. consumers may love Japanese anime, but in the domestic market, South Park and The Simpsons will garner the greater revenue. Not all properties translate across cultures or even national boundaries. Comedy is notoriously difficult to move from one culture to another, but drama, news, music, and other content may also be limited to their geography of origin. It is likely that the penetration of the Internet will accelerate the transportability of commercially successful media content, but complete cultural compatibility is still in the future.
The Great Content Divide
Most of the media industry segments divide the content they produce into one of two broad categories: information or entertainment. Most media giants create both types.39 In filmed entertainment, there are fictional motion pictures and there are documentaries and reality-based movies. In television, radio, and print, the separation between information and entertainment is fairly clear, although reality TV and comedy shows such as The Daily Show , The Colbert Report , and Countdown with Keith Olbermann have blurred the boundaries between the two genres. Some critics believe that this blending began with network television news, with its use of flashy graphics, sensationalized stories, and glamorous anchors.
Motion pictures, music, and videogames are primarily entertainment media. Newspapers favor information-based content, with side trips to entertainment in the comic section. In the other industry segments, such as television, radio, magazines, and the Internet, content is more equally divided between the two types.
For managers, the distinction is important, because each type of material comes with its own set of standards. Entertainment content must attract viewers and users; information content must inform them without alienating them. On the whole, the creation and distribution of entertainment products do not entail liability, although there may be criminal penalties for engagement with porno-graphic, treasonous, or other societally prohibited material.
There is greater liability associated with information content. Standards of trustworthiness apply, as do strictures against fraud, libel, false light, and other representations deemed harmful to society as a whole or individuals. More-over, many violations of taste in entertainment material may be greeted with a wink and a nod; such violations in informational material may have more serious consequences.
Sensitivity to Cultural, Social, Economic, and Political Trends
Cultural, social, and political ideas shape the way the media must approach its audience. In the creation of content, achieving popularity entails either giv-ing people something they need (uses) or want (gratifications), which vary depending on the society in which a media organization is operating.40 In both cases, the material has to address users and consumers within their cul-tural, social, and political milieu. On the other hand, the media produce com-pelling material that sets the agenda for what people think and talk about, so content can become very controversial.41 Societies go to great lengths to manage and regulate content. In Chapter 14, the book will address legal issues that affect media operation and content. Chapter 15 will cover media ethics, as social norms also limit how media com-panies operate.
The media industries also share the economics of creativity. Within these indus-tries, the general perception is that companies will succeed or fail based on the quality of creative work, as defined by commercial hits and blockbusters. The management of creativity is an essential skill in these organizations. In media segments such as motion pictures, television, and music, some executives exert influence because they are able to interact well with talented content creators and performers. In addition, the economics of creativity affects budgets and profits, subjects which will be covered more fully in Chapter 5.
Summary
This chapter described what media managers and executives need to know about their industry, including its size, scope, and characteristics. It provided information about industry segments, including size, drivers of and barriers to growth, and challenges. It looked at some contextual similarities faced by the segments, the different growth drivers between, and the external environments they face.
WHAT’S AHEAD
The next chapter examines in detail the organizations that participate in the M&E industry segments. It distinguishes between organizations that produce content, distribute it, market it, and transport it, as well as those that engage in most or all of these activities. The chapter covers organizational structures, pro-cesses, information flows, workflows, and the economics of industries that are based on creative activities, including the media industries. The organizations covered in Chapter 2 include studios, TV networks and stations, radio stations, production companies, music labels, and other corporations, such as nonprofit groups, and government agencies that produce and distribute content.
CASE STUDY 1.1 MEDIA EXPANSION
Alpha Broadcast Group owns 28 TV stations (6 ABC, 14 NBC, and 8 CBS affiliates) and 61 radio stations. The company executives are putting together a strategic plan to chart the future of the company. The three objectives are:
- To position the company for the future
- To attain greater profitability
- To reach young people aged 12-25 years
The executives have decided to expand operations into other media. What properties or mix of properties would you recommend for investment: newspapers, Internet sites and services, or mobile services? Explain your recommendation.
CASE STUDY 1.2 PLANNING AHEAD FOR SUCCESS
Media and Entertainment (M&E): Industries, Segments, Businesses, and Environment
Robert Burns may have said it best in his poem “To a Mouse” when he eloquently stated in his native Scottish brogue that “even the best-laid plans of mice and men oft go awry.” This inspired the title of the book most students read in high school, Of Mice and Men. Of course, this is the loosely translated English version, but the message is very clear: It is a reminder that even a well-thought-out strategy has the potential to fail.
So how can you reduce the risk of a plan going awry? The quick answer is research. In fact, many reality shows (such as The Apprentice ) begin with this basic strategy to place you on the path to success. Ask yourself, who is the best tar-get customer for the product? How do you effectively reach out and appeal to this market?
It is critical in the preplanning stages that one researches the market conditions thoroughly and fully understand cul-tural variances, such as heritage, language, religion, popu-lation, politics, and sociocultural and economic conditions.Fully understanding these variables will ultimately lead to the success or failure of a product or service.
No pressure, right?
Assignment
As the product manager for a videogame company, you have been assigned to market a game that involves bicycle racing. You have been asked to release the game in the United States and also in France.
- 1. Get creative and name the game in both English and French. Can it be the same or should it be different?
- 2. Define your target market. Research videogames that would appeal to bicycling enthusiasts. What are the common traits? Would it be the same in both countries?
- 3. Identify at least three appealing components for your product. Determine how they might differ from one another.
- 4. How would your marketing strategy differ in the States from in France and why?United
REFERENCES
1. Management. Dictionary.com. Dictionary.com Unabridged (v 1.1). Random House, Inc. Accessed August 18, 2007, at http://dictionary.reference.com/browse/management.
2. U.S. Census Bureau (2006). Media usage and consumer spending: 2000 to 2009. Washington, DC: U.S. Government Printing Office.
3. PricewaterhouseCoopers (2007). Global entertainment and media outlook 2007-2011 - Television networks: Broadcast and cable. New York: PwC.
4. Siwek, S. (2006). Copyright industries in the U.S. economy: The 2006 report. Economists Incorpo-rated. Accessed September 6, 2009 at http://www.iipa.com.
5. Internal Market and Services Directorate General (DG MARKT) (n.d.). Internal market - copy-right and neighbouring rights - index. Accessed August 8, 2007, at http://ec.europa.eu/internal_market/copyright/index_en.htm.
6. National Endowment for Science, Technology and the Arts (NESTA). (2006). Creating growth: How the UK can develop world class creative businesses. London: Nesta.
7. ——— (January 31, 2008). Corporate video spend on TV and branded sites jumps in 2007. The NewsMarket. Accessed August 28, 2009, at http://www.marketwire.com/press-release/The-Newsmarket-816090.html.
8. PricewaterhouseCoopers (2007). Global entertainment and media outlook 2007-2011 - Filmed entertainment. New York: PwC.
9. PricewaterhouseCoopers (2007). Global entertainment and media outlook 2007-2011 - Television distribution. New York: PwC.
10. Information about ratings and shares is available at the Nielsen web site, http://www.nielsenmedia.com/FAQ/ratings.html, and the Television Bureau of Advertising (TVB), http://www.tvb.org.
11. This information is provided by measurement service Rentrak, as reported in by Media Biz. Accessed September 9, 2009, at: http://www.mediabiz.com/news/articles/?publication_id=4&release_id=125.
12. These figures appeared in a press release from the Leichtman Research Group, available at http://www.leichtmanresearch.com/press/091009release.html.
13. Drake, J. (April 9, 2007). 100 millionth Apple iPod sold. Accessed June 26, 2009, at http://www.associatedcontent.com/article/208934/100_millionth_apple_ipod_sold.html.
14. PricewaterhouseCoopers (2007). Global entertainment and media outlook 2007-2011 - Television distribution. New York: PwC.
15. Hirschberg, L. (September 2, 2007). The music man. New York Times Magazine. Accessed November 6, 2008, at http://www.nytimes.com/2007/09/02/magazine/02rubin.t.html?_r=1&oref=slogin.
16. PricewaterhouseCoopers (2007). Global entertainment and media outlook 2007-2011 - Recorded music. New York: PwC.
17. Electronic Frontier Foundation (2007). RIAA v. The People: Four years later. Accessed September 1, 2007, at http://www.eff.org/IP/P2P/riaa_at_four.pdf.
18. PricewaterhouseCoopers (2007). Global entertainment and media outlook 2007-2011 - Radio and out-of-home advertising. New York: PwC.
19. Bachman, K. (January 1, 2007). Forecast 2007: Radio. Media Week. http://www.mediaweek.com/mw/news/tvstations/article_display.jsp?vnu_content_id=1003526034.
20. Ibid.
21. ——— (July 1, 2009). Radio One, Citadel outlooks look grim, Clear Channel eases closer to bankruptcy. Accessed September 10, 2009, at http://www.mediabuyerplanner.com/entry/43795/radio-one-citadel-outlooks-look-grim-clear-channel-eases-closer-to-bankrupt/.
22. Podmetrics (April 11, 2007). Radio format trends. Accessed August 15, 2007, http://podmetrics.wordpress.com/2007/04/12/radio-format-trends-2012-4112007.
23. Hirschberg, op. cit.
24. PricewaterhouseCoopers (2007). Global entertainment and media outlook 2007-2011 - Internet advertising and access spending. New York: PwC.
25. ClickZ (2007). IAB takes ComScore and NetRatings to Task. Accessed July 15, 2007, at http://blog.clickz.com/070420-124318.html.
26. Acquah, V. (May 15, 2009). Comscore MediaMetrix vs. Nielsen Netratings: Round X. Accessed September 15, 2009, at http://test.blueanalytics.com/index.php/blog/article/comscore_mediametrix_vs._nielsen_netratings_round_x.
27. PricewaterhouseCoopers (2007). Global entertainment and media outlook 2007-2011 - Internet advertising and access spending. New York: PwC.
28. Ibid.
29. PricewaterhouseCoopers (2007). Global entertainment and media outlook 2007-2011 - Video games. New York: PwC.
30. Terdiman, D. (2007). Online gaming hits its groove. CNET News. Accessed September 12, 2009, at http://news.cnet.com/Online-gaming-hits-its-groove/2100-1043_3-6206970.html.
31. Blenford, A. (September 15, 2009). New Africa broadband ready. BBC News. Accessed September 28, 2009, at http://news.bbc.co.uk/2/hi/technology/8257038.stm.
32. Horrigan, J. (June, 2009). Home broadband adoption. Pew Internet. Accessed August 19, 2009, at http://www.pewinternet.org/Reports/2009/10-Home-Broadband-Adoption-2009.aspx.
33. ——— (April 6, 2009). Europe tops broadband penetration poll. Accessed August 4, 2009, at http://www.netimperative.com/news/2009/april/europe-tops-broadband-penetration-poll.
34. Hagel, J. & Brown, J. S. (2005). From push to pull: Emerging models for mobilizing resources. Accessed September 14, 2007, at http://www.johnseelybrown.com/pushmepullyou4.72.pdf.
35. PricewaterhouseCoopers (2007). Global entertainment and media outlook 2007-2011 - Global overview. New York: PwC.
36. PricewaterhouseCoopers (2007). Global entertainment and media outlook 2007-2011 - Global overview. New York: PwC.
37. Goode, A. (May 18, 2007). Press release: Mobile payments to generate almost $22bn of trans-actions by 2011 and be adopted by 204m mobile phone users. Accessed September 12, 2007, at http://www.juniperresearch.com/shop/viewpressrelease.php?id=88&pr=52>.
38. ——— (2002). That’s entertainment: Media conglomerates go global. Accessed September 14, 2007, at http://knowledge.wharton.upenn.edu/article.cfm?articleid=518&CFID=37203086&CFTOKEN=91529408&jsessionid=9a30405ca182336b1322.
39. Cooper-Chen, A. (2005). The world of television. Global Entertainment Media: Content, Audi-ences, Issues. Mahwah, NJ: Lawrence Erlbaum & Associates.
40. Blumler, J. G. & Katz, E. (1974). The uses of mass communication. Newbury Park, CA: Sage.
41. McCombs, M. & Shaw, D. (Summer 1972). The agenda-setting function of mass media. The Public Opinion Quarterly 36:2, 176-187.
INTERNET RESOURCES
- 1. Forecast 2007: Radio. http://www.mediaweek.com/mw/news/tvstations/article_display.jsp?vnu_content_id=1003526034.
- 2. Courtney Love Does the Math (wherein CL, writing on Salon.com, explains how an album could make $11 million and the band is still flippin’ burgers for a day job). http://archive.salon.com/tech/feature/2000/06/14/love/print.html.
- 3.Impact of Radio Play on Music Sales, preliminary version of econometric study by Stan Liebowitz. http://www.ftc.gov/be/seminardocs/060928liebowitzimpactradioplay.pdf.
- 4. Podmetrics. Radio Format Trends.http://podmetrics.wordpress.com/2007/04/12/radio-format-trends-2012-4112007.
- 5. Video Games as Art. http://crave.cnet.com/8301-1_105-9769761-1.html?tag=nl.e501.