11. Option Risk Management
In this chapter, we incorporate options into the portfolio risk model. The nonlinear payoff in options creates asymmetry in the portfolio return distribution, even if the return on the underlying asset follows a symmetric distribution. Getting a handle on this asymmetry is a key theme of this chapter. We first establish a delta-based approach to portfolio risk management. The idea behind this approach is to linearize the option return using the option delta but unfortunately it ignores asymmetry. We next use the gamma of an option to construct a quadratic model of the portfolio return distribution that can capture asymmetry. We finally measure the risk of options using the full valuation method, which relies on an accurate but computationally intensive version of Monte Carlo simulation.
Keywords: Option delta, option gamma, linear model, quadratic model, full valuation
1. Chapter Overview
In the previous chapter, we gave a brief overview of various models for pricing options. In this chapter, we turn our attention to the key task of incorporating derivative securities into the portfolio risk model, which we developed in previous chapters. Just as the nonlinear payoff function was the key feature from the perspective of option pricing in the previous chapter, it is also driving the risk management discussion in this chapter. The nonlinear payoff creates asymmetry in the portfolio return distribution, even if the return on the underlying asset follows a symmetric distribution. Getting a handle on this asymmetry is a key theme of this chapter.
The chapter is structured as follows:
• We define the delta of an option, which provides a linear approximation to the nonlinear option price. We then present delta formulas from the various models introduced in the previous chapter.
• We establish the delta-based approach to portfolio risk management. The idea behind this approach is to linearize the option return and thereby make it fit into the risk models discussed earlier in the book. The downside of this approach is that it ignores the key asymmetry in option payoffs.
• We define the gamma of an option, which gives a second-order approximation of the option price as a function of the underlying asset price.
• We will measure the risk of options using the full valuation method, which relies on an accurate but computationally intensive version of the Monte Carlo simulation technique from Chapter 8.
• We illustrate all the suggested methods in a simple example. We then discuss a major pitfall in the use of the linear and quadratic approximations in another numerical example. This pitfall, in turn, motivates the use of the full valuation model.
2. The Option Delta
The delta of an option is defined as the partial derivative of the option price with respect to the underlying asset price, St. For puts and calls, we define

Figure 11.1 illustrates the familiar tangent interpretation of a partial derivative. The option price for a generic underlying asset price, S, is approximated by
 |
| Figure 11.1 |
The delta of an option (in this case, a call option) can be viewed as providing a linear approximation (around the current asset price) to the nonlinear option price, where the approximation is reasonably good for asset prices close to the current price but gets gradually worse for prices that deviate significantly from the current price, as Figure 11.1 illustrates. To a risk manager, the poor approximation of delta to the true option price for large underlying price changes is clearly unsettling. Risk management is all about large price changes, and we will therefore consider more accurate approximations here.
2.1. The Black-Scholes-Merton Model
Recall, from the previous chapter, the Black-Scholes-Merton (BSM) formula for a European call option price
For a European put option, we have the put-call parity stating that
In the case where a dividend or interest is paid on the underlying asset at a rate of q per day, the deltas will be
The deltas of the European call and put options from the BSM model are shown in Figure 11.2 for X = 100 and for St varying from 75 to 125. Notice that delta changes most dramatically when the option is close to at-the-money—that is, when St ≈ X. A risk management model that relies on a fixed initial delta is therefore likely to be misleading when the portfolio contains a significant number of at-the-money options.
 |
| Figure 11.2 |
Figure 11.3 shows the delta of three call options with different strike prices (X = 80, 100, and 120, respectively) plotted against maturity,  , ranging from 1 to 365 calendar days on the horizontal axis. The asset price St is held fixed at 100 throughout the graph.
 |
| Figure 11.3 |
Notice when the maturity gets shorter (we move from right to left in the graph), the deltas diverge: the delta from the in-the-money call option increases to 1, the delta from the out-of-the-money option decreases to 0, and the delta from the at-the-money option converges to 0.5. An in-the-money call option with short maturity is almost certain to pay off St − X, which is why its price moves in tandem with the asset price St and its delta is close to 1. An out-of-the-money option with short maturity is almost certain to pay 0, so that its price is virtually constant and its delta is close to 0.
2.2. The Binomial Tree Model
Option deltas can also be computed using binomial trees. This is particularly important for American put options for which early exercise may be optimal, which will impact the current option price and also the option delta. Table 11.1 shows the binomial tree example from Table 10.4 in Chapter 10. The black font again shows the American put option price at each node. The green font now shows the option delta.
The delta at point A (that is at present) can be computed very easily in binomial trees simply as
2.3. The Gram-Charlier Model
As the delta is a partial derivative of an option pricing model with respect to the underlying asset price, it is fundamentally model dependent. The preceding deltas were derived from the BSM model, but different option pricing models imply different formulas for the deltas. We saw in the previous chapter that the BSM model sometimes misprices traded options quite severely. We therefore want to consider using more accurate option pricing models for calculating the options delta.
In the case of the Gram-Charlier option pricing model, we have


2.4. The GARCH Option Pricing Models
Calculating deltas from the general GARCH option pricing model, we are immediately faced with the issue that the option price is not available in closed form but must be simulated. We have in general
The partial derivative of the GARCH option price with respect to the underlying asset price can be shown to be
The GARCH delta must also be found by simulation as
In the special case of the closed-form GARCH process, we have the European call option pricing formula
3. Portfolio Risk Using Delta
Equipped with a formula for delta from our option pricing formula of choice, we are now ready to adapt our portfolio distribution model from earlier chapters to include portfolios of options.
Consider a portfolio consisting of just one (long) call option on a stock. The change in the dollar value (or the dollar return) of the option portfolio,  is then just the change in the value of the option
The upshot of this formula is that we can write the change in the dollar value of the option as a known value δt times the future return of the underlying asset, Rt + 1, if we rely on the delta approximation to the option pricing formula.
Notice that a portfolio consisting of an option on a stock corresponds to a stock portfolio with δ shares. Similarly, we can think of holdings in the underlying asset as having a delta of 1 per share of the underlying asset. Trivially, the derivative of a stock price with respect to the stock price is 1. Thus, holding one share corresponds to having δ = 1, and holding 100 shares corresponds to having δ = 100.
Similarly, a short position of 10 identical calls corresponds to setting  , where δc is the delta of each call option. The delta of a short position in call options is negative, and the delta of a short position in put options is positive as the delta of a put option itself is negative.
The variance of the portfolio in the delta-based model is
Assuming conditional normality, the dollar Value-at-Risk (VaR) in this case is
In case we are holding a portfolio of several options on the same underlying asset, we can simply add up the deltas. The delta of a portfolio of options on the same underlying asset is just the weighted sum of the individual deltas as in
In this delta-based model, the variance of the dollar change in the portfolio value is again
Under conditional normality, the dollar VaR of the portfolio is again just
Thus, in this case, we can use the Gaussian risk management framework established in Chapter 4 and Chapter 7 without modification. The linearization of the option prices through the use of delta, together with the assumption of normality, makes the calculation of the VaR and other risk measures very easy.
Notice that if we allow for the standard deviations,  to be time varying as in GARCH, then the option deltas should ideally be calculated from the GARCH model also. We recall that for horizons beyond one day, the GARCH returns are no longer normal, in which case the return distribution must be simulated. We will discuss simulation-based approaches to option risk management later. When volatility is assumed to be constant and returns are assumed to be normally distributed, we can calculate the dollar VaR at horizon K by
4. The Option Gamma
The linearization of the option price using the delta approach outlined here often does not offer a sufficiently accurate description of the risk from the option. When the underlying asset price makes a large upward move in a short time, the call option price will increase by more than the delta approximation would suggest. Figure 11.1 illustrates this point. If the underlying price today is $100 and it moves to $115, then the nonlinear option price increase is substantially larger than the linear increase in the delta approximation. Risk managers, of course, care deeply about large moves in asset prices and this shortcoming of the delta approximation is therefore a serious issue. A possible solution to this problem is to apply a quadratic rather than just a linear approximation to the option price. The quadratic approximation attempts to accommodate part of the error made by the linear delta approximation.
The Greek letter gamma, γ, is used to denote the rate of change of δ with respect to the price of the underlying asset, that is,
 |
| Figure 11.4 |
The gamma approximation is shown along with the model option price. The model option price is approximated by the second-order Taylor expansion
For a European call or put on an underlying asset paying a cash flow at the rate q, and relying on the BSM model, the gamma can be derived as
Figure 11.5 shows the gamma for an option using the BSM model with parameters as in Figure 11.2 where we plotted the deltas.
 |
| Figure 11.5 |
When the option is close to at-the-money, the gamma is relatively large and when the option is deep out-of-the-money or deep in-the-money the gamma is relatively small. This is because the nonlinearity of the option price is highest when the option is close to at-the-money. Deep in-the-money call option prices move virtually one-for-one with the price of the underlying asset because the options will almost surely be exercised. Deep out-of-the-money options will almost surely not be exercised, and they are therefore virtually worthless regardless of changes in the underlying asset price.
All this, in turn, implies that for European options, ignoring gamma is most crucial for at-the-money options. For these options, the linear delta-based model can be highly misleading.
Finally, we note that gamma can be computed using binomial trees as well. Table 11.2 shows the gamma for the American put option from Table 11.1.
The formula used for gamma in the tree is simply
5. Portfolio Risk Using Gamma
In the previous delta-based model, when considering a portfolio consisting of options on one underlying asset, we have

5.1. The Cornish-Fisher Approximation
If we assume that the underlying asset return, Rt + 1, is normally distributed with mean zero and constant variance σ2, and rely on the preceding quadratic approximation, then the first three moments of the distribution of changes in the value of a portfolio of options can be written as


The K-day horizon moments can be calculated by scaling σ by  everywhere.
Notice that because the change in the portfolio value now depends on the squares of the individual returns, the portfolio return is no longer normally distributed, even if the underlying asset return is normally distributed. In particular, we notice that even if the underlying return has mean zero, the portfolio mean is no longer zero. More important, the variance formula changes and the portfolio skewness is no longer zero, even if the underlying asset has no skewness. The asymmetry of the options payoff itself creates asymmetry in the portfolio distribution. The linear-normal model presented earlier fails to capture this skewness, but the quadratic model considered here captures the skewness at least approximately. In this way, the quadratic model can offer a distinct improvement over the linear model.
The approximate Value-at-Risk of the portfolio can be calculated using the Cornish-Fisher approach discussed in Chapter 6. The Cornish-Fisher VaR allowing for skewness is
Unfortunately, the analytical formulas for the moments of options portfolios with many underlying assets are quite cumbersome, and they rely on the unrealistic assumption of normality and constant variance. We will therefore now consider a much more general but simulation-based technique that builds on the Monte Carlo method introduced in Chapter 8. Later, we will illustrate the Cornish-Fisher quadratic VaR in a numerical example.
5.2. The Simulation-Based Gamma Approximation
Consider again the simple case where the portfolio consists of options on only one underlying asset and we are interested in the K-day $VaR. We have
In the general case of options on n underlying assets, we have
If we in addition allow for derivatives that depend on several underlying assets, then we write
We now simulate a vector of underlying returns from the multivariate distribution
The great benefit of this approach is that we are aggregating all the options on one particular asset into a delta and a gamma for that asset. Thus, if the portfolio consists of a thousand different types of option contracts, but only written on 100 different underlying assets, then the dimension of the approximated portfolio distribution is only 100.
As these formulas suggest, we could, in principle, simulate the distribution of the future asset returns at any horizon and calculate the portfolio Value-at-Risk for that horizon. However, a key problem with the delta and the delta-gamma approaches is that if we calculate the VaR for a horizon longer than one day, the delta and gamma numbers may not be reliable approximations to the risk of the option position because they are assumed to be constant through time when in reality they are not. We therefore next consider an approach that is computationally intensive, but does not suffer from the problems arising from approximating the options by delta and gamma.
6. Portfolio Risk Using Full Valuation
Linear and quadratic approximations to the nonlinearity arising from options can in some cases give a highly misleading picture of the risk from options. Particularly, if the portfolio contains options with different strike prices, then problems are likely to arise. We will give an explicit example of this type of problem.
In such complex portfolios, we may be forced to calculate the risk measure using what we will call full valuation. Full valuation consists of simulating future hypothetical underlying asset prices and using the option pricing model to calculate the corresponding future hypothetical option prices. For each hypothetical future asset price, every option written on that asset must be priced. While full valuation is precise, it is unfortunately also computationally intensive. Full valuation can, in principle, be done with any of the option pricing models discussed in Chapter 10.
6.1. The Single Underlying Asset Case
Consider first the simple case where our position consists of a short position in one call option. The dollar return at horizon K can be written
The τ is the risk horizon measured in calendar days because the option maturity,  is measured in calendar days. The risk management horizon in trading days is denoted by K. For example, if we have a two-week $VaR horizon, then K is 10 and τ is 14.
We can think of full valuation as pretending that we have arrived on the risk management horizon date and want to price all the options in the portfolio. As we do not know the price of the underlying asset K days into the future, we value the options for a range of hypothetical future prices of the underlying. Assuming a particular physical distribution of the return on the underlying asset, and applying the Monte Carlo method discussed in Chapter 8, we can simulate future hypothetical returns on the underlying asset
We can now calculate the hypothetical changes in the portfolio value as
6.2. The General Case
More generally, consider again the portfolio of linear assets such as stocks. We have
If we add, for example, call options to the portfolio, we would have

The Value-at-Risk from full valuation can be calculated from simulation again. Using the model for the returns distribution, we can simulate future returns and thus future asset prices
The full valuation approach has the benefit of being conceptually very simple; furthermore it does not rely on approximations to the option price. It does, however, require much more computational effort as all the future hypothetical prices of every option contract have to be calculated for every simulated future underlying asset price. Considerations of computational speed therefore sometimes dictate the choice between the more precise but slow full valuation method and the approximation methods, which are faster to implement.
7. A Simple Example
To illustrate the three approaches to option risk management, consider the following example. On January 6, 2010, we want to compute the 10-day $VaR of a portfolio consisting of a short position in one S&P 500 call option. The option has 43 calendar days to maturity, and it has a strike price of  . The price of the option is
  , and the underlying index is
  . The expected flow of dividends per day is
  , and the risk-free interest rate is
  per day. For simplicity, we assume a constant standard deviation of 1.5% per calendar day (for option pricing and delta calculation) or equivalently
  per trading day (for calculating VaR in trading days). We will use the BSM model for calculating
  as well as the full valuation option prices. We thus have


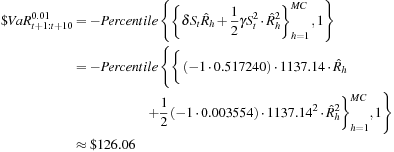
In the delta-based model, the dollar VaR is

Using the quadratic model and relying on the Cornish-Fisher approximation to the portfolio dollar return distribution, we calculate the first three moments for the K-day change in portfolio values, when the underlying return follows the  distribution. Setting K = 10, we get

Using instead the simulated quadratic model, we generate 5000 10-trading day returns,  with a standard deviation of
  . Using the δ and γ calculated earlier, we find
Finally, we can use the full valuation approach to find the most accurate VaR. Using the simulated asset returns  to calculate hypothetical future stock prices,
  we calculate the simulated option portfolio value changes as

In this example, the full valuation VaR is slightly higher than the quadratic VaR. The quadratic VaR thus provides a pretty good approximation in this simple portfolio of one option.
To gain further insight into the difference among the three VaRs, we plot the entire distribution of the hypothetical future 10-day portfolio dollar returns under the three models. Figure 11.6 shows a normal distribution with mean zero and variance  .
.
 |
| Figure 11.6 |
Figure 11.7 shows the histogram from the quadratic model using the 5000 simulated portfolio returns.
 |
| Figure 11.7 |
Finally, Figure 11.8 shows the histogram of the 5000 simulated full valuation dollar returns. Notice the stark differences between the delta-based method and the other two. The linear model assumes a normal distribution where there is no skewness. The quadratic model allows for skewness arising from the gamma of the option. The portfolio dollar return distribution has a negative skewness of around −1.29.
 |
| Figure 11.8 |
Finally, the full valuation distribution is slightly more skewed at −1.42. The difference in skewness arises from the asymmetry of the distribution now being simulated directly from the option returns rather than being approximated by the gamma of the option.
Further details on all the calculations in this section can be found on the web site.
8. Pitfall in the Delta and Gamma Approaches
While the previous example suggests that the quadratic approximation yields a good approximation to the true option portfolio distribution, we now show a different example, which illustrates that even the gamma approximation can sometimes be highly misleading.
To illustrate the potential problem with the approximations, consider an option portfolio that consists of three types of options all on the same asset, and that has a price of  , all with
  calendar days to maturity. The risk-free rate is
  and the volatility is
  per calendar day. We take a short position in 1 put with a strike of 95, a short position in 1.5 calls with a strike of 95, and a long position in 2.5 calls with a strike of 105. Using the BSM model to calculate the delta and gamma of the individual options, we get
| Type of Option | Put | Call | Call |
|---|---|---|---|
| Strike, Xj | 95 | 95 | 105 |
| Option Price | 1.1698 | 6.3155 | 1.3806 |
| Delta, δj | −0.2403 | 0.7597 | 0.2892 |
| Gamma, γj | 0.03919 | 0.03919 | 0.04307 |
| Position, mj | −1 | −1.5 | 2.5 |
We are now interested in assessing the accuracy of the delta and gamma approximation for the portfolio over a five trading day or equivalently seven calendar day horizon. Rather than computing VaRs, we will take a closer look at the complete payoff profile of the portfolio for different future values of the underlying asset price,  We refer to the value of the portfolio today as
  and to the hypothetical future value as
  .
.
We first calculate the value of the portfolio today as
Now, the delta approximation to the portfolio value in five trading days is easily calculated as
The gamma of the portfolio is

Finally, relying on full valuation, we must calculate the future hypothetical portfolio values as

Letting the hypothetical future underlying stock price vary from 85 to 115, the three-option portfolio values are shown in Figure 11.9. Notice how the exact portfolio value is akin to a third-order polynomial. The nonlinearity is arising from the fact that we have two strike prices. Both approximations are fairly poor when the stock price makes a large move, and the gamma-based model is even worse than the delta-based approximation when the stock price drops. Further details on all the calculations in this section can be found on the web site.
 |
| Figure 11.9 |
The important lesson of this three-option example is as follows: The different strike prices and the different exposures to the underlying asset price around the different strikes create higher order nonlinearities, which are not well captured by the simple linear and quadratic approximations. In realistic option portfolios consisting of thousands of contracts, there may be no alternative to using the full valuation method.
9. Summary
This chapter has presented three methods for incorporating options into the risk management model.
First, the delta-based approach consists of a complete linearization of the nonlinearity in the options. This crude approximation essentially allows us to use the methods in the previous chapters without modification. We just have to use the option's delta when calculating the portfolio weight of the option.
Second, we considered the quadratic, gamma-based approach, which attempts to capture the nonlinearity of the option while still mapping the option returns into the underlying asset returns. In general, we have to rely on simulation to calculate the portfolio distribution using the gamma approach, but we only simulate the underlying returns and not the option prices.
The third approach is referred to as full valuation. It avoids approximating the option price, but it involves much more computational work. We simulate returns on the underlying asset and then use an option pricing model to value each option in the portfolio for each of the future hypothetical underlying asset prices.
In a simple example of a portfolio consisting of just one short call option, we showed how a relatively large gamma would cause the delta-based VaR to differ substantially from the gamma and full valuation VaRs.
In another example involving a portfolio of three options with different strike prices and with large variations in the delta across the strike prices, we saw how the gamma and delta approaches were both quite misleading with respect to the future payoff profile of the options portfolio.
The main lesson from the chapter is that for nontrivial options portfolios and for risk management horizons beyond just a few days, the full valuation approach may be the only reliable choice.
Further Resources
The delta, gamma, and other risk measures are introduced and discussed in detail in Hull (2011). Backus et al. (1997) give the formula for delta in the Gram-Charlier model. Duan (1995) provided the delta in the GARCH option pricing model. Garcia and Renault (1998) discussed further the calculation of delta in the GARCH option pricing model. Heston and Nandi (2000) provided the formula for delta in the closed-form GARCH option pricing model.
Risk measurement in options portfolios has also been studied in Alexander et al. (2006), Sorwar and Dowd (2010) and Simonato (2011).
The sample portfolio used to illustrate the pitfalls in the use of the delta and gamma approximations is taken from Britten-Jones and Schaefer (1999), which also contains the analytical VaR formulas for the gamma approach assuming normality.
The important issue of accuracy versus computation speed in the full valuation versus delta and gamma approaches is analyzed in Pritsker (1997).
In this and the previous chapter, we have focused attention on European options. American options and many types of exotic options can be priced using binomial trees as we discussed in the last chapter. Deltas and gammas can be calculated from the tree approach as well as we have seen in this chapter. Hull (2011) contains a thorough introduction to binomial trees as an approximation to the normal distribution with constant variance. Ritchken and Trevor (1999) price American options under GARCH using a time-varying trinomial tree. Duan and Simonato (2001) priced American options under GARCH using instead a Markov chain simulation approach. Longstaff and Schwartz (2001) established a convenient least squares Monte Carlo method for pricing American and certain exotic options. See also Stentoft (2008) and Weber and Prokopczuk (2011) for methods to value American options in a GARCH framework.
Derman (1999), Derman and Kani (1994) and Rubinstein (1994) suggested binomial trees, which allow for implied volatility smiles as in the IVF approach in the previous chapter.
Whether one relies on the delta, gamma, or full valuation approach, an option pricing model is needed to measure the risk of the option position. Because all models are inevitably approximations, they introduce an extra source of risk referred to as model risk. Analysis of the various aspects of model risk can be found in Gibson (2000).
References
Alexander, S.; Coleman, T.; Li, Y., Minimizing CVaR and VaR for a portfolio of derivatives, J. Bank. Finance 30 (2006) 583–605.
Backus, D.; Foresi, S.; Li, K.; Wu, L., Accounting for biases in Black-Scholes. (1997) The Stern School at NYU; Manuscript.
Britten-Jones, M.; Schaefer, S., Non-linear value at risk, Eur. Finance Rev. 2 (1999) 161–187.
Derman, E., Regimes of volatility, Risk April 12 (1999) 55–59.
Derman, E.; Kani, I., The volatility smile and its implied tree, In: Quantitative Strategies Research Note (1994) Goldman Sachs.
Duan, J., The GARCH option pricing model, Math. Finance 5 (1995) 13–32.
Duan, J.; Simonato, J., American option pricing under GARCH by a Markov chain approximation, J. Econ. Dyn. Control 25 (2001) 1689–1718.
Garcia, R.; Renault, E., A note on hedging in ARCH and stochastic volatility option pricing models, Math. Finance 8 (1998) 153–161.
Gibson, R., Model Risk: Concepts, Calibration and Pricing. (2000) Risk Books, London.
Heston, S.; Nandi, S., A closed-form GARCH option pricing model, Rev. Financ. Stud. 13 (2000) 585–626.
Hull, J., Options, Futures and Other Derivatives. eighth ed (2011) Prentice-Hall, Upper Saddle River, NJ.
Longstaff, F.; Schwartz, E., Valuing American options by simulation: A simple least squares approach, Rev. Financ. Stud. 14 (2001) 113–147.
Pritsker, M., Evaluating value at risk methodologies: Accuracy versus computational time, J. Financ. Serv. Res. 12 (1997) 201–241.
Ritchken, P.; Trevor, R., Pricing options under generalized GARCH and stochastic volatility processes, J. Finance 54 (1999) 377–402.
Rubinstein, M., Implied binomial trees, J. Finance 49 (1994) 771–818.
Simonato, J.-G., The performance of Johnson distributions for computing value at risk and expected shortfall, Available from: SSRN,http://ssrn.com/abstract=1706409 (2011).
Sorwar, G.; Dowd, K., Estimating financial risk measures for options, J. Bank. Finance 34 (2010) 1982–1992.
Stentoft, L., American option pricing using GARCH models and the normal inverse Gaussian distribution, J. Financ. Econom. 6 (2008) 540–582.
Weber, M.; Prokopczuk, M., American option valuation: Implied calibration of GARCH pricing models, J. Futures Mark. (2011); forthcoming.
Open the Chapter11Data.xlsx file from the web site. The file contains European call options on the S&P 500 from January 6, 2010.
1. Assume a volatility of  per calendar day for option pricing and a volatility of
  per trading day for return volatility. Calculate the delta and gamma of a short position of one option. Do this for every option in the sample. Calculate the delta-based portfolio variance for each option and the 10-trading-day (that is, 14-calendar-day) 1% delta-based dollar VaR for each option.
2. Assume a portfolio that consists of a short position of one in each of the option contracts. Calculate the 10-day, 1% dollar VaRs using the delta-based and the gamma-based models. Assume a normal distribution with the variance as in exercise 1. Use MC = 5, 000 simulated returns for the 10-trading-day return. Compare the simulated quadratic VaR with the one using the Cornish-Fisher expansion formula.
3. Assume a short position of one option contract with 43 days to maturity and a strike price of  . Using the preceding
  random normal numbers, calculate the changes in the 10-day portfolio value according to the delta-based, the gamma-based, and the full valuation approach. Calculate the 10-day, 1% dollar VaRs using the simulated data from the three approaches. Make histograms of the distributions of the changes in the portfolio value for these three approaches using the simulated data. Calculate the Cornish-Fisher VaR as well.
4. Replicate Figure 11.9.
The answers to these exercises can be found in the Chapter11Results.xlsx file on the companion site.
For more information see the companion site at http://www.elsevierdirect.com/companions/9780123744487
..................Content has been hidden....................
You can't read the all page of ebook, please click here login for view all page.