
CHAPTER
6
Phase IV: Implementing the New Process and Phase V: Continuous Improvement
When you have an excellent future-state process design, the project is 30 percent complete.
—H. James Harrington
Introduction
We have tried to provide you with detailed information on how to develop a breakthrough future-state solution that has made this book already too long. As a result, we are going to just glance over Phases IV and V. If you would like more detail on these phases, we recommend you read Chapter 7, “Measurement, Feedback and Action,” and Chapter 8, “Process Qualification,” in Business Process Improvement (Harrington, 1991).
Phase IV: Implementing the New Process
Even if you’re on the right track, you’ll get run over if you just sit there.
—Will Rogers
During this phase, an implementation team is pulled together to install the selected process, measurement systems, and control systems. The new in-process measurement and control systems will be designed to ensure that there is immediate feedback to the employees, enabling them to contain the gains that have been made and to improve the process further. As Figure 6.1 shows, this phase consists of six activities:
• Activity 1: Prepare the Final Implementation Plan
• Activity 2: Implement the New Process
• Activity 3: Install In-Process Measurement Systems
• Activity 4: Install Feedback Data Systems
• Activity 5: Transfer the Project
• Activity 6: Conduct Phase IV Tollgate
We underestimated the amount of communication required.
—Harry Beeth, Assistant Controller,
IBM Corporate Headquarters
(CFO, 1996)
Phase IV: Activity 1: Prepare the Final Implementation Plan
It is extremely difficult to migrate from the current state to the future-state solution without a good understanding of the current state. By understanding the current state and comparing it with the future-state solution, the magnitude of the change can be identified, and proper change management activities can be put in place to break down resistance and to build support.
An implementation team is formed to prepare a detailed implementation plan and coordinate the changes. It may or may not include all the members of the original PIT. Often, Department Improvement Teams (DITs) become part of the implementation plan so that the teams within the functions that will be impacted by the change are part of the group that plans and implements the change.
Implementation is usually the most difficult part of the SPI process because the future-state solution is often a radical change from the way the process is presently organized. This means that the implementation team needs to very carefully consider these questions:
• How will the users of the process react during the transition period?
• How will the training be accomplished?
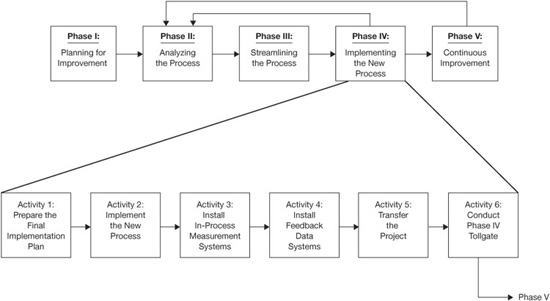
Figure 6.1 Phase IV: Implementing the New Process
• What infrastructure changes need to be made?
• How will the interruption to the process flow be minimized?
• Will productivity decrease during the transition period as it usually does, and how will this additional workload be handled?
• What will be done to involve the people that will own and control the process during implementation?
• How will the impact on the employees’ morale and customer satisfaction be measured?
• Will the users have the required background and skills to effectively use the process?
• How will the surplus in materials and people be handled?
• What changes in technology, systems, and equipment will be needed in the process and supporting processes?
• What other activities are going on in the organization that will impact the process during the transition period?
• Are people available with the required skills to perform the transition?
• How will the social and psychological impact on the process users be handled?
Sometimes the implementation team is divided into subteams (example: information system teams). The implementation plan usually is divided into three parts (see Figure 6.2):
1. Short-term changes. Changes that can be done in 30 days
2. Midterm changes. Changes that can be done in 90 days
3. Long-term changes. Changes that require more than 90 days to implement
A very formal project plan should be prepared for Phase IV that includes an implementation plan and a measurement plan for each change. Also the change management plan needs to be updated to reflect the culture changes that the new process will require. Based upon the outputs from this new planning cycle, the project budget will be updated.
The implementation team should present the new plan and budget to the executive team members for their final approval. This is necessary to ensure that both the implementation team and the executive team are committed to the success of the project.
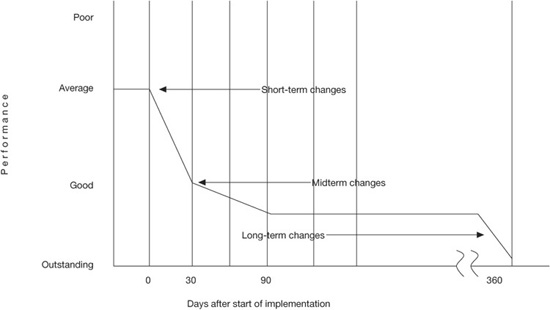
Figure 6.2 Future-state process implementation plan
Phase IV: Activity 2: Install the New Process
The implementation plan and the change management plan are now united to bring about an effective overall implementation of the new process. The implementation team will maintain close control over each change to be sure that it is implemented correctly. Often, complex changes will go through a series of modeling or prototyping cycles to prove out the concept and to ensure smooth implementation. After each change is installed, its impact is measured to ensure it accomplishes its intent and has a positive impact upon the total process. As the change is implemented, the simulation model is updated so that it always reflects the present process.
People truly understand the amount of communication required to get buy-in. Let people know what is going on and why. What the new world will look like and how they will fit into it.
—Paulette Everhart, EDS Corporate Controller (CFO, 1996)
Phase IV: Activity 3: Install In-Process Measurement Systems
The carpenter’s rule is measure twice, cut once.
Before you can design a measurement system, you need to define requirements. Each activity on the final flowchart should be analyzed to define what the customer requirements are and how compliance to these requirements can be effectively evaluated. You will note that up to this point the measurement system focused on the total process. Now the task is to develop measurements and controls for each major activity within the process. (See Figure 6.3.)
A good measurement and feedback system is one in which the measurements are made as close to the activity as possible. Self-measurement is best because there is no delay in corrective action. Often, however, self-measurements are not practical or possible.
Poor-Quality Cost
In his book Applications of Quality Control in the Service Industry, A. C. Rosander (1985) reported that 25 percent of a bank’s total operating costs were devoted to poor-quality cost. He estimated that the opportunity is broken down in the banking industry as follows:

Figure 6.3 Putting the measurement points close to the activity that it is measuring
• Preventive savings—2 percent
• Appraisal savings—28 percent
• Internal error savings—41 percent
• External error savings—29 percent
Waste costs money. In many business processes, poor-quality costs run as high as 80 percent of the budget. Poor-quality costs of 50 percent or more are common in business processes before SPI is applied to them. For example, at IBM the accounts receivable poor-quality cost was running 63 percent of the budget before the process was streamlined. If that is cut by 50 percent through the use of SPI, the process is still wasting 40 percent of the organization’s budget and is a gold mine for future continuous improvement.
There is a big difference between the quality cost and the poor-quality cost systems. The quality cost system was developed in the 1950s by Val Feigenbaum. It was divided into four elements:
• Prevention cost
• Appraisal cost
• Internal defect cost
• External defect cost
With the focus on what the organization was losing due to poor quality, this was an acceptable approach. But today our survival depends on how well we are servicing our customers. As a result, the poor-quality cost system was developed and used by IBM. It incorporated eight elements:
• Prevention cost
• Appraisal cost
• Internal error cost
• External error cost
• Customer incurred cost
• Customer dissatisfaction cost
• Loss-of-reputation cost
• Lost opportunity cost
The poor-quality cost for the customer is often greater than the organization’s cost related to an error that the organization makes. It is therefore very important to include all the costs related to an error in order to define its importance. More information on the poor-quality cost system can be found in the book Poor-Quality Cost (Harrington, 1987).
Phase IV: Activity 4: Install Feedback Data Systems
Measurement without feedback to the person performing the task is just another no-value-added activity. Feedback always comes before improvement. (See Figure 6.4.) In most organizations, too much data are collected and too little are used. Employees need ongoing positive and negative feedback about their output.
Figure 6.5 is an example of the results we received when we started giving feedback to each individual on the number of errors he or she created weekly. You will note that after 15 weeks, 10 out of 13 people went a week without creating an error, and for 2 out of the other 3 people the error rate was cut in half.
Although we need ongoing feedback to the employees involved in the process, we also need summary reports for the same people and for management. The summary reports should be exception reports so that masses of data do not waste management’s and the employee’s time. Exception reporting allows everyone to focus in on where improvements can be made.
Phase IV: Activity 5: Transfer the Project
The PIT and the implementation team have been driving the process transformation to this point in the project. As we end Phase IV, the process needs to be developed to the point that it has a management and control system in place that is not part of the SPI project. This means that the organization’s standard infrastructure has to be ready and budgeted to accept the responsibilities for sustaining the gains and continuously improving the total performance of the new process. All too often the implementation team does a good job of installing the new process, but the team considers its job done once the new process is put in place and the people are trained to use it. This is a terrible mistake.

Figure 6.4 Activity 4: Install Feedback Data Systems

Figure 6.5 Typical results of individual feedback
This installation is not complete until the established infrastructure is in place to ensure the process will continue to improve. Questions like the following need to be answered, and the activities need to be staffed and budgeted.
• Who is responsible for the performance of the total process?
• Who will record the measurement data?
• Who will control the process?
• Who will generate the reports?
• How will new people be trained?
• Who will analyze the data and take action to correct problems?
• Who will update the process documentation?
• How will changes in customer requirements be understood and be reflected back into the process?
• How will suboptimization be controlled?
• What are the roles and responsibilities of the owners of the sub-processes that make up the total process?
• Who will audit the process, and how will it be audited?
These are typical questions that need to be addressed, and the answers need to be documented before the implementation is complete and the project implementation team can be disbanded.
All too often the new process performs well when it is getting special attention, but falls apart when the project team is reassigned.
—H. James Harrington
This is your process, so don’t let them hand you a process that doesn’t work. Get involved and make sure it does.
—Thomas Young, Dun & Bradstreet Corporate Controller (CFO, 1996)
Phase IV: Activity 6: Conduct Phase IV Tollgate
At the end of Phase IV it is an excellent time to do a complete review of the Phase IV deliverables. The tollgate should be chaired by the project sponsor, and the total EIT should be invited to attend. During this tollgate, the following questions should be addressed:
• Has the change met the goals set in the project plan?
• Was the cost to implement the change more or less what it was estimated to be?
• Did the change take more time to implement than projected?
• Is the ROI great enough to justify the change?
• Did the change management activities prepare the employees for the change?
• Is the future-state solution in keeping with the organization’s culture and its long-range plan?
• Is the project transfer complete, and are the managers who are responsible for the process and the supporting processes during Phase V ready to take over total responsibility for their parts of the process?
• Are the budgets that are required to support the new process in place?
When these questions are answered in the affirmative, the project is ready to move into the continuous improvement phase. You can’t exit Phase IV without an approved Phase V plan and budget plus an assigned implementation team.
Don’t forget to reward the Implementation Team members if they did an excellent job.
—H. James Harrington
Phase V: Continuous Improvement
When you stop improving, you start slipping backwards.
—H. James Harrington
This phase consists of three activities (see Figure 6.6.):
• Activity 1: Maintain the Gains
• Activity 2: Implement Area Activity Analysis
• Activity 3: Qualify the Process

Figure 6.6 Phase V: Continuous Improvement
Figure 6.7 shows two processes that went through breakthrough improvement. One had continuous improvement after the breakthrough, while the other one didn’t focus on continuous improvement.
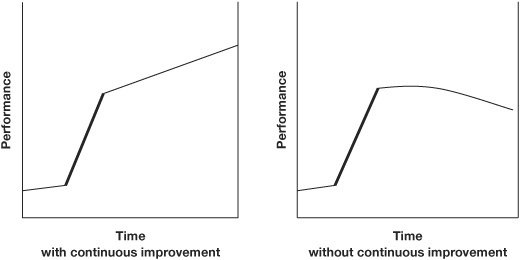
Figure 6.7 Two processes that have gone through breakthrough improvement—one with continuous improvement applied after the breakthrough and one without it
Phase V: Activity 1: Maintain the Gains
Organizations are typically organized in a functional structure. This places all the people who do the same kind of work in the same organizational structure. (For example, all the maintenance people are in the same function.)
Some organizations, however, have advanced to the point that they have a process structure where everyone in a major process is in the same organizational structure. (For example, the people that used to be in individual functions like production control, manufacturing, quality, manufacturing engineers, and production engineers for each major process are in the same organizational structure.) This is the ideal case for the streamlined process because the process owner has all the departments and natural work teams related to the process reporting to him or her.
Another type of organizational structure is called a matrix structure. In this case, the people working in the process have two managers—one because they are part of a functional-type organization and the other because they are part of the process. The process owner manages them from a total process standpoint, and the functional manager manages them from a technical standpoint. The matrix-type organization has become more and more popular.
Another approach to keeping the total process improving is to appoint a person as the process owner with the responsibility for measuring the total process and taking appropriate action if the process measurements aren’t improving at an acceptable rate. No matter what the organizational structure is, I strongly recommend that someone be assigned to own the process throughout the continuous improvement activities. Without a process owner who is looking at the total process cycle “across the many smokestacks,” suboptimization will slowly creep in, and the gains that were made will slowly disappear into thin air.
Phase V: Activity 2: Implement Area Activity Analysis
Now that the process has undergone a major breakthrough in performance, you cannot stop improving. This is not the end of the improvement activities; it is just the beginning. The process must continue to improve, usually at a much slower rate (10 to 20 percent per year), but it must continue to improve. The natural work teams (NWTs) now take over, working to improve their part of the process.
We recommend using Area Activity Analysis (AAA) to do this. Of course, there are other approaches like Six Sigma, TQM, and Quality Circles, but we have found that AAA does an outstanding job at driving the continuous improvement cycle. AAA is designed to cement the external and internal customer-supplier relationships.
With the AAA methodology the process is now subdivided into small parts that take place within each NWT. First, the NWT accepts its role as the supplier to the next NWT in the process. The team members then develop a set of customer requirements and meet with the receiver of their output to get their customer’s documented agreement. At this meeting the receiving NWT (customer) defines how it will feed back information on the acceptability of the inputs it receives.
The next step is for the NWT to set up effectiveness standards for its part of the process. Based upon this agreement to output requirements, the NWT evaluates its process to be sure it is capable of meeting these requirements. Typically the NWT will flowchart in detail the activities and tasks of the process that it is involved in. Then for each activity in the flowchart and for the total flowchart, the acceptable processing, cycle time, and cost are defined. The efficiency measurement of the NWT’s part of the process is documented and approved by the next-level manager and the other functions that approve and set standards for the NWT (for example, manufacturing, engineering, and finance). Typical standards would be 15 minutes to process an order, $12.25 to change a record, etc. This leads to the NWT defining the inputs that are needed in order for it to meet the output requirements.
Now the NWT puts on its “customer hat” and meets with its suppliers to obtain a documented agreement on what the supplier must produce in order to meet the NWT’s input requirements. At the same time, the NWT develops a system that gives feedback to each supplier on the acceptability of the impact of the inputs the supplier provides. The NWT now makes use of the visual office concept by putting up a performance board. (See Figure 6.8.)
This is a very simplified explanation of AAA. For more information on AAA, read Harrington, Hoffherr, and Reid’s (1998) book, Area Activity Analysis.
Phase V: Activity 3: Qualify the Process
You can’t earn this week’s paycheck with last week’s press clippings.
—H. James Harrington
Process qualification is a way to create a data base that will provide the organization with a high degree of confidence that the output from the process will meet requirements over a long time period. It will also validate that the process will be able to produce the quantity of output that is planned for at the right cost.
Is Business Process Qualification Necessary?
Manufacturing process qualification guarantees that the process design provides customers with acceptable products. As manufacturers, we wish to demonstrate consistency and quality. Each new process puts our business reputation at risk. One bad process can destroy years of hard work. Customers remember the bitterness of poor performance long after the sweetness of outstanding service has faded.

Figure 6.8 AAA performance board
Because business processes largely service internal customers, it is easy to lose sight of their importance to our overall business survival. This is where process qualification helps, by motivating us to take the first steps toward continuous improvement. Whether office professionals, clerical employees, or middle managers, people love to be recognized for their efforts and are stimulated by public acknowledgment. Process qualification provides a measurement system that instills a sense of pride within each team.
Process qualification supports the goals set forth in the beginning of the SPI effort. There is no better way of showing how serious we are than by installing a systematic business process qualification strategy.
Process qualification will motivate the process owner to keep the process improvement high on the priority list by measuring the process’s progress. If you are not improving, if you are standing still, you are not holding your own. In fact, you are sliding backward, because your competition is improving. As noted above, you can’t earn this week’s paycheck with last week’s press clippings. We use a process maturity grid to document progress and improvement. Qualifying a process typically includes these steps:
• The process is evaluated using the appropriate requirements list.
• The process owner reviews the process status.
• The process owner requests qualification-level change.
• The process owner prepares a process status report and sends it to the review committee. The EIT often serves as the review committee.
• The process owner presents the process change data to the review committee.
• The review committee chairperson issues the process qualification change letter.
• The review committee rewards the process team for its accomplishments.
Process Maturity Levels
A six-level process maturity grid can provide an effective structure and guide for the streamlining activities. (See Table 6.1.) These levels lead the process from an unknown process status to the ultimate best-of-breed classification.
Table 6.1 Six-Level Process Maturity Grid

Table 6.2 Process Maturity Grid

Until the streamlining methodology has been applied, all business processes are considered to be at level 6. As the process improves, it progresses logically up to level 1. This enables the organization to evaluate the process’s progress status. (See Table 6.2.)
A quick look at a business process overview chart provides the status of an organization’s business processes. See Table 6.3, for example. In the case of accounts payable, the organization has decided that it does not need to be at error-free certification level 3. You will note that the accounts payable process is at certification level 4 and still needs to improve to level 3. In the case of order entry, the organization wants it to be highly effective and efficient but does not require it to be world class. In this case a level 2 is acceptable. These types of decisions are usually based on business factors and priorities. As business conditions and priorities change, the decision not to be the best in all critical business processes should be addressed.
Table 6.3 Business Process Overview Chart

All processes in all organizations may not need to progress through all six levels. Often there are considerable costs involved in becoming the best. In most cases, organizations have many business processes that need to be improved. Because of the magnitude of this job, it may be wise to bring some of the processes under control and then direct the limited resources to another critical business process. Once all the critical processes are under control, PITs can be assigned to bring the most critical processes up to level 1 (world class). Frequently the people using the process will make major improvements in the process as a result of their continuous improvement activities, while the PIT is working on another process. When the EIT decides that something less than a world-class performance level is acceptable, it should communicate this information to the PIT immediately.
Ideally this decision should be made prior to forming the PIT. When management decreases its expectations late in the process cycle, it can negatively impact the PIT’s morale by being interpreted as management’s loss of faith.
Differences among Business Process Levels
To determine whether the process has evolved to the next level, eight major change areas should be addressed:
• End-customer-related measurements
• Process measurements and performance
• Supplier partnerships
• Documentation
• Training
• Benchmarking
• Process adaptability
• Continuous improvement
The following definitions will help you understand the changing expectations that must be met to change qualification levels:
• Requirements. What the customer must be supplied with
• Expectations. What the customer would like to have to do his or her job the best; what the customer thinks can reasonably be provided or can be obtained from a competitor
• Desires. What is on the customer’s wish list; what it would be nice to have but is not essential
To get the details related to the requirements for each of the levels, see Chapter 7 in Business Process Improvement (Harrington, 1991).
Does SPI Work?
You can bet on it. IBM Credit slashed its six-day turnaround cycle to four hours, decreasing the number of people required in the department while the number of deals increased over 100-fold. Not 100 percent, but 100 times.
Ford North America employed 500 people in its accounts payable department. By putting in computers to automate the process, Ford was able to cut that head count by 20 percent. Under this automated system, the Ford purchasing department sends a purchase order to the supplier with a copy to accounts payable. When the supplier ships the goods, they arrive on the back dock, at which time the back dock completes a form describing the goods and sends the form on to accounts payable. The supplier meanwhile sends accounts payable an invoice. To streamline the process, accounts payable clerks no longer match purchase orders with receiving documents, primarily because the new process eliminates the invoice entirely. The new process requires the buyer to issue the vendor a purchase order that is simultaneously entered into an online database. When the goods are received in receiving, the receiving clerk checks the computer to see whether the received shipment corresponds with the purchase order. He or she has only one choice—it does or it doesn’t. If it does, the clerk accepts the goods by pushing the acceptance button. The results of the new system were drastic; instead of 500 people, Ford now just uses 125 people. In some parts of Ford, accounts payable is just 5 percent of its former size.
Does SPI work? Just ask any of the organizations that have tried it—Ford, Boeing, IBM, 3-M, Corning, Nutrasweet, McDonnell Douglas, Federal Mogul, and Aetna—and you will get a resounding yes. The following are some typical examples of results:
• McDonnell Douglas
■ 20–40 percent overhead reduction
■ 30–70 percent inventory reduction
■ 5–25 percent material cost reduction
■ 60–90 percent quality improvement
■ 20–40 percent administrative cost reduction
• Federal Mogul
■ Reduction in development process cycle time from 20 weeks to 20 business days, resulting in a 75 percent reduction in throughput time
• Aetna Life and Casualty Co.
■ Reduction in information technology workload by 750 employee-years per year
■ Consolidation of 65 property casualty claim offices to 23
■ Rise in net income of 50 percent to $207.2 million
After redesigning its warehouse processes, Ford Motor Company now distributes auto parts faster and with fewer errors while using fewer warehouses and a quarter of the people. Rank Xerox UK realized a 20 percent revenue growth, reduced noncustomer contact jobs by nearly 30 percent, and reduced order delivery time by 36 days to 6 days following a redesign of critical business processes.
Federal Mogul reduced its new product sample development from 20 weeks to 20 days through redesigning the process.
The streamlined process improvement methodology is like a GPS that will get anyone to the correct destination when you don’t know how to get there.
—H. James Harrington
Summary
The process and the system that controls it represent the real problem facing business today, not the people who work within the boundaries set for them by management. Employees must work within the process, and management must work on the process to improve it. The improvement efforts and their supporting systems must be directed at the process and not at the individual. This means that all functions must work together to optimize the efficiency, effectiveness, and adaptability of the total process. This can best be accomplished when one person is held accountable for the performance of the total process and is given the authority to bring together members from all the individual functions involved within the process, with the objective of maximizing its total performance.
Now let’s look at how different types of organizations feel about their business processes:
Losers
• The employees are the problem. They need to be motivated.
• If everyone does his or her job, things will get done.
• Employees and management cannot be trusted. There need to be a lot of checks and balances.
• Downsizing is equally distributed across all functions. That’s the fair way to do it.
• Business processes, on an average, have 15 percent real-value-added content.
Survivors
• If each natural work team improves its part of the process, everything will be OK. It is the high number of errors that are the problem.
• Bureaucracy is something that everyone has to live with.
• Management decides to use either continuous improvement or breakthrough methodologies.
• Computerization of the business processes is used to decrease cycle time and costs.
• SPI activities are directed at reducing costs.
• Process changes that will reduce head count are kept confidential until the last minute.
• Business processes, on an average, have 30 percent real-value-added content.
Winners
• Any bureaucracy is bad.
• When downsizing is necessary, winning organizations remove the no-value-added activities from the processes. Unnecessary work is eliminated, and the associated resources are removed from the budgets.
• They never computerize until the process has been streamlined.
• They prioritize their investment in SPI activities based upon their business plan, competitive position, core competencies, and core capabilities.
When everything is perfect, remove something to upset the process and start the improvement cycle over.