
CHAPTER
5
Phase III: Streamlining the Process
You are creative when you come up with a new idea, and you become real-value-added when you implement it.
—H. James Harrington
Introduction
Wikipedia encyclopedia defines the word streamliner as follows: “a vehicle incorporating streamlining in a shape providing less resistance to air.” In SPI we refer to streamlining as a way to optimize the process that is being studied. Process optimization is the discipline of adjusting a process to optimize some specific set of parameters without violating other constraints. The most common goals are minimizing costs and maximizing throughput and effectiveness. This is one of the major qualitative tools in organizational decision making. When optimizing a process, the goal is to maximize one or more of the process specifications while keeping all others within their targeted values.
Frequently there are three parameters that can be adjusted to affect optimal performance:
• Equipment optimization (including software). The first step is to determine whether the existing equipment is being used to its fullest advantage by examining operating data and identifying bottlenecks.
• Operating procedures. These may vary widely from person to person and from shift to shift. Operating procedures can help significantly, but they will be of no help if the operators take control and run the organization manually.
• Control optimization. In a typical organization there are hundreds or even thousands of control loops. Each control loop is responsible for controlling one part of the process. If the control loop is not properly designed and tuned, the process runs below its optimum. The process will be more expensive to operate, and equipment will wear out prematurely. It is important to note that for each control loop to run optimally, you must identify the sensors and values that turn problems into solutions. It has been very well documented that over 35 percent of the control loops typically have problems.
Often during this phase some very special approaches—such as forced-idea relationships and lateral thinking—are used. A forced-idea relationship is a lot like lateral thinking, as it relates to words and idea associations to generate new ideas. Lateral thinking is sidewise thinking, i.e., thinking across categories. Lateral thinking combines word associations with creative cross-categorical thinking. These approaches will be discussed in more detail later on in this chapter.
The streamlining phase is the most critical and the most interesting. It is during this phase that the creative juices of the PIT members are really put into action. The streamlining phase consists of six activities. (See Figure 5.1.) They are:
• Activity 1: Apply Streamlining Approaches
• Activity 2: Conduct a Benchmarking Study
• Activity 3: Prepare an Improvement, Cost, and Risk Analysis
• Activity 4: Select a Preferred Process
• Activity 5: Prepare a Preliminary Implementation Plan
• Activity 6: Conduct Phase III Tollgate
In his book Great Ideas on Innovation and Creativity, David Tanner states: “Creative thinkers
• Are discontent with the status quo
• Seek alternative solutions to problems or opportunities
• Are alert to things around them that may trigger ideas
• Turn a negative into a positive by viewing it from different angles
• Work hard at it”

Figure 5.1 Phase III: Streamlining the Process
Streamlining Phase
Now the fun begins. This is the part in the methodology where the PIT members can use their creativity to create a new and better process. It is a process of discovery and growth. Good ideas are set aside for even better ones. The PIT will be using a very systematic approach to evolve solutions that are so good that it will even surprise the PIT members. As the PIT works through the activities in this phase old beliefs and concepts will give way to new and exciting ones. Hold on to your hats—the rollercoaster is at the top of the grade and the ride is about to begin.
Activity 1: Apply Streamlining Approaches
Ask the question, “Why do we do what we do and why do we do it the way we do it?”
—H. James Harrington
The streamlining approach takes the present process and removes waste while reducing cycle time and improving process effectiveness. It focuses on the elimination of the seven types of waste. (See Figure 5.2.)
Waste is the enemy of SPI. We need to wage a war on waste with the objective of eliminating as much as possible. The following is a list of typical waste creators as defined by Lean Six Sigma and their impact:
• Production waste. This can fall into two categories: making too much and making too little.
■ Making too much causes:
![]() Excessive inventory
Excessive inventory
![]() Increased rework and updating
Increased rework and updating
![]() Obsolescence
Obsolescence

Figure 5.2 Seven types of waste
![]() Bottlenecks
Bottlenecks
![]() Increased cost
Increased cost
■ Making too little causes:
![]() Unused capacity
Unused capacity
![]() Your customers to be upset
Your customers to be upset
![]() Missed shipped dates
Missed shipped dates
![]() Poor utilization of resources
Poor utilization of resources
• Wait-time waste. This is caused by:
■ Absentee people that are not backfilled
■ Other priorities
■ Delivery delays
■ Low inventory levels
■ Scrap and rework
■ Slow decision making
■ Equipment downtime
■ Lost or misplaced items
■ Activities whose cycle time is greater than takt time
• Transportation waste. Transportation waste is usually the consequence of poor scheduling and can be broken down into internal and external problems:
■ Internal transportation waste results in:
![]() Movement between departments in different parts of the organization
Movement between departments in different parts of the organization
![]() Movement between desks or workstations within a department
Movement between desks or workstations within a department
![]() Movement into stock when parts are sent from suppliers
Movement into stock when parts are sent from suppliers
![]() Increased product quantities to make up for transportation time
Increased product quantities to make up for transportation time
![]() Increased workload to handle transportation scheduling, packaging, unpackaging, and storage
Increased workload to handle transportation scheduling, packaging, unpackaging, and storage
![]() Increased paperwork related to transportation scheduling
Increased paperwork related to transportation scheduling
■ External transportation waste into the organization results in:
![]() Suppliers located at distant points
Suppliers located at distant points
![]() Delays related to recognizing a problem and correcting a problem
Delays related to recognizing a problem and correcting a problem
![]() Handling damage
Handling damage
![]() Increased packaging and shipping costs
Increased packaging and shipping costs
• Processing waste. Operations, activities, and tasks that don’t add true value include:
■ Inspection operations
■ Duplicate activities
■ Just-in-case activities
■ Redundant records and files
■ Unused outputs
■ Data that aren’t analyzed or used
■ Unnecessary storing of information
■ Rework operations
■ Approval activities
• Inventory waste. It can fall into two categories: excessive inventory and insufficient inventory.
■ Excessive inventory or stock results in:
![]() The use of additional space
The use of additional space
![]() The organization’s money being tied up
The organization’s money being tied up
![]() Additional tracking
Additional tracking
![]() Stock becoming obsolete
Stock becoming obsolete
![]() Stock frequently getting damaged
Stock frequently getting damaged
![]() A slowdown in cycle time
A slowdown in cycle time
■ Insufficient inventory or stock results in:
![]() Shipment delays
Shipment delays
![]() Unhappy customers
Unhappy customers
![]() Emergency work orders
Emergency work orders
![]() Production defects as workaround procedures are used
Production defects as workaround procedures are used
• Motion waste. Every movement that an individual makes should be directed at real-value-added activities. Many of the motions that go on are no-value-added. For example:
■ Looking in a file for a paper
■ Looking up phone numbers
■ Getting an eraser from the desk drawer
■ Waiting for the computer to come up
■ Putting away something to use later
■ Laying out the tools necessary to do a job
• Error waste. This refers to both production and administrative activities. Everyone makes errors that waste time and money. Typical errors are:
■ Producing parts that don’t meet specification
■ Dialing the wrong phone number
■ Filing away documents in the wrong file
■ Misspelling a word in a report
■ Providing inadequate data
■ Draft-typing correspondence
■ Sending documents to people who don’t need them
■ Managers not listening to their employees
■ Not being prepared for a meeting
After the process is simplified and automated and current-state IT approaches are applied, the process will go through an amazing transformation that greatly improves its efficiency, effectiveness, and adaptability measurements. It would typically result in a 30 to 60 percent decrease in process cycle time and cost and a 100 percent improvement in process effectiveness.
SPI is the most frequently used BPI methodology because the risks are lower and costs are less than in other methods. It is the right answer for approximately 80 percent of the business processes that an organization is interested in improving.
Streamlining guidelines include the following:
• Combine several activities into one.
• Eliminate rework activities.
• Have the workers make the decisions.
• Standardize the process and the way it is performed.
• Centralize data and decentralize operations.
• Capture data as close to the source as possible using IT techniques.
• Integrate parallel activities.
• Reduce business-value-added and eliminate no-value-added activities.
• Perform the steps in the process in a natural order.
• Ensure that processes have multiple versions.
• Perform work where it makes the most sense.
• Reduce checks and controls.
• Minimize reconciliation.
• Use a case manager as a single point of contact.
• Make use of hybrid centralized and/or decentralized operations.
There are two factors that play important roles in driving the process improvement activities—the implementation framework and the best established practices. Table 5.1 presents survey results that identify the key implementation framework drivers (Mansar and Reijers, 2007). Table 5.2 identifies the most popular best practices.
Variation is the enemy of all processes. It doesn’t matter if it is variation in cost, cycle time, or a specific measurement. The more variation within a process, the less precise and predictable it is. The whole concept behind Six Sigma was to minimize variation to less than 50 percent of the acceptable tolerance.
The Six Sigma methodology is based upon the concept that the more variation is reduced around the midpoint of a specification, the less chance there is to create defects or errors. (See Figure 5.3.)
This is a concept that was well accepted in the 1940s during World War II. As early as the 1920s, Shewhart set the standard of performance in his control charts at plus or minus 3 sigma. The folks at Motorola felt that Phil Crosby’s Zero Defects performance criteria were unattainable, and so they set a specification to variation target of performance at 6 sigma. This will result in a process capability of 2.0 (Cp). Motorola felt that over time the process would drift plus or minus 1.5 sigma, so the actual long-term process capability target was set for 1.5 (Cpk) or spec to the actual variation target of 4.5 sigma. (See Figure 5.4.)
The change in target variation from 3 sigma to 6 sigma is where Six Sigma got its name. At the 6-sigma level, the long-term process capability results in 3.4 errors per million opportunities, not 3.4 errors per million items or transactions. This is near to perfection without requiring perfection. It is a goal to be sought after, not a performance standard that has to be met.
Another important point is that it is related to opportunities, not to the total output. For example, a car could have a million opportunities for failure due to its complexity. In this case, at the 6-sigma level there would be an average of 3.4 defects per car produced. This is the reason that every car that rolls off the Toyota assembly line still has its breaks checked to be sure they work.
Table 5.1 Best Practices Classified According to an Implementation Framework

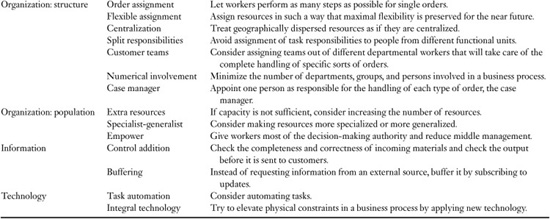
Table 5.2 Most Popular Best Practices

In Phase I we defined the variation in key measurements such as cost, cycle time, and quality. Throughout the 12 streamlining steps, the PIT will evaluate the impact the proposed change has on decreasing variation in these key measurements. Remember it is not the averages that make your customer unhappy; it is the extremes. It is when you tell a customer it will cost $100 and charge him or her $200, or you tell your customer the product will be ready in three days and it takes a week. It is therefore very important that we not only reduce the average cost, cycle time, and error rate, but reduce their variation over time.
The flowchart and simulation model prepared in Phase II serve as the road map to many improvement opportunities. Look for decision diamonds, loops, and branches to focus on eliminating them. (See Figure 5.5.)

Figure 5.3 Reduced variation around the midpoint

Figure 5.4 Process drift versus time
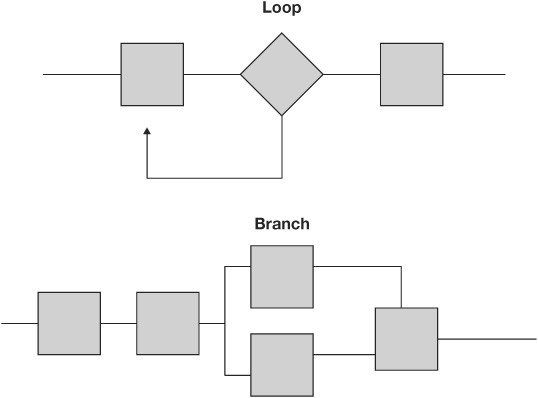
Figure 5.5 Typical loops and branches
Each symbol on the flowchart provides an opportunity for improvement. Specific questions that the PIT could ask relate to the specific symbols that follow:
• Operation symbols. Are all the operations necessary? Can they be reduced? What would happen if this operation wasn’t done? Could the flow of manual operations be streamlined? Can operations be combined together? Are some of the operations duplications? Are some operations in conflict with others? Can any of the manual operations be eliminated or simplified through the use of technology?
• Decision symbols. Are there a lot of decisions indicating complex work flow? Does the decision block result in a rework procedure? If so, how can the defect be eliminated? Have all the possible decisions from the decision block been flowcharted? Can any of the decisions be automated through the use of technology?
• Inspection symbols. Is this inspection necessary? Can the inspection be done by the person performing the task? Is the inspection done close to where the activity that is being inspected is performed so that quick feedback can be implemented? If the inspection is necessary, are data being collected to understand what the problem is so that it can be eliminated and thus the inspection activity will not be needed?
• Delay symbols. Are all the delays necessary? Can the work flow be changed to eliminate the delays? Can operations be combined to eliminate delays?
• Documentation symbols. Is the documentation necessary? What would happen if it were eliminated? Is the information coming to an activity being used, or does it need to be stored for a later use? Are copies only being distributed to people who need to use them? Is the document a duplication of some other document? Is the information on the document available someplace else? Is the documentation format designed for the person recording the information or for the person using the document? Could the documentation be created automatically using technology?
• File symbols. What would happen if the document was not filed? Are the document files in many different places? Is the method of storage effective? Have the documents periodically been purged from the filing system? If so, how often and by whom? How frequently are the documents retrieved from the files for value-added purposes?
• Transportation symbols. Why is the transportation necessary? Could the activity or operation that is receiving the transportation be combined with the one that was inputted into the transportation? Is the method of transportation the most effective? Can technology help? What can be done to minimize the distance traveled? What can be done to minimize the handling during transportation?
Twelve different tasks are used during Activity 1. (See Figure 5.6.) They are:
1. Bureaucracy elimination
2. Value-added analysis
3. Duplication elimination
4. Simplification
5. Cycle time reduction
6. Error proofing
7. Supplier partnership
8. Technology

Figure 5.6 Twelve tasks of Activity 1
9. Process upgrading
10. Risk management
11. Standardization
12. Simple language
How Simulation Modeling Is Used in Phase III
The simulation model was very useful in defining the variation in the current process. Now that we are about to define ways to improve the process, it will become even more valuable. When the PIT defines a potential improvement, there needs to be a way of projecting the improvement’s impact upon the process. Without a simulation model the impact upon the process is just the best estimate of the PIT members. But if you have a simulation model, you can include the improvement in the simulation model software, and in a matter of minutes you will have data that are equivalent to a full year of process activities. With the simulation model you can predict the impact each improvement will have on the process considering the impact that the other proposed changes will have upon the process. This is a very important ability because often changes to the process are made that are not needed since the problem had already been solved by another change. By not installing good ideas that are not needed, you can reduce cost and process complexity. Simulation modeling also helps you understand when a problem is resolved and improvement effort should be shifted to another part of the project or to another project.
Each time an activity within the process is under consideration to be removed or changed, the simulation model should be updated to determine the impact upon the total process. Frequently an activity that is changed may have a positive impact upon a specific part of the process but a negative impact on the total process. The simulation model allows you to quickly determine the total impact. In many cases, an activity can be changed in a number of different ways. Each of the options needs to be evaluated from the total process standpoint before one is selected. Continue to look for the best option, not the first way of eliminating a root cause.
This systematic approach is designed to minimize waste throughout the process as well as reduce activities that don’t benefit the external customer. As we outlined earlier in this chapter, Lean Six Sigma has categorized seven main waste creators—here we have added two more.
1. Errors, rework, and scrap
• Definition: Any time an output does not meet the internal or external customer needs the first time.
• Results: Increased costs, added labor, poorer reputation, increased checks and balances, and added frustration.
2. Waiting
• Definition: Any time an individual is waiting to go to a meeting or has idle time because the information or input has not reached him or her, or any time an output is waiting for the next activity to be applied to it.
• Results: Increased cycle times, larger inventories, and poorer utilization of space and personnel.
• Definition: Buying or producing more than is needed for immediate use or sales.
• Results: Large stocking areas, higher costs, increased floor space, and obsolete parts.
4. Inventory
• Definition: Excessive stock in the form of raw materials, in-process inventory, and finished-goods inventory.
• Results: Valuable cash flow being tied up, increased storage space and the labor to maintain it.
5. Transportation
• Definition: Movement of things from one activity to another.
• Results: Longer cycle times, increased lead times, poorer communications, and higher labor costs.
6. Movement/motion
• Definition: Excessive movement of anything, which includes people, machinery, and materials.
• Results: Higher labor costs, longer cycle times, reduced productivity, and increased employee physical effort.
7. No-value-added activities
• Definition: Activities that are unnecessary or redundant and that are not required for supporting the business or for meeting the external customers’ requirements.
• Results: Increased costs, increased cycle times, increased bureaucracy, and decreased morale.
8. Underutilized people
• Definition: People who don’t have a full day’s work to do. They have the capabilities of doing more if it was assigned and the timing was right.
• Results: Longer cycle times, added costs, unnecessary delays, low morale, and high turnover.
9. Staffing
• Definition: Products stop moving because someone is out ill or on vacation and no one has been assigned to fill in. People that are assigned to do the job are not trained.
• Results: Increased costs, increased cycle times, and increased errors.
Task 1. Bureaucracy Elimination (Figure 5.7)

Figure 5.7 Task 1. Bureaucracy Elimination
42% of the white-collar workers have considered quitting over bureaucratic hassles.
—The Conference Board, Chief Executive Magazine
We like to start with bureaucracy elimination because everyone hates “the Big B” (bureaucracy). Management doesn’t like it, customers resent it, employees hate it, and unions fight it. This is the one thing that everyone will help identify and eliminate. To start this task, the members of the PIT will review the flowchart (see Figure 5.8 and note that the flowchart is in black and white, not in color as it would be if it were created by a PIT) or simulation model and color in each of the bureaucracy activities in blue. They will then review each of these activities to determine if the results justify the costs. All too often, bureaucracy activities are put in place because 0.1 percent of the people in the organization are dishonest, and as a result, the other 99.9 percent—the honest people—are punished by adding more bureaucracy to their lives. (Here’s an example: when an employee gets caught taking home a pad of paper, the organization might require the security guards to start looking in each employee’s purse or briefcase to be sure that no one is stealing office supplies.)
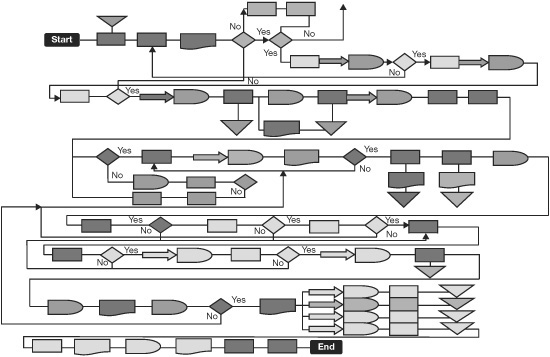
Figure 5.8 Gray scale of a flowchart with bureaucracy activities
In many organizations that we have worked with, the chief financial officer (CFO) frequently has to approve the capital equipment requests even if they are in the budget. In one such organization we asked the CFO to justify this approval procedure; he replied that it only takes a minute for him to sign the purchase request so there was no need for him to justify what he was doing because its cost was zero. When we then asked him why he signed it, he explained that he needs to check to see that it is in the budget for the department, that the department is not over budget already, and that there are three legitimate quotations. When we questioned if he could do all that in one minute, he hemmed and hawed for a while and then stated that it actually took him five minutes. Then we checked the purchase orders on his desk and found that the previous signature on average was five to seven days old. Getting the CFO’s signature delayed processing the purchase order. If the equipment saved $10,000 per month, the loss of savings would run between $2,500 and $5,000. When we asked him how many are rejected by him, he estimated about 10 percent, mainly because they didn’t have three quotations. He admitted that the rejected ones came back about five days later and most of them were purchased from the original recommended supplier. This is a good example of a rework cycle that added no value and increased cost and cycle time. It is usually hard to justify why a CFO needs to sign off on purchase orders. Processes should be designed for the majority of the employees, and management should have the courage to fire the dishonest ones.
Task 2. Value-Added Analysis (Figure 5.9)
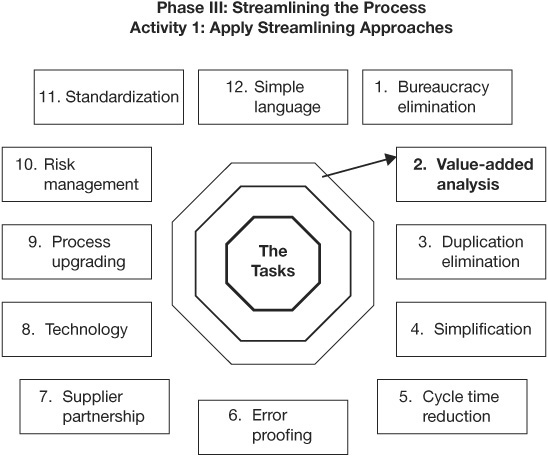
Figure 5.9 Task 2. Value-Added Analysis
David Fran, past member of the Economic Development Council of New York City, stated: “Value is the relative cost of providing a necessary function or service at the desired time and place with the essential quality. Value analysis is concerned with identifying the unnecessary costs that do not add essential reliability or quality to the product” (Fran, 1974).
Value-added analysis (VAA) is an analysis of every activity in the business process to determine its contribution to meeting end-customer expectations. The objective of VAA is to optimize real-value-added activities and minimize or eliminate no-value-added activities. The organization should ensure that every activity within the business process contributes real value to the entire process.
Value is defined from the point of view of the external customer. (See Figure 5.10.) There are three classifications of value activities:
• Real-value-added (RVA) activities. These are the activities that, when viewed by the external customer, are required to provide the output that the customer is expecting.
• Business-value-added (BVA) activities. These are activities that need to be performed in order to run the organization but that add no value from the external customer’s standpoint, for example, preparing budgets, filling out employee records, or updating operating procedures.
• No-value-added (NVA) activities. These are activities that do not contribute to meeting external customer requirements and could be eliminated without degrading the product or service function or the business, for example, inspecting parts, checking the accuracy of reports, reworking a unit, or rewriting a report. This category includes activities already classified as bureaucracy activities. There are two kinds of NVA activities:
1. Activities that exist because the process is inadequately designed or the process is not functioning as designed. Examples include movement, waiting, setting up for an activity, storing, and doing work over. These activities would be unnecessary to produce the output of the process, but they occur because of poor process design. Such activities are often referred to as part of poor-quality cost.
2. Activities not required by the external customer or the process and activities that could be eliminated without affecting the output to the external customer, such as logging in a document.
What every organization has is a huge hidden office made up of BVA and NVA activities. Together they often account for 80 percent of the total effort, while RVA activities only account for 20 percent of the organization’s total effort. (See Figure 5.11.)

Figure 5.10 Value-added assessment

Figure 5.10 shows how the evaluation is done. RVA activities contribute directly to producing the output required by the external customer. The PIT should analyze each activity and task on the flowchart and classify it as an RVA, a BVA, or an NVA activity. (Note: The bureaucracy activities will also be classified as BVA or NVA activities.)
Use a yellow highlighter to designate each BVA activity on the flowchart. Color in the NVA activities with a red highlighter. You have now turned your flowchart into a rainbow flowchart (Figure 5.12 is a gray tone copy of a rainbow flowchart). Typically, as PIT members go through this phase of the analysis, they are astonished at the small percentage of costs that are RVA activities. Even more alarming is the mismatch of processing time for RVA activities compared with total processing time. For most business processes, less than 15 percent of time is spent in RVA activities.
Obviously, this indicates something very wrong, and managers are often disturbed when they learn of these numbers. But there are several explanations:
• As the organization grows, processes break down and are patched for use, thereby making them complex.
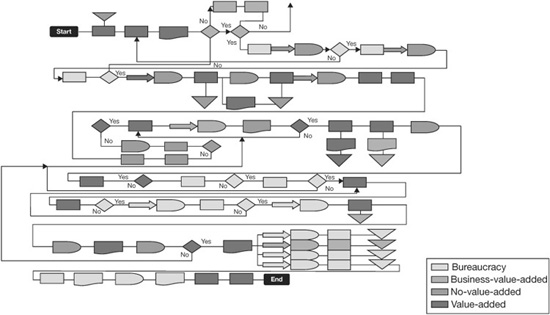
Figure 5.12 Gray tone copy of a rainbow flowchart
• When errors take place, additional controls are put in place to review outputs rather than change the process. Even when the process is corrected, the controls often remain.
• Individuals in the process seldom talk to their customers and hence do not clearly understand the customers’ requirements.
• Too much time is spent on doing internal maintenance activities (such as coordinating, expediting, and record keeping) instead of RVA work.
The PIT should now answer the following questions:
• How can the RVA activities be optimized?
• Can the RVA activities be done at a lower cost with a shorter cycle time?
• How can the NVA activities be eliminated? If they cannot, can they be minimized?
• Why do we need the BVA activities? Can we minimize their cost and cycle time?
The PIT has to be very creative in coming up with solutions and should not be constrained by the current culture, personalities, or environment.
• Rework can be eliminated only by removing the causes of the errors.
• Moving documents and information can be minimized by combining operations, moving people closer together, or automating processes.
• Waiting time can be minimized by combining operations, balancing workloads, or automating processes.
• Expediting and troubleshooting can be reduced only by identifying and eliminating the root causes.
• NVA outputs can be eliminated if management agrees.
• Reviews and approval can be eliminated by changes in policies and procedures.
When you need to generate some new ideas, Harold R. McAlindon, author of the book Great Ideas on Innovation and Creativity, suggests that you SCAMPER:
■ Combine
■ Adopt
■ Magnify/minimize
■ Put to other uses
■ Eliminate
■ Reverse/rearrange
Challenge everything. There is no sacred cow in SPI. Every activity can always be done in a better way. The end result of this analysis is an increase in the proportion of RVA activities, a decrease in the proportion of BVA activities, a minimizing of NVA activities, and a greatly reduced cycle time. (See Figure 5.13.) This concept is so important that all employees should learn to use it in their daily work. The results will be powerful.
As you analyze each BVA and NVA activity, drive the analysis down to determining the root cause for the activity’s existence. Pay particular attention to rework and scrap cycles. We find that the Five Whys approach is a simple way of defining the root cause of the activity’s existence. Once the root cause is defined, a decision can be made to eliminate, modify, or leave the activity alone. Recently there have been some breakthroughs in using computer software to help define root causes. We are using a program called Anticipatory Failure Determination produced by I-TRIZ. It is a systematic procedure for identifying the root cause of a failure or other undesirable phenomenon in a process and for making corrections in a timely manner.
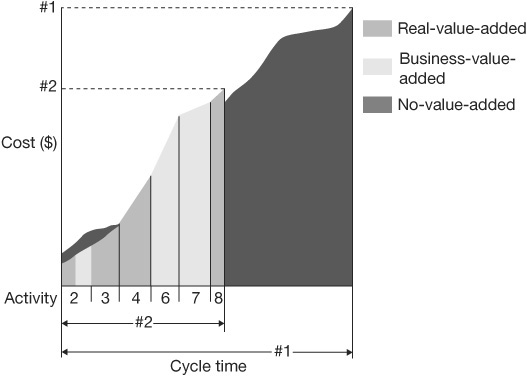
Figure 5.13 Cost–cycle time chart before and after applying VAA
Let’s take a look at an example of a process we worked on. The object was to eliminate the need for any of the decision blocks. We were working on a decision activity that asked the question, “Does the customer live in a location where the service can be provided?” Answer: “Yes, but the location was not in your qualified records.”
The following are the results of using the Five Whys approach:
• Question 1. Why isn’t the location qualified?
Answer: It is a new area and not in our records.
• Question 2. Why isn’t it in our records?
Answer: Because no one told us they were building in that area.
• Question 3. Why weren’t we told?
Answer: Because we didn’t look at the records.
• Question 4. Why didn’t we look at the records?
Answer: Because no one was assigned to do it.
• Question 5. Why was no one assigned?
Answer: Management didn’t realize that it would be a problem.
• Action: Department 375 will assign John to review the building permits each week and update the records.
This is a very simple example of how this approach drilled down to correcting the problem very effectively. It is amazing how many of these activities can be eliminated through extremely simple methods, eliminating much of the complexity that we are facing today.
If you figure out what is causing the exceptions, you can streamline the process.
—Mark Robertson, EDS Headquarters
A Typical Value Analysis Cycle
All of us are flowcharting our processes, but once they are flowcharted, the real challenge begins. The question is, How can you streamline the process? The following is one simple approach that has worked for me:
Step 1. Review each block in the flowchart to define which of the following classifications each of the blocks fits into.
• Real-value-added activities. These activities are directly related to the product or service that will be delivered to the external customer. These are the activities that the customer would be willing to pay for (examples: machining a part, cooking a meal in a restaurant, writing out a sales order).
• Business-value-added activities. These activities are needed to run the organization but are not the things that the external customers want you to do for them (examples: preparing budgets, filling out employee records, updating operating procedures).
• No-value-added activities. These activities are unnecessary (examples: inspecting parts, checking the accuracy of a report, reworking a unit, rewriting a report). They include activities already classified as bureaucracy activities.
Now ask yourself if the things you classified as real-value-added are truly what the customer wants to pay for. The answer in most cases is yes and no. Most real-value-added activities have no-value-added or business-value-added parts. For example, let’s look at the activity of contacting a customer to give him or her the date when an order will be delivered. It is obvious that this is an activity that the customer wants you to do, but is it all real-value-added—probably not. The input to the activity is the order delivery date sent to you over the internal network from production control. Let’s focus on the tasks that make up this activity. (See Table 5.3.)
As you can see from Table 5.3, the only part of the activity that is real-value-added is the part of the conversation when you provided the customer with the date of the delivery. This was about five seconds of the conversation when you said, “Your order #175 for 50 wheel lugs will be delivered on July 17 in the morning.” The rest of the task was business-value-added or no-value-added.
You can see that even in the activities classified as real-value-added activities there are significant opportunities to improve. Most of the activities classified as real-value-added activities have less than 20 percent of the cost devoted to real-value-added work.
Be careful—you can have a big problem if you don’t consider the non-value-added cost. (Business-value-added plus no-value-added equals non-value-added.) Table 5.4 shows a product-cost estimate from the normal cost standpoint and then what the real costs are when non-value-added costs are considered.
Table 5.3 Tasks to Contact Customer for Delivery Status
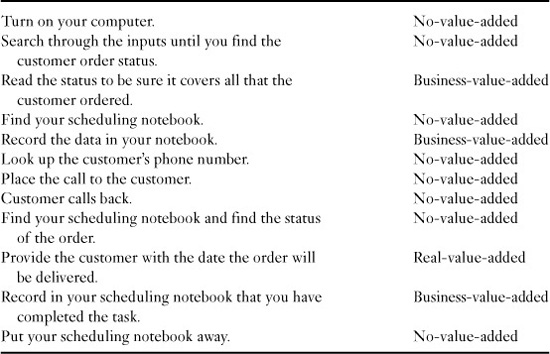
Table 5.4 Total Cost versus Functional Cost
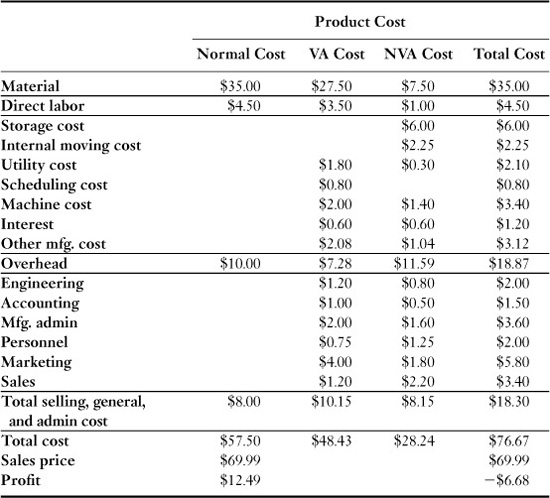
Figure 5.14 is a simple four-block flowchart. The first operation is machining a part, which is real-value-added; the second operation is recording the time that it takes to machine the part, which is business-value-added; and the third operation is inspecting the part to see if it is good or bad, which is no-value-added.
Step 2. To highlight these differences, we recommend coloring in the real-value-added activities in green, business-value-added activities in yellow, and no-value-added activities in red. As noted earlier, this is called a rainbow flowchart. Often bureaucracy-type, no-value-added activities are colored in blue to set them apart.
Step 3. For the activities that are classified as no-value-added, define the ones that are inspection or audit activities.
Step 4. For the inspection and audit activities, define what the activity cost is and how much the activity delays the process. Next compare the activity cost with the real-value-added savings that the inspection or audit adds because it keeps defective items from moving on to later, higher-cost activities. If the real-value-added content is less than the cost of doing the audit or inspection, consider eliminating the activity. If the real-value-added savings is greater than the cost of doing the activity, then continue doing the activity but start a corrective action project to correct the problem to the point that the no-value-added activity can be eliminated. One word of caution: Often, people do a better job because they know that their output will be reviewed or inspected by another person, and so if the inspection or audit is dropped, the quality of the work may become unacceptable.

Figure 5.14 Process flow diagram
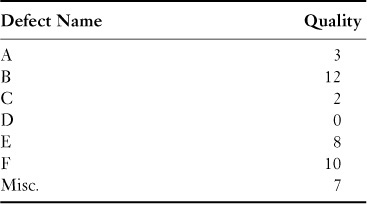
Step 5. For those inspection and audit operations that will remain, collect the defect, error, or deviation data and plot them using a Pareto diagram. (See Table 5.5 and Figure 5.15.)
For the top 50 to 60 percent of the defects, use the Five Whys technique to define the root causes. In some cases a more sophisticated root-cause analysis may be required.

Figure 5.15 Pareto diagram of defects
Table 5.5 Number of Defects by Defect Name
Step 6. Perform a root-cause analysis on the three highest defects: B, E, and F. Table 5.6 shows the results.
For defect B, two root causes were defined (BR1 and BR2), and only one root cause was defined for defects E and F (ER and FR).
Step 7. Now for each of the root causes a corrective action plan needs to be developed. (See Table 5.7.)
Step 8. We will now analyze each corrective action to define what impact it would have on the process and organization. Each corrective action is evaluated as a stand-alone item. (See Table 5.8.)
It is important to understand that a single corrective action can have an impact in a number of ways. For example, by reducing variation in a process, process cycle time and cost can be decreased and quality and customer satisfaction can be improved. With this in mind, in Table 5.8 we analyzed each corrective action in the following ways:
• Dollars saved
• Reduced variation
Table 5.6 Root Cause per Defect

Table 5.7 Root Causes and Their Related Corrective Action
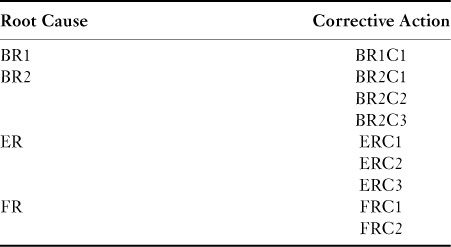
Table 5.8 Impact of Corrective Action

• Cycle time reduction
• Inventory reduction
• Increased customer satisfaction
• Processing time
Step 9. The next activity is to study the impact that each of the corrective actions has on the different defects. (See Table 5.9.)
Step 10. For each corrective action, next evaluate its cost, cycle time, difficulty to implement, and workload. (See Table 5.10.)
Table 5.9 Corrective Action Impact on Defects
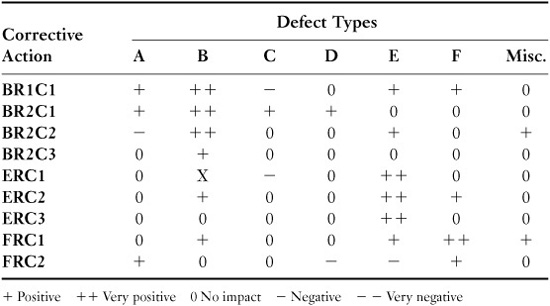
Table 5.10 Corrective Action Implementation Analysis
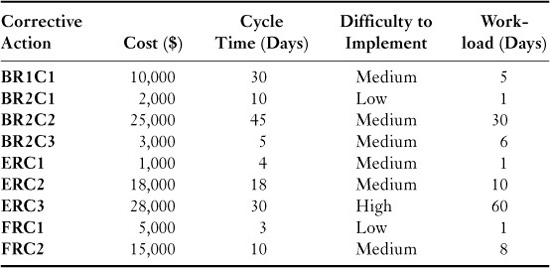
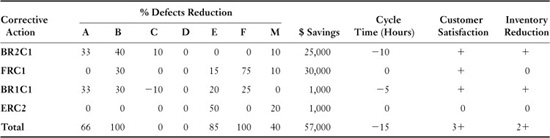
Step 11. By analyzing Table 5.10, you can define the sequence in which the improvements will be implemented. As you define the implementation order, add the improvement to the impact table. (See Table 5.11.)
In Table 5.11 we recorded the percentage of the defect problems corrected by the corrective action. Some people prefer to analyze the number of defects that would be eliminated by each corrective action instead of the percentage of the problem that will be eliminated. For example, Corrective Action BR2C1 would reduce the three defects in Problem A in Table 5.11 by one defect instead of 33 percent. Both approaches are acceptable.
Each corrective action must assume that the problem has been reduced as defined by the previous corrective action. For example, if the previous corrective action eliminated the burrs on a part by using a new tool, a later corrective action could not claim that it had eliminated the burrs by changing the materials.
In analyzing the projected impact of improvement for the first three corrective actions, you will note the following results: defects for Problem B are completely eliminated, defects for Problem A are reduced by 66 percent, Problem F is solved, and defects for Problem E are decreased by 85 percent.
In the Problem E example, after the first three corrective actions were selected and the impacts analyzed, additional improvement was still needed. So the fourth corrective action that was planned for ERC2. The combination of these four corrective actions was enough to correct the process, and five of the potential corrective actions did not need to be implemented.
This approach is a simple and straightforward way of completing a thorough problem-analysis cycle. The first step defines the root causes, and the next steps analyze the potential corrective actions to optimize the positive effects of implementing these corrective actions on the total process.
Other Approaches
Although the Five Whys is an effective way to drive to the root cause of a problem, there are many other ways to come up with effective corrective action. The following are three of them:
1. Creative questioning
2. Forced-idea relationships
3. Lateral thinking
Table 5.11 Implementation Impact
Creative Questioning
Alex Osborn originally developed this technique. It has been used extensively in creative activities such as value analysis and visioning. The technique involves identifying an object such as an activity in a process or a physical product and asking a series of questions about how that object might be changed. Creative questioning may be used either individually or as an aid to brainstorming in a group.
Forced-Idea Relationships
This technique is a lot like lateral thinking and morphological analysis, as it relates to words and idea association to generate new ideas. It usually begins with a brainstorming activity. The group is next asked to force-associate at random words that are on the brainstorming list. This forced association then generates creative thinking.
Lateral Thinking
Lateral thinking is sidewise thinking, i.e., thinking across categories. Lateral thinking combines word associations with creative cross-categorical thinking. The three primary ways to associate words are:
1. Similarity. You combine words and ideas based upon some common type or category.
2. Contrast. You associate words and ideas based upon their differences.
3. Proximity. You associate words and ideas based upon a cause-and-effect relationship or order sequence.
To accomplish these techniques, the group is given key words and is asked to develop other associated words that are combined in a matrix. By examining the matrix, the team comes up with unique associations between key words and the associated words that can lead to innovation.
Directed Evolution
Although these tools do a good job at defining root causes, there are some tools that go much further and help to define the correction to the problem. Directed Evolution is one such tool. It is based upon the 40 TRIZ Principles for Conflict Resolution—these are 40 one- or two-word statements that describe approaches to resolving technical conflict (problems and contradictions) that were defined by Genrich Altshuller based upon his study of over 200,000 patents. These 40 TRIZ Principles have a twofold purpose:
• Within each principle resides guidance on how to conceptually or actually change a specific situation or system in order to be rid of a problem.
• The 40 principles also train users in analogical thinking, which is to see the principles as a set of patterns of inventions or operators applicable to all fields of study. (See Figure 5.16.)
The principles also make use of the 39 Characteristics of a Technical System. These are the 39 engineering parameters for expressing technical contradictions defined by Genrich Altshuller in the late 1960s. (See Figure 5.17.)
To make this combination usable, Directed Evolution has combined them into Patterns of Evolution. They are a set of terms or statements that define trends that have strong, historically recurring tendencies in the development and evolution of man-made systems. There are 8 major patterns (some people use 12 major categories in place of the 8). They are often presented in a spider diagram. See Figure 5.18 for the 8 Patterns of Evolution and Figure 5.19 for the 12 Patterns of Evolution.
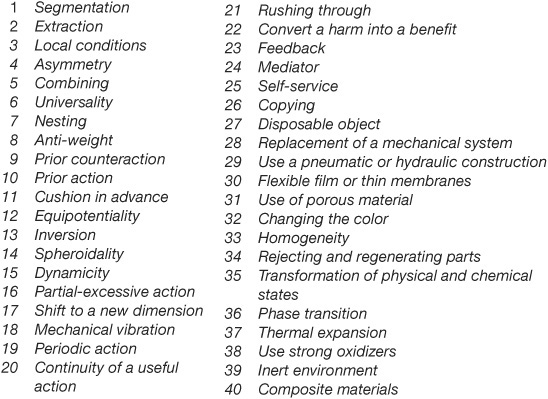
Figure 5.16 Altshuller’s 40 TRIZ Principles for Conflict Resolution
© 2000–2008 Ideation International Inc. All rights reserved.

Figure 5.17 Altshuller’s 39 Engineering Parameters for Expressing Technical Contradictions
© 2000–2008 Ideation International Inc. All rights reserved.
Each of the Patterns of Evolution is subdivided into many Lines of Evolution. Lines of Evolution describe in greater detail typical sequences of stages (positions on a Line) that a system follows in a specific Pattern of Evolution in the process of its natural progress. Once these positions are known, the system’s current position on a Line can be identified, and the possibility of transitioning to the next position can be assessed (for example, become flexible or use microlevel properties of materials utilized).
Aligned with each Line of Evolution is a group of possible corrective actions called Operators that can be used to correct the problem or improve the product or process. An Operator is a little nugget of wisdom (recommendation, suggestion) on changes to the system designed to trigger you into thinking how to solve the problem or to improve the process under evaluation. Operators could also be used in moving the system to the next position on the Line if this step requires a creative solution. Operators are drawn from the successful results of previous actions that resolved difficult technological problems and process problems. Operators are used to solve problems in existing systems and to change the system position on the relevant Lines of Evolution, for example by suggesting to employ a hinge or use special physical effects. In some situations, a position on the Line could be described via an applied Operator, so a Line could include a number of Operators or positions that are or were applied or achieved in a certain sequence. The 40 TRIZ Principles were the first Operators discovered; there are about a thousand of these Operators available today.
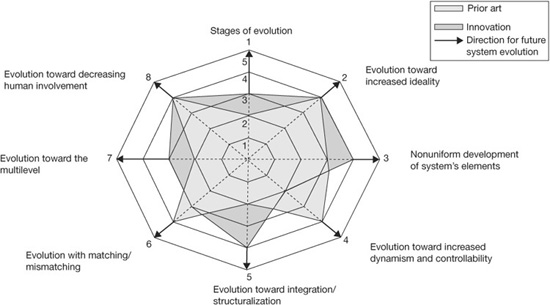
Figure 5.18 The 8 Patterns of Evolution
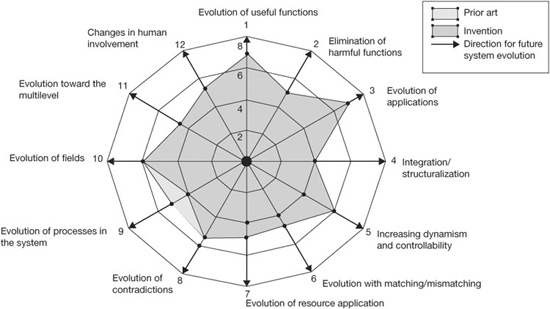
Figure 5.19 The 12 Patterns of Evolution
It helps me to think of Lines of Evolution as taking a long trip with many cities along the way. Each one is a destination unto itself. The Operators are the GPS (Global Positioning System) that tells you the best way to get to the next destination.
HU Diagrams
The Directed Evolution approach also makes use of HU diagrams (H stands for harmful functions, and U stands for useful functions). These diagrams show the relationships between the functions. The model helps us identify the areas of the system that can be improved. Every time you define a corrective action (useful function), you also may create a counterreaction (harmful function). (See Figure 5.20.)
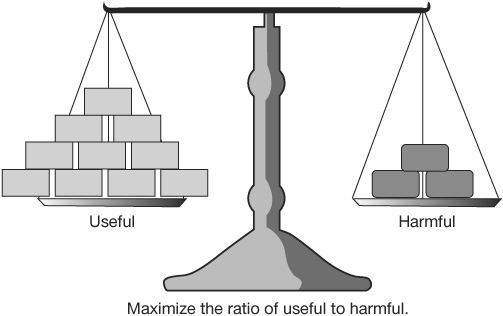
The object of the HU exercise is to maximize the ratio of useful to harmful functions. This is accomplished by creating an HU diagram. (See Figure 5.21.)
HU diagrams focus on defining a solution. This is a very different objective compared with that of most problem-solving tools used by the improvement professional in the past; previously the objective would have been to define the root cause. HU diagrams also help to reduce the risks related to the new process. To understand how to construct and use an HU diagram, see Appendix H.
Best-Value Analysis
Figure 5.22 shows the impact of having a bigger percentage of a process in real-value-added activities.
The materials or process may be real-value-added, but is it the best way to accomplish the desired function? Best-value analysis is another effective approach used to evaluate if the item being studied is designed to provide maximum value to the customer at the lowest possible price. Best-value analysis (sometimes just called value analysis) consists of five phases:
• Information phase
• Specification phase
• Analysis phase
• Execution phase
• Reporting phase
The following is a detailed explanation of each of these five phases:
• Information phase. The information phase asks three questions: What is it? What does it cost? What does it do? Function is what makes a product, process, or procedure work or sell. A function can be either primary or secondary. For example, the function of a drill might be to drill holes, but this would restrict it to making holes. A better definition would state that the function of a drill is to remove materials. Likewise, if we ask what the function of a power cable is, we might say it is to conduct electricity. A better definition would say that the function of a power cable is to transmit energy.
• Specification phase. Creativity equals knowledge times imagination times evaluation. The specification phase asks the question, What else will do the job? After doing something the same way for 2 years, look it over carefully. After 5 years, be suspicious. After 10 years, throw it out and start all over again. The brain contains about 13 million nerve cells. About one-third are used in a normal lifetime. Only 5 percent are in constant use. So there are a lot of no-value-added nerve cells available for you to use to make you more creative. To keep the creative flow going, don’t critique ideas during a brainstorming session. Just think how much faster you travel on a freeway than down a street in your town. Each time you come to a red light and put your brakes on, your vehicle stops. Creativity stops whenever it is interrupted. In addition, our studies reveal that the best ideas do not appear during the beginning of the brain-storming session. The second half is where 80 percent of the good ideas originate.

Figure 5.21 Typical HU diagram with comments

Figure 5.22 The difference between the good and the best organizations
• Analyze phase. The analyze phase asks the questions: Will it work? What will it cost?
• Execution phase. In this phase the future-state solution becomes a reality.
• Reporting phase. In this phase the results of the changes are measured to verify that the projected improvements were realized (Fran, 1974).
The following are typical examples where creative thinking got rid of non-value-added waste to bring about some big improvements in performance. A good example of a wrong material selection occurred at a motor manufacturing factory—a stainless-steel bellow was used as a coupler between a small electric motor and a variable condenser. By replacing it with a plastic tube, the cost was reduced 95 percent (Fran, 1974).
Typical examples include Union Carbide—it used process breakthrough techniques to remove $40 million out of its fixed cost in just 3 years. And Blue Cross of Alaska’s improvement efforts increased productivity 20 percent in 15 months. CEO Betty Woods stated: “It was more difficult than we ever imagined but it was worth it.”
Task 3. Duplication Elimination (Figure 5.23)

Figure 5.23 Task 3. Duplication Elimination
To eliminate duplication, the PIT will look at the process to define where the process is recording the same data in more than one place in the process and will also look to see if the same data are recorded in another process that could eliminate the need to record those data in the process under study. As well, the PIT will check for activities that are done in two places in the process or are done in other processes that could be eliminated or be combined so that the activities do not have to be done in both places. A typical example is where the manager and the personnel department are keeping separate employee attendance records. Frequently these duplications end up by confusing rather than helping, for often one set of records doesn’t agree with another set of records. (See Figure 5.24.) This results in a lot of additional work to resolve the differences when what should have been done was to refine the process so that the data that are collected are correct.
Start with an article that suits and then study to find some way of eliminating the entirely useless parts. This applies to everything—a shoe, a dress, a house, a piece of machinery, a railroad, a steamship, an airplane. As we cut out useless parts and simplify necessary ones, we also cut down the cost of making.
—Henry Ford, Sr.
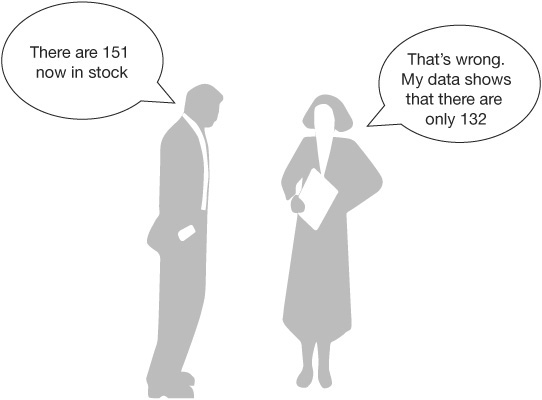
Figure 5.24 Problems with two sets of data
Task 4. Simplification (Figure 5.25)

Figure 5.25 Task 4. Simplification
Henry Ford, Sr., wrote in his book My Life and Work, “The foremen and superintendents would only be wasting time were they to keep a check on the costs in their departments. There are certain costs—such as the rate of wages, the overhead, the price of materials, and the like, which they could not in any way control, so they do not bother about them” (Ford, 1922).
Simplification is an approach that the Japanese have defined and used to create an advantage over their competitors. While the rest of the world has been focused on installing very complex systems to manage their processes, the Japanese have looked for ways to simplify them and to eliminate the need for the very costly software approaches. Companies like Toyota look for ways that they could complete the same task without the cost or complication of the popular software programs. As a result, they are using very simple approaches that could eliminate the need for expensive and complex Supply Chain Management and customer relationship management systems used by their competitors in the United States. This is one of the major reasons that Toyota is now the number one car producer in the world, replacing General Motors and Ford.
Simplification is another important concept in streamlining. Let’s begin by trying to understand the term. We live in a world of ever-present and increasing complexity. Complexity means that life has more of everything: more parts, more systems, more relationships, more dependencies, more problems, and more imperatives. Today, goals, requirements, and volume are changing, and so the processes are adapted accordingly. More steps, more tasks, more people, more interdependencies are added. When new tasks are added, support tasks usually follow (for example, preparation, filing, or putting away work), making the process more complex.
The increase in complexity results in increasing difficulties everywhere as activities, decisions, relationships, and essential information become more difficult to understand and to manage. In an era of rapidly increasing complexity, it is essential to actively and continuously be engaged in simplification as a counterforce to evolving complexity.
When you apply simplification to a business process, you evaluate every element in an effort to make it less complex, easier, and less demanding. When an organization fails to make continuous simplification efforts, it invites difficulty and poor performance.
The following list illustrates the application of the concept in relatively simple but time-consuming everyday activities:
• Eliminate duplication and fragmentation of tasks. The first step is to identify the duplications and fragmentations that occur during various parts of the process and then, second, to combine related tasks and eliminate redundancies.
• Address complex flows and bottlenecks. These can be managed by changing the order of tasks, combining or separating tasks, and even balancing the workload of different individuals.
• Simplify memos and other correspondence. These can be simplified by making them shorter, more direct, better formatted, and more readable.
• Manage meetings. An agenda (sent well in advance) is a basic simplification device. Presentation materials should be simple and easily understood. Meeting protocol should be established and followed, and meeting attendees should be trained in protocol.
• Combine similar activities. Can similar or consecutive activities be combined to make one job more rewarding to the person performing the assignment and reduce cost, errors, and cycle time?
• Reduce amount of handling. Can you reduce the amount of handling by combining responsibilities? Can the person doing the activity evaluate the output to ensure that it is correct? Can a phone call eliminate the need to mail a document to another building?
• Eliminate unused data. Do you use all the data that are recorded? If not, why record them? Each thing that is recorded (word by word) should be challenged to be sure it is needed.
• Eliminate copies. Are all the copies of letters and computer reports used? In most cases, they are not.
• Refine standard reports. Meet frequently with the people who receive standard reports to find out what parts of the report they use and how they use them. Put all the standard reports in similar formats.
Let’s look at an example of the simplification concept: writing checks, recording the transactions in a journal, and tracking the receipts. With the traditional, old-fashioned manual method, these are three separate activities, tedious and time consuming. Simplification combines them into one activity. The method is called the one-write system of check writing. Simultaneously, you can write a check, make a duplicate, and record the transaction in a journal. This system accomplishes the same objective as the three-step process but with less effort, less time, and less chance for error.
In trying to find ways to apply the principles of simplification, we would again begin by asking questions such as:
• Is this process effectively systematized or performed haphazardly?
• Would a different process be more effective, more efficient?
• Would a different layout make work smoother and easier, with less handling and less wasted motion?
• Can the forms be filled out without adding another document?
• Can this activity or stage be combined with another?
• Could a single activity produce a combined output?
• Are instructions immediately available, easy to understand, self-explanatory?
• Would a backup process eliminate rework or wait time?
• Does this activity require someone to stand by idly while the task is being done?
• Would simpler language speed up reading and improve understanding?
• Does the way it is done create more unnecessary work downstream?
• Is time lost looking for information or documents?
• Do interruptions of the work flow add to complexity?
• Could a template be used to simplify the activity?
• Does the work flow smoothly around the area?
• Is there unnecessary movement?
And the list goes on and on …
Sometimes it is helpful to start your simplification analysis for an activity by asking the question, What is your output? Then design a process for the simplest way of generating that output and compare this new process design with the original process. After the comparison has been made, combine the two processes, taking the best of each.
To summarize simplification, you need to:
• Make the process less complex.
• Make the process less demanding.
• Include fewer pages.
• Include fewer steps.
• Include fewer tasks.
• Ensure fewer interruptions.
• Make the process easier to learn.
• Make the process easier to do.
• Make the process easier to understand.
• Ask yourself, Does it really even need to be done?
When Boeing focused on simplification, the company was able to cut six manuals down to one that was smaller than any one of the six. When IBM Brazil focused on simplification, it eliminated 50 procedures and 450 forms and reduced the number of documents it produced each year by 2.5 million.
One part of an electronic music organ was made up of 163 parts. It provided the vibration tones similar to that of a violin when it is played. By analyzing its functions and streamlining it, it was reduced down to 51 parts that improved the quality of the tone (Fran, 1974).
Task 5. Cycle Time Reduction (Figure 5.26)

Figure 5.26 Task 5. Cycle Time Reduction
Time is the only thing that you can’t get more of.
—H. James Harrington
Reducing cycle time is critical to success today. The organization that gets there first with the most is always the winner. Every product has a market window. Long development processes miss the critical beginning portion of the market window that sets the theme for the total buying activities. Long cycle times increase cost and cost the organization customers. The objective of this task is to reduce cycle time. To do this, the PIT needs to focus on activities that take long cycle times in the current process.
When your product isn’t moving, you have a problem.
—H. James Harrington
A number of things can be done to reduce cycle times. Some of them are:
• Do activities in parallel versus serially.
• Stop batch processing.
• Change activity sequence
• Eliminate wait time.
• Reduce interruptions.
• Improve timing (when an employee receives output).
• Reduce output movement.
• Set different priorities.
• Reduce inventory.
At G&G Machine Inc. a list of improvement ideas came out of each value stream map (VSM), resulting in about a 50 percent reduction in lead time and similar reduction in work-in-process (WIP) inventory. One of the improvement ideas from the VSM was to implement a Pull/Kanban system to keep material flowing through the shop and minimize WIP (Southwest Research Institute, 2010). Henry Ford, Sr., was the U.S. father of just-in-time production. He did not believe in warehouses. To him stock represented money wasted. In 1922, he stated:
We have found in buying materials that it is not worthwhile to buy for other than immediate needs. We buy only enough to fit into the plan of production, taking into consideration the state of transportation at the time. If transportation were perfect and even flow of materials could be assured, it would not be necessary to carry any stock whatsoever. The carloads of raw materials would arrive on schedule and in the planned order and amounts, and go from the railway cars into production. That would save a great deal of money, for it would give a very rapid turnover and thus decrease the amount of money tied up in materials. With bad transportation one has to carry larger stocks.
This is the step where critical path analysis and the theory of constraints become very important tools to help you reduce cycle time. The critical path method (CPM) constructs a model of the project or process that includes the following:
• A list of all activities required to operate the process
• The time (duration) that each activity will take to completion
• The dependencies between the activities
Using these values, CPM defines the longest path of activities from the beginning to the output of the process that is being analyzed. The critical path is the sequence of activities that add up to the longest overall duration to produce an output. This determines the shortest time possible to complete a process cycle. An additional parallel path through the process with the total durations shorter than the critical path is called a subcritical or noncritical path.
The theory of constraints is based on the premise that the rate of goal achievement is limited by at least one constraining process. Only by increasing flow through the constraint can overall throughput be increased.
When things sit on a person’s desk or in the stock room, it is just adding to the cycle time and the cost. Just-in-Time, Zero Inventory, and Single Item Processing all add up to reducing cycle time, saving money, and improving customer satisfaction. After all, cycle time is what the external customer lives with, not processing time.
One of the most effective ways to reduce cycle time is through CPM. Every process has a critical path; it is the combination of activities and tasks that gate the takt time of the process. The PIT can determine the critical path by analyzing each path that the item can go through in the flow diagram and adding up the time it takes in each of the activities, including transportation and wait time. Although it is possible to define the critical path by hand, it is much more practical to do it using a computer program like Microsoft Project. In this case, with the touch of a button you can immediately define and highlight the critical path. Once the critical path is defined, prioritize elements that are on the critical path to work on and reduce their cycle time. Frequently there are one or two activities that are going to make the difference. Once the critical path is streamlined, another critical path will immediately come up. Keep working with these critical paths until your cycle times meet the requirements as defined in your project charter.
Hughes Aircraft analyzed the steps required to construct a space satellite. The company found out that many of them were not required. By cutting out or combining these steps, the team reduced the time required to build key components of the shuttle from 45 to 22 weeks, saving millions of dollars (Tomasko, 1993).
Combining several activities into one can result in:
• Eliminating rework activities
• Having the workers make the decisions
• Standardizing the process and the way it is performed
• Centralizing the data and decentralizing operations
• Capturing data as close to the source as possible using IT techniques
• Integrating parallel activities
• Reducing business-value-added activities and eliminating no-value-added activities
• Reducing cycle time
Let’s take a look at what reducing cycle time did for IBM’s special-bid process. The old special-bid process took 90 days, and the company closed 20 percent of the bids. After streamlining the process, IBM was able to process a bid in 15 days, reducing the cost to process a bid by 30 percent. But even more important, the bid closure jumped from 20 to 65 percent wins—more than a 300 percent improvement in sales.
Owens Corning was able to cut its budgeting cycle from 5 months to 60 days, starting in October and having the board of directors’ approval in December. Budgets were due the middle of October. Two weeks later, all the regional presidents met together in a two-day planning meeting where they presented their numbers and justifications. At the end of the two-day meeting, goals for the next year were completed, and the chairman took these goals to present them to the board of directors in December.
We are not afraid to try new things now. Sometimes they work and are useful, other times not. If everything we did worked, we would know we weren’t trying hard enough.
—Charlie Chambers, Owens Corning
Reporting and Forecasting (CFO, 1996)
We cut our process from 20 steps to 9 steps and added one so the change was significant.
—John Trabulsi, Dun & Bradstreet
Accounts Payable and Purchasing
The concerns always come back to controls—how would this new process minimize fraud with so few steps? … The idea was to do each step only once and only if it was needed. Steps had been added over time to take the thinking out of the process. We wanted to put the thinking back in.
—(John Trabulsi, Dun & Bradstreet, Accounts
Payable and Purchasing, CFO, 1996).
Batch processing in production and in the support areas increases cycle time. For example, if forms are batched in quantities of 50 and it takes 2 minutes per form, the first form processed waits 98 minutes before it moves on to the next operation. If each form is processed as an individual unit, then it would only be a 2-minute delay before it moves to the next station.
The following is another example of serial versus parallel activities. A typical engineering folder would go from development engineering to product engineering, manufacturing engineering, manufacturing field service, purchasing, and QA and then back to development engineering. If it takes 2 days in each of the areas plus 1 day to transport, that is 15 days or 3 weeks. If you hold a meeting where you bring all six people together, you could reduce that time to minutes.
When it is not moving, that is an improvement opportunity.
—H. James Harrington
Task 6. Error Proofing (Figure 5.27)
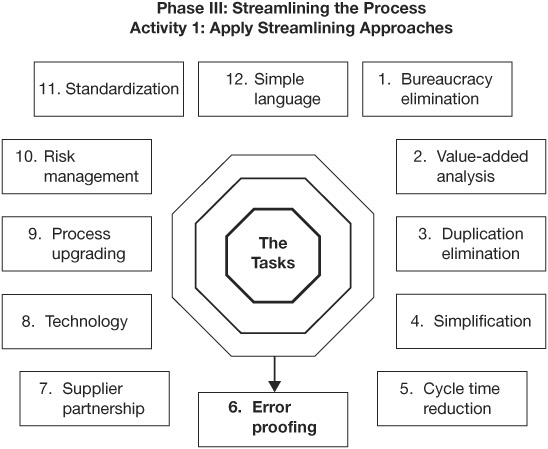
Figure 5.27 Task 6. Error Proofing
To err is human, but to be paid for it is divine.
—H. James Harrington
Error proofing is a task that requires a very deliberate focus since we have a tendency to accept errors as a way of life. We live with them, we put up with them, and we do little to prevent them. As much as we dislike errors, there are many reasons why we don’t eliminate them. Some of them are:
• Lack of time. “I don’t have the time now.” The reason we don’t have the time to fix it today is that we didn’t take the time to do it right yesterday.
• Lack of problem ownership. “It’s not my problem—Joe did it wrong; let him fix it.” The lack of problem ownership causes many problems to stay with us when they could have been solved in a very simple way.
• Lack of recognition. “Sure, I could tell Joe that he is doing it wrong and show him how to do it right, but that doesn’t give me any points with my boss. All it does is put me behind schedule and make Joe look better.” Management needs to find ways to recognize people who go out of their way to help correct problems, who take the time to do the job right every time.
• Errors as a way of life. “Mistakes are bound to happen—we’re only human.” This type of attitude is the beginning of the end for a company.
• Ignorance of the importance of the problem. “It is just a little burr; it will fall off sometime.” But what if it sometimes occurs in a precision servo system that is used to navigate a plane and it jams the gears? Every job is important; it if isn’t, it should not be done. An error that is repeated is unforgivable.
• Belief that no one can do anything about some problems. “You can’t do anything about it” is no answer to a real problem. It may cost too much to prevent it from recurring, but don’t stop short of finding out what it would cost.
• Poor balance by upper management among schedule, cost, and quality. If management places priority on quality, schedules and cost will take care of themselves. Remember, the bitterness of shipping poor quality lingers long after the sweetness of meeting schedules.
• People who try to protect themselves. All too often, people are more interested in proving that the problem was not caused by them than in solving the problem. When such people realize that a problem is coming close to their front porch, they add a detour route so that the problem takes much longer to solve than it should have.
• Head hunting by management. If management is more interested in placing blame than eliminating the problem, the error-prevention program is doomed.
There are three major ways to protect your customers from receiving errors:
• Eliminate errors at their source before they occur.
• Detect an error in the process of doing it before it results in a defect.
• Detect an error after it has been created but before it reaches the next operation.
Negative Analysis—Reverse Thinking
To error-proof our processes, we use a technique called negative analysis which is sometimes called reverse thinking. When using this approach, we ask ourselves, What would we do if we want the process to fail? Then we will design a process to prevent the identified conditions from occurring.
Let’s assume you were opening a restaurant and you wanted it to fail. Some of the things that would cause it to fail are:
• Poor food
• Poor parking
• Poor attitude of waiters and waitresses
• Poor location
• No or little signage identifying the restaurant
• Poor menu choices
• Dirty dining area
• Uncomfortable seating
• Dirty glasses
Looking at just one of the reasons—dirty glasses—you would be sure, in your quest to prevent errors, that the automatic dishwasher would remove lipstick from glasses and that the glasses would be stored on a closed shelf.
Typical error-proofing methods are:
• Put all letters in envelopes with plastic windows to reveal the name and address. Not only does this save much typing time, but also it eliminates letters being sent to the wrong person.
• Use different-colored paper for different jobs to help direct correspondence to the right location. Different-colored paper for each day quickly tells everyone what needs to be done today. Different-colored folders for different jobs give the same message. Proper use of colors will greatly reduce errors.
• Put confidential information on paper preprinted with the words “Do not copy” in large thin letters on each page. This is more effective than typing “confidential” on the page, but do both if it makes you feel more comfortable.
• Use preprinted lists for repetitive mailing. It is more accurate to delete names for one-of-a-kind mailing than to retype the names.
• Use longer paper if you want the document to be given special care. If you normally use 8½ × 11, go for legal-size paper so that the document will stand out.
• Use computer programs that check spelling, and check the input to ensure that letters, not numbers, and vice versa, are recorded in the correct places on a form. This double-check saves a lot of errors.
• Make sure the on-off switch is out of the way on your computer so that you can’t turn it off in error and lose your data.
• Select a phone without a disconnect button. Too often, employees hit the disconnect button instead of the hold button, and a customer is lost.
• Ensure effective communication by asking employees to repeat instructions to be sure they are understood.
• Write down any directions to employees for their future reference.
• Use cross-checking when totaling a number of columns.
You need to error-proof your communications also. (See Figure 5.28.)
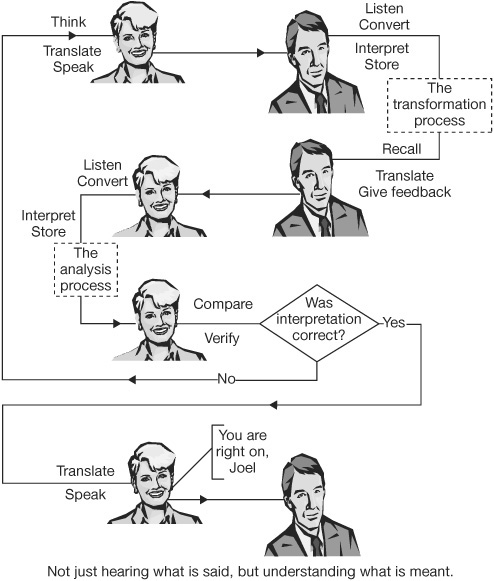
Figure 5.28 Error-proofing the communication process
Task 7. Supplier Partnership (Figure 5.29)

Figure 5.29 Task 7. Supplier Partnership
If your people are your most important asset, then your suppliers run a very close second.
—H. James Harrington
The relationship between you and your suppliers should be a lot like the relationship between a husband and a wife. It should be a partnership (see Figure 5.29) in which both parties need to go more than 50 percent of the way if it’s going to be successful. The old attitude of “I give them 100 percent good money; they should give me 100 percent good inputs” is gone. When things go wrong today, it is usually the result of a complex situation where both parties suffer. (See Figure 5.30.) (Note: In the Figure 5.30 case the second delay was caused because the employee supplied accounting bad data in the first place.) Today suppliers and customers need to develop a partnership-type relationship that provides a win-win environment for both parties.

Figure 5.30 Suppliers are important
The PIT now looks at each input to each activity and asks questions like:
• Did the receiving party (customer) define to the supplier exactly what is needed, and have the parties agreed on how it is to be measured?
• Is the supplier providing more than the receiving party requires?
• Does the input come into the receiving party (customer) in the most usable format?
• Does the input arrive too early, causing storage problems?
• Does the input come late, slowing down the process?
• Is the quality good enough so that the receiving party (customer) does not need to check it?
• What would happen if the input was eliminated?
• Is there a way to eliminate the need for the input?
• Is there a better source for the input that is cheaper or higher quality or both?
Figure 5.31 shows a simple activity’s interface with the process’ suppliers. Because each activity within itself is both a customer and a supplier, the total interfaces are twice as complex. (See Figure 5.32.)

Figure 5.31 Interface between the process and the suppliers
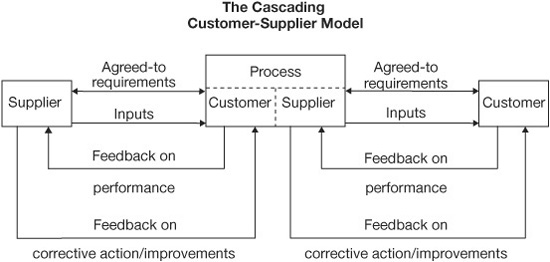
Figure 5.32 The cascading customer/supplier model
All activities within the process are highly dependent upon people outside of the activity that provide input in the form of materials, information, and ideas. Just as you as the provider of your process are a supplier of products or services to your customer, the people that provide input into your process or activity are your suppliers. In these supplier-customer relationships both parties have responsibilities. The PIT has the responsibility to provide the process’ suppliers with documented input specifications that define the process’ needs and expectations. The supplier should carefully review these specifications and agree that he or she can meet the requirements. If the supplier cannot, the PIT needs to work with the supplier to understand what can be supplied and to help the supplier develop a plan to upgrade his or her output if necessary. The customer should never ask for more than is needed and will be used. Remember, nothing is free; everything costs the organization that created it something. The customer may not pay for it directly, but it cost someone somewhere time and effort.
Task 8. Technology (Figure 5.33)
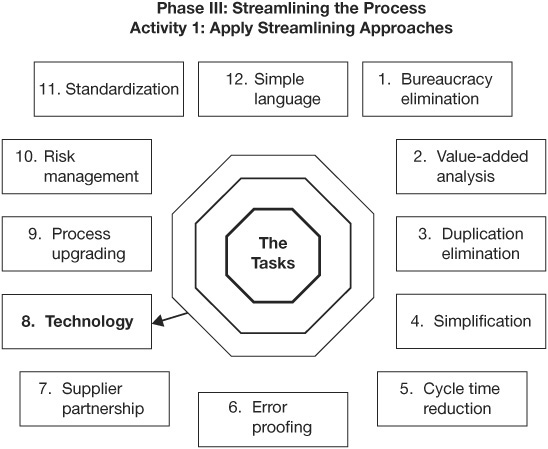
Figure 5.33 Task 8. Technology
To begin this section we first want to define technology. We use it as an umbrella term that includes automation, mechanization, computerization, and information technology.
In 1991 for the first time ever, companies spent more money on computing and communications gear than the combined monies spent on industrial, mining, farm, and construction equipment. Over two-thirds of U.S. employees work in the service sector, and knowledge is our most important product. Now is the time in the streamlining process to make use of the money your organization has already invested in technology to speed up the process that is being improved and reduce the cost. The cost of computing power drops about 30 percent per year, and microchips are doubling in performance power every year and a half. The birthday card that plays “Happy Birthday” when it is opened has more computer power than existed in the entire world before 1950. Your wristwatch has more computer power than existed before 1961. The video camera you use to take home movies has more processing power than the IBM 360 system that was the product that started the mainframe computer age.
With all these rapid improvements in technology, there often is a better way to use technology in the process than is being used at the present time. The following list presents some of today’s technology enablers:
• Parallel processing
• High-performance workstations
• Laptop and handheld computers
• Disk arrays
• CD-ROMs
• High-density storage
• Packet radios
• Wireless LANs
• Cellular voice
• ISDN
• VSAT
• LAN/WAN routing
• FDDI
• Frame relays and fast packets
• OSI
• APPC/APPN
• Middleware
• Electronic mail
• EDI
• Voice mail
• Information interchanges
• Architectures
• Operating system services
• Computer-to-PBX links
• Rapid application development
• Code generation
• Object-oriented programming
• Fourth-generation language (4GL)
• Repository
• Relational DBMS
• Object-oriented DBMS
• Distributed DBMS
• Expert systems
• Neural networks
• Windowing and graphical user interfaces
• Pen-based computing
• Voice recognition and speech synthesis
• Bar coding
• Scanning
• Optical character recognition
• Light pens
• Group decision support systems
• Calendaring
• Multimedia
• Compound documents
• Video conferencing
• Fax
• Desktop publishing
• Color
• ODA/ODIF
Table 5.12 provides a list of ways that IT can impact process design.
You may feel it is late in the SPI cycle to think about the use of IT and automation applications, as many of these applications could have been identified during any one of the preceding tasks. You are right. In streamlining the process you probably have already observed opportunities to apply automation, mechanization, and IT applications since most organizations already use computers for at least some business functions.
We recommend that as IT potential applications are identified, they are added to the parking list (a list of ideas that will be discussed later). This provides the PIT with an excellent starting point for Task #8. The cost of computerizing a poor process is immense, and all it does is allow the organization to produce poor output even faster.
Table 5.12 IT Capabilities and Their Organizational Impact

IT can produce at super-human speed either brilliant guidance or business garbage.
—H. James Harrington
You should never consider automating or computerizing your process until your process is streamlined. Time after time we have identified processes that can be simplified to the point that there is no need for expensive computerization.
In this task we address two very different types of applications:
• Movement of physical objects
• Movement and analysis of data
Now we can talk about turning data into information and turning information into wisdom and action.
—Paulette Everhart, Corporate Controller, EDS (CFO, 1996)
Movement of physical objects is primarily directed at in-process and finished-goods inventory. To accomplish this, we look at our revised process to identify places where there are:
• Things picked up
• Movement of people
• Storage
• Product being moved
• Things that are being done by hand
• People who have to shift from doing one thing to another
It is the PIT’s objective to automate repetitive jobs and activities. Typical automation activities are:
• Storage and pulling of stock
• Painting operations
• Welding operations
• Filling operations
• Continuous flow line
• Phone message systems
• E-mail reservation systems
• Cranes in construction application
• Container shipments
• Hydraulic lifts
• Computerized production equipment
• Packaging equipment
It doesn’t have to be complex and costly; simply putting rollers on a skid can keep the operators from having to get up and find a forklift to move the skid into their work area.
Robotics has been a real breakthrough. Today robots can do almost every repetitive job that a human can do, and they do it better. This has eliminated many of the health and safety problems that organizations face and much of the fatigue in the individual worker’s job.
In terms of movement and analysis of data, this is the area where IT shines. IT concepts were originated to handle data at speeds that are impossible for people to attain (literally processing billions of calculations in microseconds). Today we exist in a service economy in which our major products are not physical items. The Internet has opened the world to everyone. I can sit in my office in Dubai and talk to Marcos Bertin in Argentina while visually watching his reaction through Skype for free. We run our business relying on a whole set of acronyms to help us make decisions. These include things like CRM, ERP, SAP, and MRP2. More and more, the computer is replacing the human factor. Human beings and errors are being removed from our business and replaced by software projects.
Look for the following applications where IT can have a big impact on process performance:
• Processor capacity
• Processor portability
• Storage
• Portable networking
• Remote site networking
• LAN interconnecting
• Computer interoperability
• Network computing
• Network message services
• Applications portability
• Application development technologies
• Data management
• Knowledge systems
• User interface
• Information entry
• Groupware
• Multimedia communications and processes
Unfortunately IT solutions may not give you the projected return on investment because your competition is implementing similar service software solutions at the same time. As a result, you get no competitive advantage; quite the contrary—not putting in these solutions puts you at a competitive disadvantage. This is forcing organizations to keep pace with the current state of software development. Savings only occur in reduced in-house cost and decreased error rate.
The effective computerization of operations requires teamwork by people throughout the organization, as many different organizations are usually affected. For example, when Ford installed at the receiving dock computer terminals capable of reading packing slips, the number of people required to issue payment to suppliers decreased by 75 percent. As an order arrives, the Ford employee using the computer reads the parts packing slip, confirming that the price on the slip is the one Ford agreed to pay. As soon as everything clears in the computer system, the check is written automatically by the machine and sent out. The success of this change depended on the cooperation among many people from purchasing, manufacturing, finance, information systems, personnel, and the union. Finance worried that the early payment to the suppliers would be more costly than the savings. The union worried about the loss of jobs. Each of these concerns needed to be addressed before the system could be implemented.
When a parts clerk at Honda needs a part, his or her transfer terminal looks at 10 different warehouses to define the status at each warehouse and determine which warehouse can get the part to the parts clerk the fastest. A similar network is used by Digital Equipment Corporation, slashing inventory cost by over half during a five-year period. Today we are combining telecommunication, local area networks, and data network systems to maximize the handling of data. Combining one or more technologies keeps people in touch with one another and provides them with the latest information.
American President Line (APL) has established a system that allows a customer to call APL to find the location of a ship on which he or she has merchandise. The caller is connected to a computer that goes through a space satellite and land-based communication links—all of this within 10 seconds—to generate a computer voice response that specifically addresses the customer’s questions.
What Can IT Do for Your Process?
Often insufficient time is expended at the start of IT projects to set strategic targets and plan accordingly. The focus on achieving quick results by adopting IT-based solutions leads to the problems of lack of integration, employee resistance, insufficient training, and ultimately poor morale, particularly if the people perceive that the IT project is a smoke screen for downsizing through productivity improvements.
The following IT tools are most often used (Neubauer, 2009):
• ERP systems—52 percent
• Proprietary systems—57 percent
• WFM—45 percent
• CRM—44 percent
• Groupware—50 percent
• Portal solutions—29 percent
• SCM—15 percent
• EAI solutions—8 percent
The object of this task is to apply current IT, automation, and mechanization approaches to the processes being streamlined, not to create new IT requirements for a supplier. (Note: Process reengineering activities usually result in requiring new and more advanced software packages to be developed.)
We wanted our teams to design the best processes and then find the best applications to automate them.
—Harry Beeth, Assistant Controller, IBM Corporate Headquarters (CFO, 1996)
As an example, through the use of IT technologies and other SPI-type approaches the labor required per transaction at ESD Corp.’s billing and budgeting processes has gone down 82 percent per transaction. According to Mark Andrews of EDS, “As we look at the billing process, we see that many organizations—Finance, Operations, legal and so on—have pieces of information about the customer. We have built a knowledge warehouse that EDS does business with.”
Task 9. Process Upgrading (Figure 5.34)
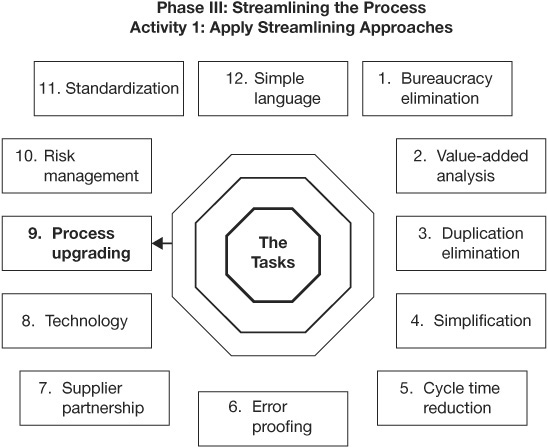
Figure 5.34 Task 9. Process Upgrading
A well-designed work layout makes happy workers.
—H. James Harrington
At the very beginning of this activity I wrote about the evils of the seven types of waste as defined by Lean Six Sigma:
• Production
• Wait time
• Transportation
• Inventory
• Motion
• Errors
In the previous eight tasks, we have attacked most of the types of waste, but now is the time to step back and be sure we have addressed all the opportunities. To do that, we will use some of the Lean methodology approaches that Henry Ford, Sr., used in the early 1900s. All the basic principles of Lean manufacturing appear in Ford’s My Life and Work (1922), Today and Tomorrow (1926), and Moving Forward (1930). These books also describe all the quality and productivity improvement techniques that Japan made famous, including Kaizen (continuous improvement), Poka Yoke (error proofing), Muda (waste), and Muri (strain reduction and even elements of 5S). Lean and Just-in-Time manufacturing are Henry Ford’s inventions, as he was the first industrialist to combine them into a mutually supporting comprehensive system. Ford stated that he didn’t own a single warehouse. He noted, “We will not put into our establishment anything that is useless.” That is a good definition of today’s Lean approaches.
Lean is defined as the elimination of all non-value-added activities from the business. Lean enterprise extends this concept through the entire value stream or supply chain.
It is the little things that are hard to see—the awkward little methods of doing things that have grown up and which no one notices. And since manufacturing is solely a matter of detail, these little things develop, when added together, into very big things.
—Ford (1930)
Lean, as it is practiced today, covers many of the best approaches that we have already discussed and one or two that still need to be discussed:
• 5S
• Error proofing
• Reduced inventory (Just-in-Time)
• One-piece flow
• Quick changeover
• Theory of constraints
• Work flow diagrams
Even though we have addressed many of these approaches earlier in this book, it is good practice to look at the simulation model to be sure that all the possible waste creators have been minimized.
The PIT has now significantly improved the process. This is the time to look at the individual operations to see that they are optimized and then at the total process to see if the organization is in line with the process.
The 5S Workstation Layout
Everything that a person uses should be within his or her reach.
—H. James Harrington
We will start this analysis by looking at the layout within the work areas to minimize movement and storage. To do this, we will use many of the Lean tools. One of the most powerful tools is 5S, sometimes called the Five Pillars. It is designed to organize the workplace.
Although parts of the 5S concept have been practiced in the United States and Europe since the early1940s, the idea of putting them all together in an approach called 5S was originated in Japan by Hiroyuki Hirano. A translation of the original 5S terms from Japanese to English went like this:
• Seiri—Organization
• Seiton—Orderliness
• Seiso—Cleanliness
• Seiketsu—Standardized Cleanup
• Shitsuke—Discipline
In order to assist users of this tool to remember the elements, the original terminology has been retranslated to the following:
• Sort
• Set in Order
• Shine
• Standardize
• Sustain
In the original book, 5 Pillars of the Visual Workplace (Hirano, 1990), the word pillar is used as a metaphor to mean “one of a group of structural elements that together support a structural system.”
Some guys who were here when I started weren’t too excited about 5S; they saw change as bad. But once they started seeing improvements, everybody got on board.
—Jason Bloy, Machinist, G&G Machine Inc.
(Southwest Research Institute, 2010)
A Description of the Five Pillars
Now let’s look at each of the five pillars, one at a time.
The first pillar—Sort. Removing all items from the workplace that are not needed for the current operation
As easy as this seems, it is often difficult to identify what is needed versus what is wanted.
Getting rid of items in the workplace can be stressful. People tend to hang onto parts, equipment, and tools, thinking that they may be needed for future orders or operations. This causes inventory and equipment to accumulate and get in the way of everyday production activities. Files grow and grow, filling up with unneeded and unused documents and slowing down the process of finding needed documents. If everyone does this, it can lead to a massive buildup of waste across the organization.
The following types of waste lead to errors, defects, and an unmanageable work space:
• Unneeded inventory creates extra costs, such as storage space and management.
• Unneeded transportation of parts requires extra pallets and carts.
• The larger the amount, the harder it is to sort out needed inventory from unneeded inventory.
• Large quantities of stocked items become obsolete due to engineering changes, limited shelf life, etc.
• Quality-related defects result from unneeded in-process inventory and machine breakdowns.
• Unneeded equipment poses a daily obstacle to production activities.
The presence of unneeded items makes designing equipment layout more difficult.
One word of caution: be careful about what you throw away. Sometimes you will need an unused item at a later date that you cannot go out and acquire. For example, I got rid of all the technical reports that were over 10 years old in 2005. It was not six months later that I needed a copy of a report I wrote in 1986 to prove a copyright problem, and I could not produce one. It was typed on an old software program and stored on a floppy disk that no one could read.
The second pillar—Set in Order. Arranging needed items so that they are easy to use and labeling them so that they are easy to find and put away
This activity should always be implemented with Sort. Once everything is sorted through, only what is necessary to the task remains. Next it should be made clear where these things belong so that anyone can immediately understand where to find them, as well as where to return them. For example, the outline of every tool can be painted on the surface where it should be stored.
The third pillar—Shine. Keeping the work space clean
The third pillar includes sweeping floors, emptying trash, wiping down machinery after use, cleaning up spills, etc. It also includes having a clean, clear deck at the end of the day. In a manufacturing organization and the support areas, this activity is closely related to the ability to produce quality outputs. Shine also includes saving labor by finding ways to prevent dirt, dust, and debris from piling up in the office and manufacturing and support areas. In the support areas, having a clean, neat desk when you leave at the end of the day is a best practice.
Shine should be designed into the preventive maintenance process to combine cleaning checkpoints with maintenance checkpoints.
The fourth pillar—Standardize. Doing it the same way each time
The Standardize activity differs from Sort, Set in Order, and Shine in that the first three pillars can be thought of as activities, as something we do. However, Standardize is the activity you use to maintain these first three pillars.
This activity is related to each of the first three pillars, but it relates most strongly to Shine. It results when we keep machines, desks, files, offices, and their surroundings free of debris, oil, and dirt. It is the condition that exists after we have practiced Shine for some time.
The fifth pillar—Sustain. Making a habit of properly maintaining correct policies and procedures
The first four pillars can be implemented without difficulty if the workplace is one where the employees commit to sustaining 5S conditions. Such a workplace is likely to have high productivity as well as high quality.
In many organizations much time and effort are spent in vain sorting and cleaning because the company lacks the discipline to maintain and continue 5S implementation on a daily basis. As with all continuous improvement tools, if the process does not have the Sustain pillar, the other pillars will not last long.
Benefits of 5S Implementation for You and Your Organization Implementing 5S should have many benefits for you:
• It can give you an opportunity to provide input regarding how your workplace should be organized and laid out and how your work should be done.
• It can make the workplace more pleasant to work in.
• It can make the job more satisfying.
• It can remove some of the obstacles and frustrations related to the work.
• It can make it easier to communicate with everyone in the workplace.
Using 5S, G&G Machine Inc. threw out 150 tons of material it didn’t need, and it found room to add a weld shop and install larger, more efficient machines in space it didn’t know it had (Southwest Research Institute, 2010).
Your organization can also experience many benefits from implementing the five pillars. It can:
• Increase product diversity.
• Raise quality.
• Lower costs.
• Encourage reliable deliveries.
• Build customer confidence.
• Promote corporate growth.
Table 5.13 provides an example of a 5S checklist for a drill press.
The 5S method is a very effective and yet simple way to save money. For example, at Ceradyne, Inc., the cost savings from implementing 5S (plus safety—see the section below where we discuss safety as the sixth S) exceeded $900,000 annually. In the hot press department during the first three months of using 5S, Ceradyne realized a 25 percent increase in productivity. (California Manufacturing Technology Consulting, 2010).
Table 5.13 5S Checklist for a Drill Press
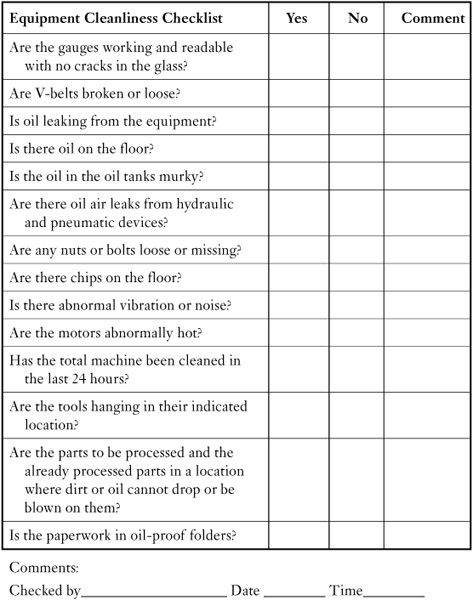
For another example, St. Louis Community College (St. Louis Community College Center for Business, Industry & Labor, 2011) reports that organizations that implement 5S have realized savings such as:
• $300,000 in inventory cost at one facility
• $6,000 reduction in office supply expenses in the first month
• $1.2 million per year
• Cycle time reduced from 15 to 3 days
• Space reduced by 50 percent
• Manufacturing productivity up over 30 percent
We like to add a sixth S—it is safety. The other five Ss can reduce cycle time and save money, but you do not want to end up by creating an unsafe environment. So be sure you use all six Ss when you are streamlining your process.
We have found it helpful to use a four-step approach to get a 6S process started in an organization:
Step 1. Define the area where it will be applied and set up a 6S team. Provide all the team members with 6S training.
Step 2. Identify unnecessary or infrequently used equipment and red-tag it. Often red tags are used also to identify things that are out of place or inconvenient or a safety hazard. These red-tagged items are assigned a control number and are targets for corrective action.
Step 3. Straighten the area. The infrequently used items are removed from the files and work areas. Permanent and best-home locations are defined and labeled for the things that are often used. Everything is labeled and put in its place. Then everything in the place is scrubbed clean.
Step 4. Individuals are assigned to maintain the 6S advancements. An audit team is assigned to measure compliance to the 6S standards.
When the Aircraft Directorate at Ogden Air Logistics Center went through this cycle (Southwest Research Institute, 2010), it resulted in:
• $680,000 savings a year
• Decreased flow time from 15 to 4 days for the pylon rib process
• Reduced overtime from between 18 and 25 percent down to less than 5 percent
Upgrading the Office Areas
Management knows the importance of upgrading the equipment in the manufacturing operations. The same is true for the support areas. Old computers that run slow and don’t interface well with each other can cause more problems than an old lathe in the machine shop. Look around the office. Is the copier up and running, or is it down half the time? How far does the engineer have to go to get a copy of a document? How hard is it to copy on both sides of a sheet of paper? Is the scanner good enough to scan a document, or do you have to retype it? Can you sign documents electronically, or do you need to process paper to get a signature? Is each computer backed up two or three times a day; or when there is a problem, do you lose weeks of information that may never be replaced? Do the people who use the phone a lot have a headset that allows them to free up a hand when talking on the phone? Do you microfilm the documents that need to be filed to reduce space and recovery time? Are you using bar coding on documents to keep track of where they are and how long they have been there? Are you using voice recorders on your phone to save time so individuals don’t have to call back? (This often saves days of cycle time.) Do all your key people have pagers?
Have you designed the office to a so-called effective office design where the size and features throughout the office are the same? If you did, you probably have a very nice looking office that doesn’t meet the needs of some, if not most, of your people. People are not all the same size. Some jobs require more work space than others. I need a bigger, wider chair; Mary needs a small one. A programmer with a lot of printouts on his desk needs a different desk than another engineer or salesperson might need. It may not look as neat, but customizing the office to the individual improves morale, effectiveness, and efficiency.
Lighting also is important. Does the light cast a shadow over the work area? Are you taking maximum advantage of the natural light? Does the light reflect on the computer screens? Is the light too bright or too dim?
Is the room laid out so that drafts are minimized, and does the layout ensure even, adequate cooling and heating throughout the entire work area? Does the color scheme reflect the mood you want to set in the office? The color of the walls and the furniture has a major impact on the attitude and productivity of your people.
The work environment itself can promote or hinder productivity. As early as the 1900s, both Frederick Winslow Taylor and Frank Bunker Gilbreth, Sr., recognized the importance of the environment and its influence upon productivity and job satisfaction. Ventilation, air-conditioning, heating, lighting, colors, and even music and entertainment can all influence productivity. ISO 9000 specifically requires that the work environment be suitable to the job.
Maintaining desired temperature in summer as well as winter by forcing into workrooms air that has been passed over heating or refrigeration coils has a great effect on the workman. Many factories, such as chocolate factories, have found that cooling the air for better results to the manufacturing also enables workers to produce more output—an output quite out of proportion to the cost of providing the cooling.
—Gilbreth (1911)
Good lighting, heating and ventilation pay. A factory manager by painting the walls cream-white toned up his whole working force. Hard to measure, he could “feel” the improvement brought about by this simple means.
—The System Company (1911)
The well-known Hawthorne study revealed that productivity went up as the light intensity was increased. Unfortunately, productivity went up also when the light intensity decreased. These production improvements were largely the result of the worker receiving attention related to the experiments. But further studies revealed that having the proper level of lighting is critical to productivity and quality of the outputs.
Gilbreth (1911) wrote:
The subject of lighting has, indirectly as well as directly, a great influence upon output and motion, as upon the comfort of the eye depends, to a large extent, the comfort of the total body. The arrangement of lighting in the average office, factory, or house is generally determined by putting in the least light necessary in order that the one who determined the location of the light may be able to see perfectly. This is wrong. The best light is the cheapest. By that is not meant which gives the brightest light.
In fact, the light itself is but a part of the question…A light to be right must pass five tests:
1. It must furnish the user sufficient light so he can see.
2. It must be so placed that it doesn’t cause the user’s eyes to change the size of diaphragm when ordinarily using the light.
3. It must be steady.
4. There should not be any polished surfaces in its vicinity that will reflect an unnecessary bright spot anywhere that can be seen by the eyes of the worker.
5. It must be protected so that it doesn’t shine in the eyes of some other worker.
… For the work done on a flat surface, like the work of a bookkeeper or a reader, the light should be placed where the glare will reflect the least in the worker’s eyes … It is wholly a question of fatigue of the worker. The best lighting conditions will reduce the percentage of time required for rest for overcoming fatigue. The difference between the cost of the best lighting and the poorest is nothing compared with the saving in money due to decreased time for rest period due to less fatigued eyes.
I fly business class, and I do a lot of my writing while flying. One of my pet peeves is the location of the lights on the airplane. All too often they are located so the shadow of my hand (I’m right-handed) covers the areas I am writing on, making it impossible to work effectively. You would think by now that Boeing would know where to place the lights on a 747.
Fluorescent lights can also be a problem; they don’t admit white light. White light is the kind that the human eye is designed to work with. White light has a continuous rainbow spectrum; fluorescent lights have several bands depending upon the kind of gas inside the tube.
The No-Value-Added Parts in Value-Added Activities
We evaluated each task in the process and defined it as no-value-added, business-value-added, or value-added. But this was not enough—we now need to take our microscope out and look within the value-added activities because few tasks are all value-added. Take, for example, the task of addressing and mailing an envelope:
1. Search the in-box to find the letter—1.0 minute
2. Read the letter to know whom it is going to—0.5 minute
3. Look for the right-size envelope—1.0 minutes
4. Go to the printer and put the envelope in the printer—2.0 minutes
5. Return to desk—2.0 minutes
6. Move the cursor to the address book—0.2 minute
7. Bring up the address book—0.5 minute
8. Find the name of the person the letter will be going to—0.2 minute
9. Send the name and address to the printer—0.1 minute
10. Go to the printer and pick up the envelope—2.0 minute
11. Return to desk—2.0 minute
12. Put the letter in the envelope—0.3 minute
13. Seal the envelope—0.2 minute
14. Find a stamp and put it on the envelope—3.0 minutes
15. Take the envelope to the mail drop—4.0 minutes
16. Stop on the way to talk to a friend or get a cup of coffee—5.0 minutes
17. Go back to desk—3.0 minutes
All these tasks took a total of 27.0 minutes.
Addressing and mailing the envelope was a value-added activity that took 27.0 minutes to accomplish. The real value-added-activities were only tasks 6, 7, 8, 9, 12, and 13 which took only 1.5 minute. The other tasks are no-value-added but are required to do the value-added task. Each of these tasks is a candidate for elimination or at least is a target for reducing the time it takes to do the tasks. For example, the task of looking for the right-size envelope would be eliminated if all letters went out in the same-size envelope. Or the time looking for a stamp could be reduced if the mail room put stamps on all outgoing mail. The time to go to the printer could be reduced if a personal printer was put on every desk. To take it a step further—question why it had to go out as a letter and could not have gone out as an e-mail.
Managing Process Flow
First, define what the output from the process per time interval needs to be, e.g., one every 15 minutes. Then look at each of the activities, as each should be equal to or less than the output requirements for that process. If any of the activities in the process is greater than the takt time, the workload at that activity needs to be adjusted. Takt time is the heartbeat of any process.
Theory of Constraints
The theory of constraints was highlighted in Dr. Elyahu M. Goldratt’s book entitled The Goal: A Process of Ongoing Improvement (1993). The theory of constraints is based on the belief that any manageable system is limited to achieving its goals by a very small number of constraints. And there is always at least one constraint in every process.
The theory of constraints seeks to identify constraints within a process and restructure the rest of the organization around it. The theory of constraints and takt time have many things in common. They both focus on the limitations of the process, reductions in inventory, and production of the appropriate number of items as required by the external customer.
A constraint is any activity or step in a process that can’t deliver as much output per time period as all the other activities or steps in that process. It limits the flow through the total process. For example, suppose the customer requirements are 100 units/day, or 12.5 units/hour average, and the process has five activities.
• Activity 1. Pull parts from stock—20 parts/hour.
• Activity 2. Weld part a and part b together—15/hour.
• Activity 3. Assemble items—6/hour.
• Activity 4. Test assembly—18/hour.
• Activity 5. Pack for delivery—20/hour.
In this case, Activity 3 is the constraint.
To give an example of a nonmanufacturing process, let’s look at a sales process where the requirements from the company for the salesperson are 15 sales calls per week. It is made up of a six-activity process:
• Activity 1 (A1). Secretary sets up a meeting schedule—(1.3 activities per hr, or 10.4 activities per 8 hrs = 0.77/hr per activity).
• Activity 2 (A2). Assistant salesperson prepares sales package—(2.0 activities per hr, or 16 activities per 8 hrs = 0.5/hr per activity).
• Activity 3 (A3). Salesperson travels to meeting—(0.625 activities per hr, or 5.0 activities per 8 hrs = 1.6/hrs per activity)
• Activity 4 (A4). Salesperson meets with client—(1.0 activities per hr, or 8.0 activities per 8 hrs = 1.0/hrs per activity)
• Activity 5 (A5). Salesperson sends in order—(10.0 activities per hr, or 80 activities per 8 hrs = 0.1 hrs/per activity)
• Activity 6 (A6). Production specialist enters order into system—(10.0 activities per hr, or 80 activities per 8 hrs = 0.1hr/per activity)
Based upon this data, the total hours invested in an individual sales call is 3.3 hours. In this case, the constraint is the salesperson’s time, as he or she is responsible for Activities 3, 4, and 5 (sales person hrs. per call = A3+A4+A5 = 1.6 + 1.0 + 0.1= 2.7 hrs per sales call.) Assuming an 8-hour day, the maximum number of sales calls a salesperson can make is 3 per day. The next limiting activity is Activity 1 that can support 10 sales calls per day. This means that this process can support a total of 3 sales people with ease.
To increase throughput in the process, either we need to reduce the time it takes the salesperson to make a call, or we need to add an additional salesperson to the process.
The theory of constraints is based upon the assumption that organizations can be measured and controlled in three measurements: throughput, inventory, and operating expense. We will define the three measurements as follows:
• Throughput (or money from sales). The measure of the marginal profit at each transaction, not the cost accounting value. It is the sales price minus the cost of raw materials. Of course, lead time plays a major role because it is the time between when the order is accepted and when the order is delivered. Henry Ford was able to have negative inventory turns because he received payments before he had to pay for the raw materials. Harley Davidson has accomplished this in the modern environment.
• Inventory. The money that the system must invest in the items it intends to sell.
• Operating expense. The money that the system expends to convert inventory into output.
The theory of constraints is based upon the assumption that only by increasing the efficiency (flow-through) of the constraint operation can overall output be increased. It makes use of a four-step approach to accomplish this that focuses on an existing or proposed future-state solution flowchart:
Step 1. Identify the constraint.
Step 2. Decide how to maximize throughput through the constraint.
Step 3. Design all other activities to support smooth flow through the activities.
Step 4. Evaluate the constraint to determine if increased capacity is required.
Note: If the constraint is removed from one operation, the constraint will move to another part of the process.
For additional improvement, refocus your effort back to Step 1, focusing on the new constraint area.
The theory of constraints applies both to constraints that are internal to the organization and to constraints that are external to the organization. Internal constraints exist when the market requires more from the system than it can deliver. External constraints occur when the external market is not capable of accepting everything that the process can produce.
Visual Office
Knowledge is power. Keeping the employees informed is one of the best ways to ensure that the process continues to flow smoothly. The visual office is a key part of keeping the employees focused on key measurements. The visual office makes use of quick feedback to the employee on how the natural workteam is doing. For example, a large display located where employees can see it provides call center personnel with the number of minutes the average caller is waiting for his or her call to be answered by a live person. This display is updated every three minutes. A second number on the screen shows the average for the day that callers have been waiting, and a third number on the screen shows the longest wait time for any single caller for the day. On the bulletin board in the area, the wait-time distribution for the previous day is posted every morning along with a statistical analysis of the wait time. The second monitor in the area shows the same information for the call processing time.
The key is to look for measurements that are important and reflect the activities that are going on right now in the area. In an assembly department it could be the number of units per hour that are completed, or maybe in an inspection station it might be the percentage of defective units. We have seen sales offices where the amount of sales for each salesperson is posted on a monitor when there is a quick turnover of sales or on a bulletin board when the sales cycle is longer.
The bulletin board is also part of the visual office. Often the work going on in the area does not lend itself to a minute-by-minute feedback situation. In these cases, the bulletin board provides the visual feedback to the employees. For example, we have seen banks where the customer-satisfaction level per person servicing a customer is measured on a daily basis and reported back to them on the following day. A histogram-type graph is posted each week on the bulletin board along with the name of the person who had the highest level of customer satisfaction. This allows each employee to understand how he or she is performing compared to the rest of the staff. The person with the highest customer-satisfaction level for the month is named the employee of the month, and the person’s picture is posted on the bulletin board.
The key is to make a game out of work. Why is it that people will expend so much effort and energy in sports but don’t want to put the same amount of dedication into their work? How popular do you think bowling would be if no one kept score or if you got your score once a month? People like to compete against other people, other teams, or even themselves. A well-designed visual office provides them with this opportunity. People compete in sports because there are set ground rules that everyone understands and the measurements of success or failure are readily available and well understood. You need to create the same conditions in the work environment.
Total Process Alignment and Organizational Restructuring
Now that the individual process steps have been addressed, it is time to look at the process as a whole. To start this task, we must evaluate the organization’s structure. We often find that the old functional structure is no longer viable. Organizations that have been stand-alone need to be combined. Accounts payable becomes part of purchasing. Product engineering and manufacturing engineering are combined. Receiving inspection may become part of purchasing. Sales and marketing are combined. Often the new process defines the organization’s structure: Sometimes all the activities that are involved in the process are combined into one organization managed by the process owner. In other cases the individual people who operate the process report to two managers—the process owner and the functional organization’s manager.
Measure the distance that the product travels and reduce it. Bring together the key people in the process to minimize the travel the document or activity has to go through.
At Aetna, the Hartford-based health-care provider, the people who performed the accounts payable function were moved out of the accounting organization and into the purchasing group. Kathleen A. Murray, chief operating officer at Aetna Business Resources, notes: “And it is not just the megadeals … There will be a lot of little deals where we wouldn’t be a player if we didn’t have purchasing set up the way we do” (CFO, 1996).
In addition, Aetna combined six purchasing organizations into one, speeding up delivery time for purchased items by as much as 15 days, cutting staff by 88 percent, and cutting net material acquisition cost per dollar of items purchased $0.016 (or 1.6 cents).
We set goals for ourselves that seemed impossible, and to actually realize them is true reengineering.
—Kathleen A. Murray, Chief Operating Officer,
Aetna Business Resources (CFO, 1996)
Dun & Bradstreet’s retooling of accounts payable included merging the process with travel and entertainment expense reporting. The project resulted in cost reductions of 75%, headcount reduction of 66% to 25 fulltime employees.
—CFO, 1996
IBM had more than 100 different groups around the world maintaining their own banking and insurance relationships. “We had no idea how much duplication of effort there was and how little coordination,” stated Bob Captello, corporate treasury analyst for IBM. By combining these together, the economy of scale resulted in a $62 million savings per year for IBM. Before combining them, IBM bought insurance through 66 brokers and 203 insurers. IBM reduced this number to 2 and 25, respectively, a move that slashed millions of dollars in premium payments. IBM in two years boosted treasury productivity by 45 percent.
IBM developed an integrated system and data warehouse to serve the company’s information needs on a global basis. The result was a 50 percent staff reduction, a 48 percent gain in productivity, and a 35 percent decrease in cost (CFO, 1996).
Look at the process to determine if the organizational structure complements or detracts from the product flow. Why not locate people involved in the process in the same place under the same manager? Is it more important to keep a functional organizational structure, or should you have a process organizational structure? For example, if you are streamlining the product development process, it makes sense to transfer the mechanical engineers, electrical engineers, quality engineers, and some of the manufacturing people into the development laboratory reporting to a development manager, thereby reducing cost, cycle time, and communications. Don’t freeze your organizational structure. Keep it fluid so that it can be easily adjusted to the changing customer and the process needs.
Task 10. Risk Management (Figure 5.35)
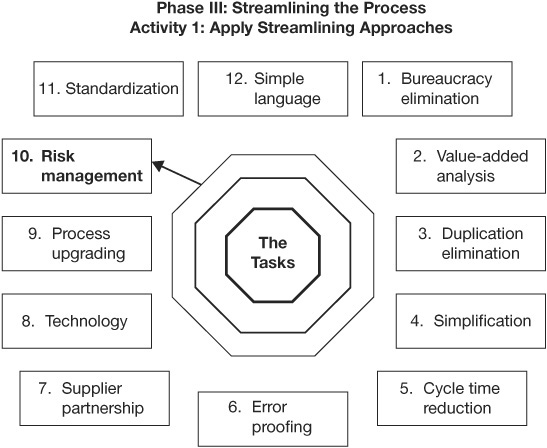
Figure 5.35 Task 10. Risk Management
You will never have all the information you will need to make a decision—if you did, it would be a foregone conclusion, not a decision.
—David Mahoney (1988, p. 156)
Now is the time to step back and determine if you have removed too many non-value-added activities from the process. Ask yourself:
• Is the process protected against unethical behaviors and fraud?
• Are there still enough checks and balances designed into the process to provide the organization with adequate protection?
• What are the risks of the future-state process proposal being turned down?
• Who are the key people that will resist installing the new process?
• Is there any chance that the future-state solution process will have a negative impact upon the customer?
• Is there a risk that the goals set for the streamlining process will not be met?
• Is there a risk that the software packages proposed for the future-state solution will be obsolete before they provide a payback?
• Is there a risk that the proposed future-state solution is not in line with the organization’s culture so it will be rejected by the users?
Often in the PIT’s enthusiasm to remove bureaucracy and no-value-added and business-value-added activities from the process, the team overcorrects, thereby creating more risks of fraud and unethical behavior and producing unhappy customers. A limited amount of checks and balances is needed in most processes. I heard one customer state, “If management does not measure it, it is not important.” The degree of checks and balances that should be part of the process will vary from organization to organization and from country to country. In some countries that I have worked in, it is common practice to pay an individual for favors he or she does for the organization, e.g., giving the organization a contract. In other countries, people would be fired for as much as accepting a pencil set from a supplier unless it was a promotional item with the supplier’s name on it. One of my very dear friends at IBM was released from IBM because he went fishing with a contractor on the contractor’s small 16-foot fishing boat.
If the process that the PIT is working on is a financial or procurement process, the process must be evaluated very closely to be sure that only acceptable risks remain in the future-state process. I have worked with companies when only one signature on the organization’s checks was sufficient and in other organizations where a minimum of two was required due to the culture in the region.
As you identify a risk, analyze it to define how big the risk is and what is its probability of occurring. It is often better to live with some risk—for example, the risk of not being paid the full amount was addressed by EDS. EDS would check to see if the customer’s check matched the invoice. When the amounts did not agree, EDS would classify the difference as a deviation and investigate what caused the discrepancy even if it was just a few cents (CFO, 1996).
Those risks with significant exposures need to be corrected by changing the process or finding another solution to mitigate the problem. For example, you could bond the person who is signing checks, or you could do internal audits of the process without increasing cycle time. The PIT needs to be creative when it adds non-value-added activities back into the process in order not to cause additional costs or delays.
I like to do a survey of the people who will be affected by the change to determine the implementation risk. The survey is called a change-resistance scale, and it is designed to aid in dealing with the human aspects of the adaptability of the specific change. It provides the PIT with insight to determine the overall resistance to an organizational change and its contribution to the risk of implementation failure. Each of the questions is evaluated on a 1-to-10 scale. Typical questions are:
• Do you believe that the change is really needed?
• How compatible is this change with existing organizational values?
• Do you believe the change will impact the way you relate to others in the organization that are important to you?
If your change management activities that were started in Phase I have been effective, there should be little resistance to the proposed new process, as the human aspects of the organization have been adequately informed, have been involved with, and have accepted the future-state solution.
I like to use a computer program to identify problems with the future-state solution that I am working with. The one I use is Anticipatory Failure Determination. It includes two software programs:
1. A failure analysis software program that performs a systematic procedure for identifying the root cause(s) of a failure or other undesirable phenomena in a system and for making corrections in a timely manner
2. A failure prediction software program that performs a systematic procedure for identifying beforehand and preventing all dangerous or harmful events that might be associated with the system
Task 11. Standardization (Figure 5.36)

Figure 5.36 Task 11. Standardization
Standardization does not stop creativity; it just helps everyone benefit from it.
—H. James Harrington
Standardized work flow is finding the most effective way to carry out the present job and getting everyone to use it. The objective is to improve repeatability to reduce variation and proliferation. The correct procedure needs to be documented, and everyone has to be trained to use it so that everyone follows the same approach. Without it, processes cannot be improved. (See Figure 5.37.)
Why not just tell people what results you want and then get out of their way and let them do it any way they would like to? That is what many of the futuristic management consultants are advocating. Well, it sounds good, but, and this is big but, if you do not have a standard process, people will not learn from each other. Everyone can make the same mistake over and over and over again. Each time new employees are assigned to a job, they will start with a zero knowledge base. If many people are doing similar activities, the results will vary from person to person. If you have 10 people doing the job, you will have 10 different processes with 10 different sets of root causes. Process improvement is almost impossible without everyone doing the job the same way. Root causes cannot be identified and processes will not improve and be controlled without standardization. All the work the PIT has done to date is lost.

Figure 5.37 Standardize—then improve
Standardization of work processes is important to be able to project what the process output will look like and how the process will perform. When each person is doing the activity differently, it is difficult, if not impossible, to make major improvements in the process. Standardization is one of the key steps in improving any process. This is accomplished by the use of procedures. Procedures tell management and the employee how the process functions and how to do the activities. These procedures should:
• Be realistic based upon careful analysis.
• Clearly define responsibilities.
• Establish limits of authority.
• Cover emergency situations.
• Be easy to interpret.
• Be easy to understand.
• Explain each document, its purpose, and the issues.
• Define training requirements.
• Define minimum performance standards.
And whenever the new method is found to be markedly superior to the old, it should be adopted as the standard for the whole establishment. The workman should be given the full credit for the improvement, and should be paid cash premium as a reward for his ingenuity.
—Taylor (1911, p. 67), emphasis is ours
Installing the procedures is not enough; certainly the employees have to be trained to use the procedures, and an audit system needs to be put in place to ensure that the employees adhere to the procedures over a long time period. The procedures should not be cast in stone. When a better concept or approach comes along, it should be adopted and documented. It should not be implemented throughout the process until it has been thoroughly checked out and the documented procedures have been changed.
Furthermore, all organizations should have an operating manual. A typical operating manual is made up of two sections. The first section contains executive policies and should include things like:
• Mission statements
• Vision
• Values
• Objectives
• Core competencies and capabilities
• Organization chart
• Roles and responsibilities of the organizational structure
The second part of the operating manual should be the operating procedures. Typically they are broken down into functional groupings. Typical functional groupings could be:
• General operating procedures
• Financial operating procedures
• Human relations operating procedures
• Sales and marketing operating procedures
• Quality and system assurance operating procedures
• Business operations procedures
• Production operating procedures
Operating procedures are used at the cross-functional process level. As we delve into the process to the individual activities and tasks, employees can use work instructions, check sheets, and job descriptions as guidance on how to perform the activities and tasks.
IBM simplified and standardized travel policies, levering technology and taking sufficient steps for getting remuneration back to the travelers. The benefit to IBM included $30 million a year in annual savings. One of the key breakthroughs was an electronic expense form that was filled out on the PC. According to IBM, it takes only 10 minutes to complete the electronic expense form and send it in. Also a tracking system was put in place that allowed the traveler to know the exact status of his or her expense account by telephone voice response. Other things that simplified the process were corporate charge cards for cash advances, paycheck distribution of travel expenses, and imaging of all receipts at central locations. “I submitted my T&E on Friday, and the money was in my bank account on Monday morning,” reported a typical traveler. Quarterly quality surveys indicated nearly 90 percent satisfaction with the new system (CFO, 1996).
Task 12. Simple Language (Figure 5.38)
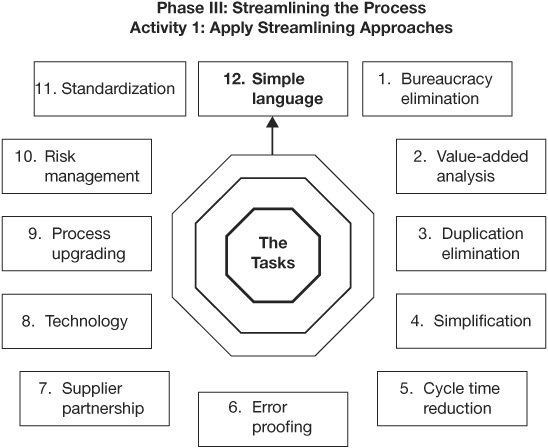
Figure 5.38 Task 12. Simple Language
Keep it simple and it saves time.
—H. James Harrington
Ask yourself the question, Is all this documentation necessary? Managers spend 40 to 60 percent of their time reading and writing job-related materials. And 90 percent of the documents retained are never used. Clerks spend 60 percent of their time on checking, filing, and retrieving information (Harrington, 1991).
There are at least four good reasons to document the existing process:
• To understand the current process. The PIT will be streamlining the current process and working with it as it fits into the organization’s culture today. Without a good understanding of the current process, it is impossible for the PIT to identify improvement opportunities.
• To operate the new process. The new process needs to be well documented so there is no doubt by any of the employees about what they need to do.
• To understand customer values. It is important that the PIT understand what the customer requirements are and what the major objectives are within the process. By understanding the current process, the PIT can identify added-value points from the customer’s perspective.
• To define current problems. The organization must understand the problems it is having with the current process in order to get the support to implement the new process. The new process must be designed so that it eliminates these problems. Very often many of the problems go unrecognized until the entire process is put together and studied.
Too many people write to impress rather than to communicate. They write big, long documents that no one reads. They believe that management rates a report based on its weight, not its content. They don’t consider that a big report takes longer to read and that it costs more to communicate the information. It may take more time to consolidate what you want to communicate, but in the long run it will save the organization money. Too many people use the longest words in the dictionary rather than short, more common words that everybody understands. I have seen procedures written in English for which I had to use a dictionary to understand. Too many procedures and reports are full of acronyms and abbreviation that many of the readers do not know or understand. Studies have proved that a procedure or report written at the tenth grade level compared with a report written at a college graduate level can be read in 30 percent less time with 34 percent better retention by a college graduate. In business, no letter or procedure should be written higher than a tenth grade level.
Procedures that are written by engineers often will be used by people that don’t have a high school degree. As a rule of thumb, you should write procedures at two grade levels lower than the educational level of the least educated people that will be reading it.
If the language you are using is not the readers’ native language, it should be written at least three grade levels lower than their educational level. Some simple ground rules are:
• Be familiar with your audience.
• Understand how familiar your audience is with the terms and abbreviations.
• For procedures that are more than four pages long, include a flowchart.
• Determine the reading and comprehension level of your audience; the document should be written so that all readers can easily comprehend the message.
• Use acronyms with care; don’t force your reader to learn new acronyms unless they are used frequently throughout the report.
• Never use an acronym or abbreviation unless it is defined in the document.
There are many good documents out there that are very short but present a very powerful message. Let me give you some examples:
• The Lord’s Prayer—57 words, very short
• Ten Commandments—71 words, no acronyms
• Gettysburg Address—266 words, easy to understand
• U.S. Declaration of Independence—300 words, to the point
And then there are examples of another kind:
• The U.S. government contractor, management system evaluation program—38,000 words (Would you believe it?)
• The GM repair manuals produced since 1980—they would take 56 years to read!
Evaluate your writing using a readability index. This can be calculated as follows:
• A = average number of words per sentence
• B = percentage of words with 3 or more syllables
• R = readability index = 0.4(A + B)
• 10.1 to 16 = caution
• 16.1 to 22 = dangerous
• Above 22 = ridiculous
Figure 5.39 provides an easy way for you to determine your readability level. Many computers have a program built into them that will calculate your readability index. We recommend that you evaluate the readability of all the documents you prepare.
Forms are another area we do not give the proper thought to before we release them. We allow programmers to design computer input screens and forms that work well with their software package. However, little thought is given about the person that inputs the data to make it easy to implement all the data.
Designing forms is an art. The forms must be directed at saving time for the person who is recording the data and helping the person reduce input errors. They should not be directed at how it is best to enter the data into the computer. Forms should be designed for the user and should use the software to arrange the data so that the data can be used by the software package.
Does a good form make a difference? When the British government agencies focused their attention on form design, errors plummeted and productivity soared.
For example:
• The British Department of Defence revised its travel expense form. The new form reduced errors by 50 percent, the time required to fill it out by 10 percent, and processing time by 15 percent
• By redesigning the application form for legal aid, the British Department of Social Services saved more than 2 million hours per year in processing time.
The NASA Engineering and Safety Council had developed 30 procedures that were well above average in complexity from a benchmarking standpoint (Olson and Kelly, 2005). The agency wanted to shorten and make them more usable. As a result, NASA was able to cut the procedures by 60 percent without affecting technical content. Now the NASA procedures are not only short; they are more usable.

NASA Ames ITSC Development located in Mountain View, California, documented its four key procedures in 19 pages. Similar procedures run over 100 pages.
Be aware of common mistakes when creating documents (Olson and Kelly, 2005):
• Not enough pictures. Most people prefer pictures to words. One picture is worth a 1,000 words, takes less space, and is quicker to analyze.
• Too big. Most documents are written to impress rather than to educate and train. Blaise Pascal stated, “I have made this letter longer than usual because I lack the time to make it shorter.”
• Unusable and one-size-fits-all. Too often our procedures and descriptions are not designed with the customer and user in mind, making the material hard to use. Standardizing forms seems more important than making them easy to read.
• Poorly designed documentation. Principles such as grouping and consistency are often not followed. Good writing principles are often ignored.
• Mixed information types. Policies, procedures, processes, training, and standards are often mixed together, making the end product difficult to understand. Each of these document types needs to be used in a different scenario.
• Written sequentially. Process documentation is meant to be used nonlinearly. It is not a novel and needs to be written in a manner where each piece stands alone. This allows readers to find the information they need quickly.
• Information that can’t be found quickly. Documents that are hard to read are not used and often ignored.
• Dust-catching documents. Too many documents become dust catchers rather than useful documents. Having them online makes them easy to change and thus helps keep them up to date.
And keep in mind these guidelines for good documentation (Olson and Kelly, 2005):
• Tailor documentation and processes to the organization and each business unit.
• Write so the new person to the process will understand it; not just so the expert will understand it.
• Use chunking and sectionalizing to organize the document. Label the chunks so readers can quickly find what they are interested in.
• Use information mapping to quickly find specific parts of the document that the individual is interested in.
• Minimize abbreviations and acronyms.
• Do a process map that answers where, why, what, when, who, and how.
The Internet has sped up the distribution of information, but it has also caused a lot of needless information to be passed around. Too often we use distribution lists rather than selecting the individuals who need to read the information. This is very costly for people that don’t need or even want the information.
Streamlining allows you to right-size, not downsize.
—H. James Harrington
Nothing is more dangerous than an idea when it’s the only one you have.
— Emile Chartier
Often depending on the skills of the PIT, Activity 1 will be repeated one or two more times using different control parameters. For example, the first time, there are no restrictions on the team. The next time, the new design must be installed and operational within 90 days. The third time, the cost of installing the new process can’t be more than 25 percent of the cost of the first proposed new process. This frequently leads to a fourth new process design that includes the best features of the other three designs. All too often a team defines a solution and does not look for other solutions that may be better. The team members spend all their time justifying the process they designed. This approach makes the PIT look at other solutions with an open mind.
Too often we have an idea and hold on to it without searching for a better solution.
—H. James Harrington
Activity 2: Conduct a Benchmarking Study
In Activity 2 of Phase II, the PIT may have conducted a benchmarking study to ensure that the goals set by the PIT were realistic and stringent enough. If the team did, during this study sometimes organizations that are performing better than your own organization are identified. In these cases the PIT may want to perform a benchmarking study to understand the details related to the activities within the other organization’s process.
Benchmarking is a very popular tool that compares the present process with the best similar processes available in the world. It may or may not compare processes from the same industry. Benchmarking results in a reduction of cycle time, cost, and error rates between 10 and 60 percent. It takes between three and six months to develop a best-value future-state solution for the process that the PIT is working on to improve. For more details about benchmarking, read The Complete Benchmarking Workbook (Harrington, 1996) or High Performance Bench-marking (Harrington and Harrington, 1996).
Activity 3: Prepare an Improvement, Cost, and Risk Analysis
The PIT members have developed a new process that they believe is better than the old one. Now they need to analyze their solution to determine if the changes can be justified. This is a critical step and one that is often done poorly. Why? Because it is often hard to get the required information that the PIT needs and because a lot of the implementation costs are an estimate of the time required to do the job. To help in doing this job better, get purchasing to give you an estimate of the costs for the things you need to buy. Get your IT shop to estimate how much time it will need to set up the software and IT support. In other words, get the people who will need to install the change to estimate the costs of the change. Typically, for improvement you will compare the projected performance of the process with the present process for the following:
• Effectiveness
• Cycle time
• Processing time
• Cost
• Impact upon the customer
• Quality
In many cases you will set up a pilot run to collect the needed information. Be sure you use a control sample when you do design an experiment to collect the data.
That covers the benefits. Now you need to define the cost side. Typical costs are:
• The cost of the materials and consultants
• The length of time required to make the change
• The cost of training people
• The negative impact upon the output of the process during the cutover and learning cycle
• The cost of setting up the process layout
• Support department costs
SPI is a lot like the TV program Extreme Makeover; it takes an average person and transforms him or her into a raving beauty.
—H. James Harrington
Organizational change management of the new porcess becomes critical at this point. We first realized the problem people have in accepting a new process back in Phase I where we developed a change management plan. Now we have a chance to evaluate how effective these activities have been and to define how much the cultural change each individual solution will require. Hammer and Champy (2003) wrote in their book, Reengineering the Corporation, “Some 50 to 70% of the reengineering attempts fail to deliver the intended drastic results.”
One of the primary causes for this high failure rate is the lack of good organizational change management structure to support the change activities. During Phase II the PIT should have developed a culture model of the current process and its related environment. It should have been based upon the following cultural enablers:
• Management style
• Organizational structure
• Performance management
• Compensation benefits and rewards
• Education and development
• Behavioral models
• Environmental factors
The PIT will need to evaluate each of the solutions to define its impact on the present-state culture model developed in Phase II to determine:
• The risks related to the change
• The time required for it to be accepted
• The extent that the culture will have to change in order to meet the requirements of the change
Typical behavior changes that will need to be considered are:
• Trust in management
• Team orientation
• Communications
• Constraints
• Commitment
• Flexibility
• Respect
• Proactivity
• Responsibility
• Pride
The PIT will then compare the new culture model for each solution with the present-state model to define the gap between both (plus and minus). The greater the gap between the proposed change and the present process, the greater the risk of failure. This is not an easy job, and it is often done without proper analysis, leading to project failure. It is absolutely imperative that this risk analysis is done well and that an effective mitigation plan is prepared and executed.
Results of Different Future-State Solutions
Nothing is more dangerous than an idea when it is the only one you have.
—Emile Chartier
Table 5.14 is an example of a cost-benefit analysis. It shows the original performance and looks at the costs and benefits of two different solutions. Solution #1 had no restrictions on the future-state process, and Solution #2 required that all the changes needed to be functional within six months. Solution #1 seemed to be the best answer, saving over $10 million over a three-year time period. Solution #2 only saved $8.5 million. But when you consider that Solution #2 was up and running 12 months sooner than Solution #1 could have been implemented, it calculates out to be the correct solution, saving over $11.4 million.
When people are learning a new process, for a short time productivity drops off often below what it was on the old process. Productivity increases once the people involved in the new process have mastered it.
—H. James Harrington
Activity 4: Select a Preferred Process
The PIT should now schedule a meeting with the executive team to present its findings. If the PIT developed more than one recommendation, it should review each of them and explain why it selected the one it is recommending. Be sure to go over the change mitigation plans with the executive team in detail.
I like to meet with each of the executive team members first so that I know their concerns ahead of time, thereby assuring that I have addressed them during the presentation. I feel it makes this very important meeting run much smoother. It also often gets a number of people coming into the meeting already planning to support the change. I call these people “advocates.”
The outcome from this meeting should be an approval to develop a preliminary implementation plan and implementation detailed budget.
Activity 5: Prepare a Preliminary Implementation Plan
Very often the members of the PIT will not be the people required to implement the future-state solution. As a result, the PIT members will need to add implementation specialists to the PIT in order to come up with a budget that is fully supported by the people who will need to do the work. This often includes people from purchasing who will get the commitment from the suppliers, IT who will implement the software solution, industrial engineering staff who will need to install the change process, etc. People from HR are also included so that they can make an analysis that compares the skills of the people who are presently involved in the process with the skills that are required by the new process. This type of analysis is necessary to develop the training and staffing requirements for this new process. You will also need to identify the change agents who are required to support the cultural change model.
Table 5.14 Example of a Cost-Benefit Analysis
Implementation Analysis of Two Future-State Solutions
Solution #1: No limits on it
Solution #2: Must be installed within 6 months
Quantity per year = 10,000 units
Cost per defect = $35
Competitor’s price is $460 to $504
Number of employees is 120 @$32 per hour
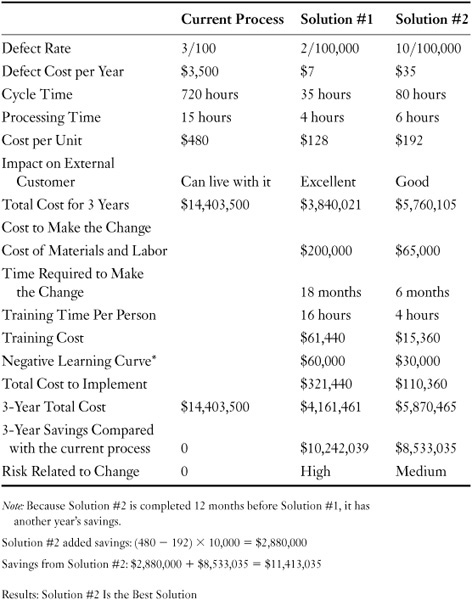
When the preliminary budget is ready and the suggested implementation team is defined, the plan is submitted to the executive team for its approval.
Activity 6: Conduct Phase III Tollgate
At the end of Phase III it is an excellent time to do a complete review of the Phase III deliverables. The tollgate should be chaired by the project sponsor, and the total EIT should be invited to attend. During this tollgate the following questions should be addressed:
• Has the PIT developed a future-state solution that is practical and in line with the goals set in the project plan?
• Did the PIT look at other options and present them?
• Is the estimated cost to implement the solution realistic?
• Is the ROI great enough to justify going ahead and installing the solution?
• Is the future-state solution in keeping with the organization’s culture and its long-range plan?
When these questions are answered in the affirmative, the project is ready to move into the implementation phase. You can’t exit Phase III without an approved Phase IV plan and budget plus an assigned implementation team.
Summary
We now have an approved future-state solution, but that is only the first half of the project. The real proof of how good a job the PIT has done in developing the future-state solution and the change management activities will be measured by how much resistance there is to implementing the new design and how well it works after it is implemented.
Don’t forget to reward the PIT if the members did a very good job at this point in the project.