CHAPTER
2
What Is Streamlined Process Improvement?
We have taken away the employee’s God-given right to do error-free work by not providing them with processes that are capable of error-free performance.
—H. James Harrington
Introduction
Upper management provides the vision and direction, teams correct the problems, and individuals provide the creativity, but it is the processes within any organization that get things done. No matter how good your management and your employees are, your organization cannot be successful if it is using the same business processes it used in the 1990s.
The question in everyone’s mind today is, To be more competitive, should the organization concentrate on continuous improvement or on breakthrough methodologies? In research and development, people argue whether to spend more of their R&D dollars on basic research or on applied research. The answer to both questions is that you must do both to survive.
Department improvement teams, natural work teams, task teams, self-managed work teams, Statistical Process Control, Quality Function Deployment, suggestion systems, etc., all have focused upon continuous improvement, and we do need continuous improvement. But some parts of our business need that “jump-start.” Many of the processes that we are using to manage the organization need to have their associated costs and cycle time cut by 50 percent within the next 12 months. When you need a major reduction in cycle time or cost and an improvement in output quality in a specific business process, a methodology called Business Process Improvement (BPI) is used. It is also sometimes called Business Process Management (BPM), and it combines methodologies like benchmarking, Streamlined Process Improvement (SPI), process reengineering, focused improvement, new process design, process innovation, activity-based costing, and new process specification into one logical way of initiating drastic, rapid change in a single business process. This book focuses on just one of these methodologies—SPI, which is sometimes called process redesign because about 80 percent of the BPI improvements are the result of this approach.
A two-year study of product organizations in Canada, Germany, and the United States asked the question, “What tools will be of primary importance in achieving future quality improvements?” A list of 10 choices was provided from which to select the most important. In Japan, Failure Mode and Effect Analysis was number 1, and BPI was number 2. In Germany, Pareto Analysis was number 1, and BPI was number 2. In the United States, Statistical Process Control was number 1, and BPI was number 2. Based upon these data, it is easy to see that in the coming years, BPI will be the most important approach used to improve organizations worldwide. Continuous improvement results in a 10 to 20 percent improvement in the total organization per year. BPI will give you a 30 to 90 percent reduction in cost, cycle time, and error rates in as short a time as six months for the single process to which it is applied. (See Figure 2.1.)
The primary difference between the BPI methodology and continuous improvement is that continuous improvement focuses on eliminating and preventing errors. Breakthrough improvement focuses on doing the right things right all the time. Let’s look at a good example: An older-model electronic organ used 163 parts to simulate the sound that a violinist makes when rocking his or her finger on the violin string. The unit did an excellent job. But when the unit was streamlined (redesigned), the same function was produced with only 51 parts at 40 percent of the cost, with increased reliability and equally good sound quality.
The following are typical examples of the improvements that have been realized when SPI methodology was used to improve processes:

Figure 2.1 Continuous versus breakthrough improvement applied to a process

At the General Dynamics–Convair Division in San Diego, California, SPI was used to identify cost reduction opportunities totaling $250 million (from a total budget of $1 billion) and a cycle time reduction equaling 30 percent of the entire product cycle time.
IBM, by focusing on entertainment expense reporting, treasury, and information management, was able to realize $178 million in annual cost savings (CFO, 1996).
What Are Business Processes?
If people are the heart of the organization, then processes are the brain. The organization’s processes define how activities are conducted and include both the production and support activities.
Based upon this definition, everything we do is a process. The alarm goes off in the morning, and that starts our getting-dressed process. The phone shatters the tranquility of our office, and our communication process gets started. Our spouse calls out, “Dinner’s on!” and that starts our nourishment process.
These examples are all very personal, but they make the point. In an organization, large processes involve many different functions and departments within functions existing and coexisting in order to manage the organization. The new product development process, for example, involves research and development, marketing, manufacturing, quality assurance, manufacturing engineering, sales, field services, production control, and other functions. The order entry process involves sales, scheduling, purchasing, production control, and information services. These are large cross-functional processes that determine how the organization functions. The success of the total organization depends largely upon how streamlined and responsive these processes are.
No matter how good your managers are, no matter how hard your employees try, if your critical business processes are outmoded and ineffective, all the stakeholders are going to lose. Unfortunately, too many managers feel that either they or their employees are the problem, when, in truth, it is the processes that are the problem. If anyone is at fault, it is management, because the managers have not recognized the crying need to improve the organization’s business processes and have not assigned the required resources to improve them.
Typical improvement realized when SPI methodology is applied to a business process ranges between 300 to 1,500 percent in as short as a six-month period. Because SPI yields such drastic improvement, it is often one of the tools applied during the first year of a three-year performance improvement plan. I have also seen organizations that have started with SPI when upper management could not unanimously agree on implementing the total improvement process or did not have the resources. It’s a wonderful methodology to save a few million dollars and free up some resources to help with the implementation of Total Improvement Management (TIM). (See Harrington, 1995, for more information on TIM.)
Compaq Computers provides a good example of the type of savings that can be realized by applying SPI-type approaches to a few critical business processes. Compaq focused on 10 sales, marketing, and logistic projects. As a result of the company’s process improvement activities, it identified in excess of $100 million in potential savings. In addition:
• There was a 50 percent reduction in elapsed time to respond to fluctuations in demand mix.
• There was a 50 percent reduction in carrying costs necessary to meet a target level of market responsiveness.
• The average lead time was reduced by 10 to 20 percent on selected commodities.
A business process is a series of logically related activities that utilize resources to provide specific results required to achieve a basic business objective. SPI makes use of the people involved in the process to measure, analyze, document, streamline, benchmark, and improve these business processes.
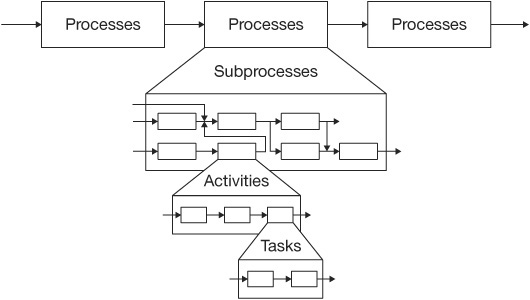
There is a hierarchy to our business processes. At the top there are the systems processes. Typically the entire organization can be divided into 6 to 10 system processes, which can then logically be divided into major processes. Major processes are work flow that is required to conduct a major business objective. Major processes can be divided into subprocesses. A sub-process is a logically related sequence of work flow that makes up portions of the major processes. Subprocesses can be further divided into activities. Activities take place within the process. They are usually performed by units of one (one person or one department). Activities can be divided into tasks, which are detailed steps to perform an individual activity. Most of the improvement comes as a result of changes at the activity level, although in some cases entire subprocesses are eliminated. (See Figure 2.2.)
Why Use SPI?
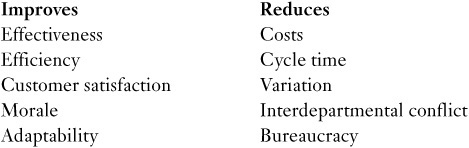
SPI is a systematic way of using interfunctional teams to analyze and improve the way the organization operates by improving the effectiveness, efficiency, and adaptability of the organization’s processes. What will SPI do for your organization?
Why change? The following is a list of typical reasons why processes are streamlined. They are streamlined to:
• Address the lack of system flexibility
• Lower costs
• Move decision making closer to the customer
• Streamline our ability to meet customer satisfaction
• Shorten return on investment cycle
• Increase market share
• Improve productivity
• Increase access to and control of information
• Minimize the number of contacts that customers have
• Make the customers feel that they are getting customized service
• Get a competitive advantage or edge
• Grow profits
• Increase return on assets
• Make it easy for customers to do business with us
• Make use of technology that is out there but that we aren’t yet using
• Keep up with our competition
• Improve employee morale
• Increase market share
• Minimize bureaucracy
• Meet customer delivery schedules
• Decrease backlog
• Introduce changes because the present process will not meet the strategic plan goals
• Reduce inventory
• Improve quality
The following are the kind of changes that occur when an organization streamlines its processes:
• Work units change—from functional departments to process teams
• Jobs change—from simple tasks to multidimensional work
• People’s roles change—from controlled to empowered
• Job preparation changes—from training to education
• Focus of performance measures and compensation shifts—from activity to results
• Advancement criteria change—from performance to ability
• Values change—from protective to productive
• Managers change—from supervisors to coaches
• Organizational structures change—from hierarchical to flat
• Executives change—from scorekeepers to leaders
Typical examples of improvement that have been realized using SPI are:
• Output quality improved by 100 percent
• Overhead cost reduced by 30 to 50 percent
• Cycle time reduced by 40 to 60 percent
• Lead times reduced from weeks to hours
• Number of ideas the employees generated increased by 100 percent and quality of the ideas improved by 50 percent
• Capacity increased by 40 to 60 percent
• Inventory reduced by 50 to 70 percent
How Management Has Been Misled
After using a continuous improvement strategy for 10 years, Alcoa Corporation’s CEO, Paul H. O’Mull, scrapped it, calling it a major mistake. He felt that Alcoa needed a quantum improvement to reach world-class standards.
All too often, management has compared these drastic breakthrough improvements to the 10 to 15 percent per year improvements that continuous improvement methodologies are realizing. Based upon this comparison, management has directed its efforts to the SPI methodology, expecting profits to increase 500 to 1,000 percent. Why, then, doesn’t the SPI methodology improve the bottom line as management expects? Why does a continuous improvement effort of 15 percent per year provide better results than the SPI methodology? The answers lie in understanding the difference between the impact that breakthrough improvement and continuous improvement have on your bottom line.
Breakthrough versus Continuous Improvement
If you are not improving, you are not holding still; instead, you are slipping backward at a rate of about 5 to 10 percent per year compared with what your competitors are doing, because they are improving (see Figure 2.3). For the sake of discussion, let’s assume that a typical organization has conservatively 500 business processes going on within the organization. Experience has proved that you should not attack all these business processes at the same time, because applying SPI to even one process has a major impact on and causes disruption in the entire organization. Applying SPI to more than three processes at the same time tends to make the organization go out of control. IBM tried applying SPI to 78 of its critical business processes at one time at its site in San Jose, California, and soon learned that it was having difficulty assimilating the changes because so many things were changing at once.
Let’s assume that an organization works with 3 processes per year out of the 500 processes, and each of the 3 processes improves 1,000 percent. This would improve the total organization’s performance by only 6 percent [(3/500) × 1,000% = 6%].

Figure 2.3 Comparative performance change with continuous and breakthrough improvement
Now consider that the other 497 processes degrade 5 percent over the year because they are not improving. The net result is only a 1 percent improvement (see Figure 2.3).
Let’s compare these results with those obtained using a continuous improvement methodology applied to all 500 processes at a rate of 10 percent per year improvement (see Figure 2.3). You can see that the continuous improvement methodology results in a 9 percent per year advantage over the SPI methodology and a 15 percent advantage over competitors if they are not using continuous improvement or breakthrough methodologies. This advantage is achieved because the total workforce is working to improve all the business processes and the production processes.
When breakthrough improvement and continuous improvement are combined, the result is a 60 percent improvement per year over continuous improvement alone. It is for this reason that both continuous and breakthrough improvement must be used by organizations that truly want to be the very best.
The following table shows the difference in the ways an organization approaches continuous and breakthrough improvement.

What SPI Is Not
SPI is not an experimental, theoretical model. It has been successfully implemented in companies such as Corning, Boeing, IBM, LTV, Nutrasweet, Florida Power & Light, and Compaq; it has been used in large companies like Ford and in small companies like AccuRate, which had only 85 employees. I have been using it for over 25 years. Early work started on the SPI methodology within IBM during 1982. Since that time, it has developed into a proven, exact methodology refined through years of experience under different organizational environments. During its evolution, parts of the methodology have been known by many names, including process redesign, focused improvement, process innovation, and process streamlining.
Why Improve Your Business Processes?
Our business processes were created to fulfill a specific need, but from that point on, most of them were neglected. They were not updated, not reviewed, not refined, not audited, and they did not keep pace with the changing business needs. When the process failed, management quickly intervened and put in a quick fix. Soon our business processes looked like patchwork quilts.
Over the years our business environment has changed, becoming more and more complex, but our business processes have not kept pace. In fact, they have changed very little. In the 1980s we could afford to make a major business blunder, come out with products six months late, and still have a profitable organization. Today, a six-month slip in a new product will cause a company to completely miss the product window. The acceptable margin for error that was built into our business processes has now disappeared.
In our manufacturing processes we expect our employees to produce output at the parts-per-million level, but in our business processes, we accept a 20 percent error rate as acceptable, and often even consider this as outstanding performance. Over 30 percent of the people who request information by telephone from the IRS receive faulty information. The vice president of Saab’s Research and Development Group reported that the group’s poor-quality cost was running at 78 percent of the total R&D budget. Approximately 55 percent of the finance department’s budget is poor-quality cost. In manufacturing the scrap goes out in scrap barrels. In the white-collar areas it goes out in the waste basket. Boeing, to impress upon its white-collar workers the importance of doing the right thing right every time, brought together all of its employees in a large hangar. Suddenly the hangar doors opened and truck after truck backed in and dumped piles and piles of paper on the floor. Soon the employees were standing knee-deep in paper. When the caravan of trucks stopped, management appeared on the balcony pointing out to the employees that this was the white-collar scrap for last week for which they were responsible.
How to Improve Your Business Processes
The complexity of our business environment and the many organizations involved in the critical business processes make it necessary to develop a very formal approach to SPI. This methodology is called PASIC, and it is conveniently divided into five subprocesses (phases) that consist of a total of 31 different activities. (See Figure 2.4.)
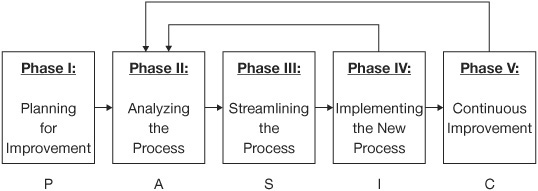
Figure 2.4 The five phases of the SPI methodology
Phase I: Planning for Improvement (eight activities)
Phase II: Analyzing the Process (eight activities)
Phase III: Streamlining the Process. Refining the process (six activities)
Phase IV: Implementing the New Process. Installing the new process (six activities)
Phase V: Continuous Improvement. Making small-step improvements (three activities)
In a personal letter dated July 14, 1990, Dr. W. Edwards Deming, one of the world’s leading quality consultants, wrote, “I teach optimization of a system and the aim of the system. I do not associate my name with Total Quality, because I have no idea what people mean by these words.”
Phase I: Planning for Improvement
During Phase I the EIT is trained on the SPI methodology, selects the critical processes, and assigns process owners. The process owners organize a PIT that sets process boundaries, establishes total process measurements, identifies process improvement objectives, and develops a project plan. There are eight activities in this phase (also see Figure 2.5):
• Activity 1: Define Critical Business Processes
• Activity 2: Select Process Owners

Figure 2.5 Activities in Phase I: Planning for Improvement
• Activity 3: Define Preliminary Boundaries
• Activity 4: Form and Train the PIT
• Activity 5: Box in the Process
• Activity 6: Establish Measurements and Goals
• Activity 7: Develop Project and Change Management Plans
• Activity 8: Conduct Phase I Tollgate
Phase II: Analyzing the Process
Unfortunately, most business processes are not documented, and often when they are documented, the processes are not followed. During this phase the PIT will draw a picture of the present process (“as-is” process), analyze compliance to present procedures, collect cost and cycle time data, and align the day-to-day activities with the procedures. The eight activities in this phase (also shown in Figure 2.6) are:
• Activity 1: Flowchart the Process
• Activity 2: Conduct a Benchmark Study
• Activity 3: Conduct a Process Walk-Through
• Activity 4: Perform a Process Cost, Cycle Time, and Output Analysis
• Activity 5: Prepare the Simulation Model
• Activity 6: Implement Quick Fixes
• Activity 7: Develop a Current Culture Model
• Activity 8: Conduct Phase II Tollgate
The purpose of Phase II is for the PIT to gain detailed knowledge of the process and its matrixes (cost, cycle time, processing time, error rates, etc.). The flowchart and simulation model of the present process (the as-is model of the process) will be used to improve the process during Phase III.
Phase III: Streamlining the Process
Don’t streamline the process to get rid of people—use it to improve the process. The streamlining phase of SPI is the most critical and the most fun. It is during this phase of the SPI methodology that the creative juices of the PIT members are really put into action. The streamlining phase consists of the following six activities (see also Figure 2.7):
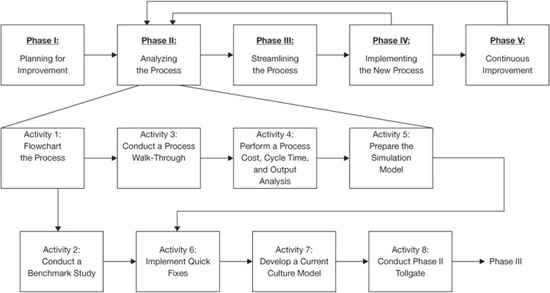
Figure 2.6 Activities in Phase II: Analyzing the Process
• Activity 1: Apply Streamlining Approaches
• Activity 2: Conduct a Benchmarking Study
• Activity 3: Prepare an Improvement, Cost, and Risk Analysis
• Activity 4. Select a Preferred Process
• Activity 5: Prepare a Preliminary Implementation Plan
• Activity 6: Conduct Phase III Tollgate
Apply the Streamlining Approaches
A streamlining approach takes the present process and removes waste while reducing the cycle time and improving the process effectiveness. After the process flow is streamlined, automation and information technology (IT) are applied, maximizing the process’s ability to improve its effectiveness, efficiency, and adaptability. SPI is sometimes called focused improvement or process redesign since it focuses its efforts on the present process. It results in decreasing cycle time, cost, and error rates between 30 and 60 percent. It takes about 80 to 100 days to develop the best-value future-state process. This is the correct approach for 70 to 80 percent of an organization’s critical business processes.
Best-Value Future-State Solution
All too often, a PIT only develops one new process design. This can be a costly conservation of time. All processes do not have to be world class unless they drive the core capabilities and competencies of the organization. For example, the hiring process at Hewlett Packard (HP) can be 10 to 20 times longer than it is at Manpower without impacting Hewlett Packard’s performance. Even if Hewlett Packard could reduce its hiring process cycle time to one day from its present cycle time, the improvement would have no measurable impact on HP’s bottom line.
Organizations today should be selecting the new process that provides them with their best-value future-state solution (BVFSS), which may or may not represent today’s best practices. When the PIT develops one solution, the team members try to minimize efficiency and effectiveness while maximizing adaptability. They present one answer with no options to the management team. Typically, they define the single new process and then develop estimates and data to prove that their solution is correct and that there is an attractive return on investment (ROI). This usually does not result in a BVFSS. To identify the BVFSS, the PIT must consider the interactions among efficiency, effectiveness, and adaptability. In addition, the PIT must consider implementation cost, implementation cycle time, potential risk, and the solution’s impact on the organization’s culture. The best way to define BVFSS is to develop one solution and then go back and develop two or more different solutions.

Figure 2.7 Activities for Phase III: Streamlining the Process
There are many different ways to develop alternative solutions. One approach would be to define different solution objectives for each alternative future-state solution. For example:
• Solution #1. Define the process that will give the best combination of efficiency, effectiveness, and adaptability measurements, ignoring the implementation cost and implementation cycle time.
• Solution #2. Define the process that will generate the best combination of efficiency, effectiveness, and adaptability that can be implemented within a 90-day period.
• Solution #3. Define the process that will deliver the best combination of efficiency, effectiveness, and adaptability that can be implemented at a cost of less than $100,000 and has minimum risks related to meeting the efficiency, effectiveness, and adaptability projections.
• Solution #4. Define the process that will improve output quality the most without increasing processing costs and that can be implemented within a six-month period.
It is easy to see that as different solution objectives are set for each of the process designs, future-state solutions will vary greatly. Often, generating alternative future-state solutions will generate new ideas that will alter previously developed future-state solutions.
Each time a future-state solution is developed, a simulation model should be created so that the new process design can be exercised and evaluated. Table 2.1 is a simple performance analysis database for three alternative future-state solutions designed for the same process.
By studying Table 2.1, it is easy to see that all the future-state solutions perform better than the original process. Future-State Solution #1 represents best practices, but it is very costly and has a long implementation cycle. It also has a high risk associated with it because the information systems department does not want to transfer its operations over to a new computer system.
Table 2.1 Comparison of Three Future-State Solutions

Future-State Solution #2 can be implemented very quickly and inexpensively, but its performance is worse than the other two future-state solutions. Future-State Solution #3 provides a middle-range option.
The selection of the BVFSS will vary from organization to organization and will depend on the stability of the process enablers that are used in the future-state solutions. For example, if the customer effectiveness requirement is .05, probably Solution #2 would be dropped from consideration. Another factor to consider would be the number of items that go through the process, as this affects the total cost of operating the process. If information technology is an important part of the future-state solution, implementation cycles become a very important factor because IT solutions that take more than 12 months to implement often are obsolete before they are implemented. Frequently, the savings related to quick implementation far outweigh the savings related to better performance of the future-state solution.
For example, suppose the process in Table 2.1 is obsolete five years after the future-state solution is defined. Using this as an assumption, our savings will be based on a five-year cycle. Table 2.2 defines the total cost of implementing the present system over a five-year period compared with the three future-state solutions. The calculations are based on processing 100 units per month through the process.
By analyzing the data in Table 2.2, we see that Future-State Solution #1 (FSS #1) should not be implemented even if it is best practices if the only consideration is cost, because it has a negative impact on the bottom line. Frequently, the results of reengineering and benchmarking projects are unsatisfactory when this type of analysis is not conducted. It is very easy for the PIT and management to get excited about the future-state solution projected performance improvement and charge ahead without realizing what impact the future-state solution has on the bottom line.
Table 2.2 Five-Year Analysis of FSS Process Cost for the Original Process and Three Different Future-State Solutions
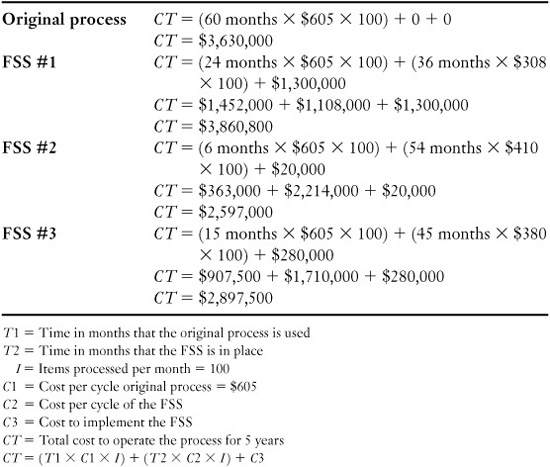
The ROI for FSS #2 is 207 to 1 compared with FSS #3, whose ROI is 2.6 to 1. In this case, if cost is the only consideration, FSS #2 is the BVFSS. Unfortunately, efficiency is only one of the three parameters that need to be considered to define the BVFSS. In addition, the PIT must also consider effectiveness and adaptability. This makes the analysis more than three times more complicated than the example presented. More information on BVFSS can be found in The Complete Benchmarking Implementation Guide (Harrington, 1996).
Phase IV: Implementing the New Process
During this phase, an implementation team is pulled together to install the selected process, measurement systems, and control systems. The new in-process measurement and control systems will be designed to ensure that there is immediate feedback to the employees, enabling them to contain the gains that have been made and to improve the process further. This phase consists of six activities (see also Figure 2.8):
• Activity 1: Prepare a Final Implementation Plan
• Activity 2: Implement New Process
• Activity 3: Install In-Process Measurement Systems
• Activity 4: Install Feedback Data Systems
• Activity 5: Transfer Project
• Activity 6: Conduct the Phase IV Tollgate
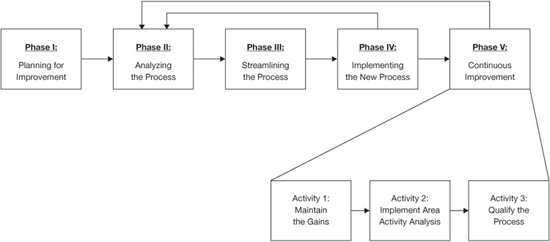
Phase V: Continuous Improvement
Now that the process has undergone a major breakthrough in performance, you cannot stop improving. This is not the end of the improvement activities; it is just the beginning. Now the process must continue to improve, usually at a much slower rate (5 to 15 percent per year), but it must continue to improve. During this portion of the cycle, the process owner will continue to monitor the effectiveness, efficiency, and adaptability of the total process. Department improvement teams (natural work groups) in each area will continually work on improving their portion of the process by setting their own personal improvement objectives. This is an acceptable approach because the process owner continues to monitor total performance to ensure that suboptimization does not occur. This phase consists of three activities (also see Figure 2.9):
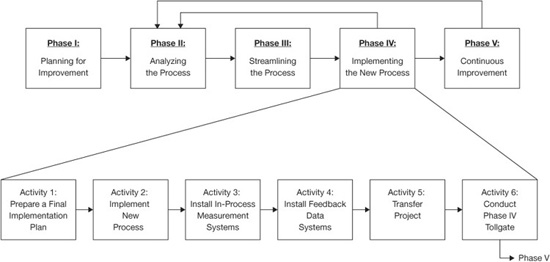
Figure 2.8 Activities for Phase IV: Implementing the New Process
• Activity 1: Maintain the Gains
• Activity 2: Implement Area Activity Analysis
• Activity 3: Qualify the Process
Summary
SPI is the most effective way to bring about meaningful and positive changes to your major processes. It will set the stage for a culture change that questions the status quo and looks for that better way to do everything. SPI is designed to upgrade your major processes. It is much more effective at improving processes than methodologies like Six Sigma or Plan-Do-Check-Act, which are designed for problem solving.
You need to be better today than you were yesterday and be much better tomorrow than you are today.
—H. James Harrington