
Chapter 11 Using Record Selections and Alerts for Interactive Reporting
Creating Advanced Record Selection Formulas 266
Adding Alerting to Your Reports 273
Performance Monitoring and Tuning 276
Crystal Reports in the Real World—Web Report Alert Viewing 282
Introduction
Not all information is fit for all users, so this chapter discusses how record selection can used to limit the data in a report. Hand-in-hand with limiting the data (reducing the recordset also improves speed and performance) is a review of tuning the report. Even when a report is published to BusinessObjects Enterprise (introduced in many chapters later) and much time is invested in correctly architecting and tuning the servers, the number one performance improvement is often in correct report authoring.
Creating Advanced Record Selection Formulas
Although creating a simple report can be very useful for an end user, highlighting notable information can increase the utility of the report because it saves time spent looking for trends and crucial data. Outliers, data that falls above or below the average of a specified threshold, often contain key information.
This chapter focuses on drawing attention to key data by using record selections and introducing SQL expressions, and introduces report alerting.
Although many filters are simple enough to be defined using the Select Expert, most real-world reports require editing the record selection formula itself. Before covering the best practices for creating formulas, review the material on record selections introduced in Chapter 2, “Selecting and Grouping Data.”
Record Selection Review
Record selections, or filters, are defined by a record selection formula built using the Crystal syntax of the Crystal Reports formula language. You can build a record selection formula using the Formula Editor by opening the Report menu and choosing Selection Formulas, Record. A simpler way to build record selections is to use the Select Expert icon accessed via the Experts toolbar.
A record selection formula returns a Boolean value indicating whether a given record should be included in the report. It is evaluated for each record in the database. Any time a database field is used in the formula, it is replaced by the actual field value.
After this quick review, the following sections move on to some of the more important topics in creating record selection filters.
Displaying Record Selections
Although the techniques discussed in this chapter allow powerful filtering, this should not be applied without the end user’s knowledge in most cases (certainly there are cases where end users should not know of hidden data, but this more often is handled via filters to secure the data in a Business View). In these cases, you can simply display the current selection filter or other special fields by either dragging the fields onto the report from the Field Explorer, Special Fields area, or by using the same fields in a formula to change the way these fields display as in the previous chapter.
Dealing with Dates
Use the select expert, which you access by choosing Report, Select Expert, to manipulate dates with the addition of four specific date-related comparators:
- Is between—The selected items fall between these two dates.
- Is not between—The selected items do not fall between these two dates.
- Is in the period—The selected items fall in the periods selected from the drop-down list.
- Is not in the period—The selected items do not fall in the periods selected from the drop-down list.
These date-specific operators appear when you have selected a field of date type, and prompt for the specific values. However, in more complicated situations, you are forced to create a formula in the formula editor rather than using the select expert to create the formula for you.
One of the most common record selection formulas is {field} = value, where {field} is a database field and value is a corresponding value of the same data type. An example of this would be
#Customer Country} = "Canada"
This kind of formula is very easy to create, but becomes more complicated when the data types of the values to be compared are not the same. Filtering data based on dates often causes this type of situation; for instance, this formula:
{Orders.Order Date} > "2/25/2000"
When clicking the Check button to check the formula’s syntax, Crystal Reports provides a message saying "A date-time is required here" and after closing the message box, "1/29/1998" is highlighted. Because the Order Date field has a data type of date-time, the formula attempts to compare a date-time to a string, which is not allowed. Comparisons must always be performed on objects of the same data type. To rectify this, instead of using a string literal to describe a date, the formula could use the DateTime function to return a date-time value. Here is an example of the corrected formula:
{Orders Order Date} > DateTime(2000, 2, 25, 0, 0, 0)
Notice that when the DateTime function is used, it takes arguments for not only year, month, and day, but also for hour, minute, and second. This is because in order to compare this value to the Order Date field, it needs to be a date-time value. In this case, you might not care about the time part of the date-time value. The best way to solve this would be to first convert the Order Date field into a date from a date-time, and then use the Date function instead of DateTime. The improved formula follows:
Date({Orders.Order Date}) > Date(2000, 2, 25)
To make this even simpler, the Crystal Reports formula language also supports dates specified in the following format:
=YYYY/MM/DD HH:MM AM/PM#
Using this syntax, the following formula is also valid:
{Orders.Order Date} #62; #2000/2/25 12:00 AM#
Another nice feature of this syntax is the capability to omit the time portion. When this is done, a default of 12:00 AM is used.
Various functions are available for converting between strings, dates, and date-times. These can be found in the Function Tree window of the Formula Editor, under the Date and Time folder.
Another issue that comes up often is filtering on a field in the database that contains dates but is defined as a string field. The following fictitious formula, although it will not return any errors when checking the syntax, does not accomplish what you might expect:
{Shipments.Ship Date} > "1/1/2001"
This will not perform a date comparison because both fields are of type string. To correct this formula, you could use one of the functions provided by the DTS (date time string) user function library called DTSToDate.
A user function library is a library of functions that can be used from the Crystal Reports formula language. Business Objects provides several of these with the product, and others are available from third-party vendors. If you are proficient with Visual Basic or C++, you could even create a user function library yourself. The user function library can be found under the Additional Functions folder in the Function Tree of the Formula Editor.
The DTSToDate function takes a string that is in the proper date format and converts it to a date value. The correct formula is shown here:
DTSToDate({Shipments.Ship Date}) > Date(2001, 1, 1)
where the Ship Date field contains a date in DD/MM/YYYY format.
Working with Strings
As with dates, simple string comparisons are easy to achieve using the record selection expert. Slightly more complex comparisons can easily become tedious unless you are armed with knowledge for effectively dealing with strings. A simple example is a listing of customer data for a set of countries. Creating a record selection formula like the following can become quite tedious:
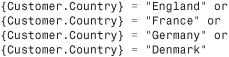
Rather than using multiple comparisons, this can be accomplished with a single comparison using a string array.
An array in the context of the Crystal Reports formula language is a collection of values that can be referenced as a single object.
The previous record selection formula can be rewritten to look like this:
{Customer.Country} in ["England", "France", "Germany", "Denmark"]
Notice that there are several differences. First, instead of using multiple comparisons, only a single comparison is used. This is both simpler to read and easier to maintain. The four country values are combined into a string array. Arrays are indicated by square brackets with values separated by commas. Finally, instead of an = operator, the in operator is used. This operator, as its name implies, is used to determine if the value on its left is present inside the array on its right.
Although string arrays are described here, arrays can be made holding other data types, such as integers and currency values.
In this example, the countries are hard-coded into the selection formula. Although this makes it easy to read, the report would need to be modified if the country list were to ever change. A better way to handle this would be to create a multiple value prompt and use it in place of the country list. If you did that, the formula would look like this:
{Customer.Country} in {?CountriesParam}
During the parameter prompting, the user will be allowed to enter multiple values, and you can even provide a list of default values from which to choose.
Pushing Record Selections to the Database
When dealing with large sets of records, performance becomes important. The record selection used makes a significant difference in report performance. Crystal Reports does have the capability to perform database-like operations on the data such as grouping, filtering, summarizing, and sorting. However, in general, asking the database to perform those operations results in a faster overall transaction. Because of this principle, Crystal Reports attempts to ask the database to perform these operations if possible.
In the context of record selections, when Crystal Reports queries the database it attempts to incorporate as much of the logic of the record selection formula as possible into the query. Ideally, all the logic can be incorporated into the query, which means that the database will perform all the filtering and only return the records that meet the criteria. However, because the SQL language doesn’t support all the Crystal Reports formula language, there could be certain situations in which some or all the logic of the record selection formula cannot be converted to SQL. In this case, Crystal Reports needs to pull some or all the records from the database and perform filtering itself.
When working with a desktop database like Access or FoxPro, the performance difference between the database engine or the Crystal Reports engine doing the filtering would be minimal because it really comes down to which filtering algorithm is faster. Because databases are made for just this purpose and are customized for their own data structures, they will generally perform this kind of operation faster. However, when dealing with client/server databases in which the database resides on a back-end server and Crystal Reports resides in your desktop machine, the difference becomes much more apparent. This is partly because of network traffic. There’s a big difference between sending 50 records back over the network and sending 100,000. This performance hit becomes even worse when using a slow connection such as a dial-up modem.
To determine whether the logic you’ve used in the record selection formula or select expert is incorporated into the query sent to the database, it’s helpful to have a basic understanding of the SQL language. You need not be an expert at SQL, but being able to recognize if the query is performing a filter on a certain field makes record selection formula tuning much more effective.
Although there are some guidelines for creating record selection formulas that will be fully passed down to the server, often the best approach is to simply check the SQL statement manually and determine whether the record selection logic is present. To view the SQL statement that Crystal Reports has generated, select Show SQL Query from the Database menu. The resulting dialog is shown in Figure 11.1.
Figure 11.1. The Show SQL Query dialog displays the actual SQL code used to retrieve the results from the relational database.
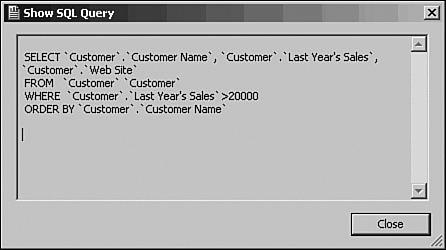
You can infer from the preceding SQL query that this report is based on the Customer table, is using the Customer Name, Web Site, and Last Year’s Sales fields, and has a record selection of
{Customer.Last Year's Sales} > $20000
All the logic of the record selection formula has now been passed down to the database in the SQL query. However, if this report had a formula field that calculated the tax, that formula might consist of the following:
{Customer.Last Year's Sales} * 1.07
This formula field might be placed on the report to indicate the tax for each customer. A problem occurs when this formula is used in the record selection formula. Although the following formula seems logical, it is inefficient:
{@Tax} >j$10000
If you were to look at the SQL query being generated for this report, you would see that there is no WHERE clause present. In other words, the report is asking the database for all the records and doing the filtering locally, which, depending on the size of the database, could result in poor performance. A better record selection to use—which would produce the same results, but performs the filtering on the database server—would be
{Customer.Last Year's Sales} > $142857
This works out because at a tax rate of 7%, $142,857 is the minimum a customer would need to sell to have tax of more than $10,000. Using the previous record selection would result in a SQL query with the following WHERE clause:
WHERE 'Customer'.'Last Year's Sales' > 142857
Although this approach returns the correct data, a slightly less cryptic approach would be to use a SQL Expression.
An Introduction to SQL Expressions
Crystal Reports formulas are useful because they enable you to use the full Crystal Reports formula language as well as a suite of built-in functions. However, as you’ve learned in this chapter, they can be a factor in report processing performance. SQL expressions provide an alternative to this.
A SQL Expression, as the name implies, is an expression written in the SQL language. Instead of consisting of a whole formula, a SQL Expression consists of an expression that defines a single field just like a formula field does. The difference between a formula field and a SQL Expression is based on where it is evaluated. Formula fields are evaluated locally by Crystal Reports, whereas SQL Expressions are evaluated by the database server and thus produce better performance when used in a record selection formula.
To better understand this, look at the example discussed in the previous section. The example had a report with a Crystal Reports formula that calculated tax based on the Last Year’s Sales field. Although there certainly are situations in which formula fields need to be used, this is not one of them because the logic being used in the formula is simple enough that the database server is able to perform it. Instead of creating a formula field, a SQL Expression could have been created. SQL Expressions are created via the Field Explorer, which was introduced in Chapter 4, “Understanding and Implementing Formulas.” Right-clicking on the SQL Expressions item and selecting New will begin the process of creating a SQL Expression. When choosing to create a new SQL Expression, the SQL Expression Editor is launched (see Figure 11.2).
Figure 11.2. The SQL Expression Editor.
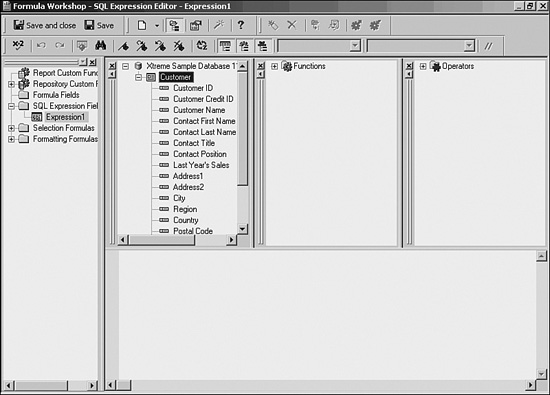
This editor is, in fact, the same editor used to create Crystal Reports formulas, but with a few small changes. First you’ll notice that in the field tree, only database fields are present to be used in the expression. Because SQL Expressions are evaluated on the database servers, Crystal Reports constructs, such as prompt fields and formula fields, do not exist and thus cannot be used in the expression.
To create a SQL Expression that calculates the tax, the following expression can be used:
'Customer'.'Last Year's Sales' * 0.07
Notice that instead of using the {Table.Field} syntax for fields, the 'Table'.'Field' syntax is used. This is because the quoted syntax is how you define fields in the SQL language.
When inserting this SQL Expression into the report and checking the SQL query, you will find Crystal Reports has generated SQL similar to this:
![]()
The SQL Expression that was defined in the report is inserted into the main SQL statement that Crystal Reports generates. This means that you can use any database-specific syntax or function inside a SQL Expression.
Getting back to the topic of performance, you’ll remember that using the tax calculation formula field in the record selection formula resulted in all the records being returned and Crystal Reports having to locally perform the filtering. Fortunately, any SQL Expressions used in the record selection are always passed down to the database server. Therefore, a better record selection for filtering out customers who pay less than $10,000 in tax would be the following:
{%Tax} > 10000
In this record selection formula, {%Tax} is the SQL Expression discussed previously. This record selection formula would result in Crystal Reports generating the following SQL query:
![]()
Remember that any formula evaluated after the first pass of the multipass system, for instance grouping criteria or information to prompt a subreport, can cause slow report processing. Again a SQL Expression can retrieve the correct data in the first place, speeding report processing significantly. The next chapter of this book covers the multipass system in detail.
Adding Alerting to Your Reports
Although calling out outlying values can be accomplished by using conditional formatting, the alerting feature inside Crystal Reports allows for more interactive identification of key data as well as pushing of those alerts to end users via BusinessObjects Enterprise’s alerting functionality.
A report alert is a custom notification created within Crystal Reports, triggered when a predetermined condition is met. An alert is comprised of three integral parts:
- Name
- Trigger (condition or threshold)
- Message
Alerts serve the dual functions of bringing end-user attention to a certain condition being met and focusing end-user attention on specifically relevant data in a report—thereby increasing user efficiency. Some examples of reports in which alerts could provide a benefit are outlined in Table 11.1.
Table 11.1. Reports with Potentially Useful Alerts
Report alerts are triggered when the report is processed and the associated condition has been met. When this condition is true, the alert message will be displayed. Figure 11.3 displays a triggered alert from within the Crystal Reports Designer.
Figure 11.3. A report alert being triggered.

Creating, Editing, and Using Alerts
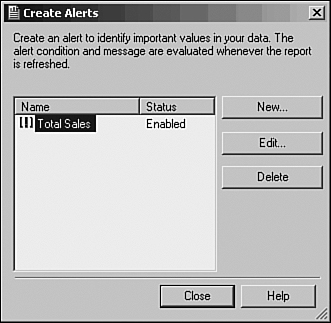
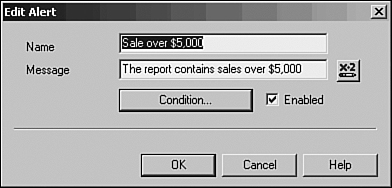
To create or edit alerts in Crystal Reports, select the Report, Alerts, Create or Modify Alerts menu items. This dialog (shown in Figure 11.4) enables you to create a new alert, edit existing alerts, and remove existing alerts.
Figure 11.4. Clicking Edit on the Create Alerts dialog opens the Edit Alert dialog.
To create the alert, follow these steps:
- Give the alert a name. This name should be meaningful and will be displayed to the user when the alert is triggered.
- Specify a condition for which to trigger the alert. An example of this would be
{Customer.Last Year's Sales} < $10000. The condition is simply a formula using either Crystal or Basic syntax that evaluates to a true or false result. True means the alert should be triggered; false means that it should not.
- Give the alert a message to display when it has been triggered. This can be a hard-coded string, or can be a formula such as
"Sales are over $" + ToText({Customer.Last Year's Sales})
To see your alert in action, refresh the report with data that meets your alert condition, and triggered alerts will be displayed.
Finally, not only are you notified that the alerts have been triggered, you can click the View Records button on the Report Alerts pop-up dialog to filter the report to show only those records that triggered the alert. This is a good way to draw attention to the key outliers in the data.
Using Alerts in BusinessObjects Enterprise
The Report Alerts dialog displayed in Figure 11.3 is only available from within the Crystal Reports Designer. If you are delivering your reports via another mechanism such as the Web, alerts are handled differently. To have your end users take advantage of Crystal Reports alerting, you will need to either use BusinessObjects Enterprise for report distribution or exploit the built-in alert functions (IsAlertEnabled(), IsAlertTriggered(), and AlertMessage()) within formulas you create in your report.
![]() For more information on BusinessObjects Enterprise, see Chapter 25, “BusinessObjects Enterprise Architecture,” p. 595.
For more information on BusinessObjects Enterprise, see Chapter 25, “BusinessObjects Enterprise Architecture,” p. 595.
Typically, alerts can be shown to end users in a portal, which then links back to the report.
End users viewing a report from an alert in BusinessObjects Enterprise do not see the items matching the alert conditions—they see the entire report. This leads to some discontinuity both from the Crystal Reports experience and also from the end users’ expectation that they should now see values called out in the alert.
To make this more logical for the end user, create a version of the same report (perhaps use a naming convention like ALERT_reportname.rpt) with the alert and also a filtering condition matching the alert condition. Thus, when end users click on an alert in BusinessObjects Enterprise, they will see a version of the report containing only the relevant values.
Performance Monitoring and Tuning
As reports grow in data size and complexity, ensuring optimal performance becomes increasingly important. This section serves as both a reminder of some performance tips already covered in the book to this point and as an introduction to some other tools and methods provided by Crystal Reports to optimize report performance in demanding environments.
Group By On Server
This Crystal Reports option enables you to push down the Grouping and Sorting activities to the database server. By performing these functions on the database instead of the Crystal server, less data is passed back to the Crystal Report and report-processing time is decreased. This option can be set locally under the Database main menu when the given report is being edited, or set globally on the Database tab of the Options menu accessed under the File main menu.
Some restrictions apply to the use of this option, including the following:
- The data source must be a standard SQL database.
- The report must have groups within it and the groups must be based on database fields—not formula fields.
- The groups cannot contain specified order sorting.
- The details section of the report must be hidden.
- Running Totals must be based on summary fields (that is, they do not rely on detail records for their calculations).
- The report cannot contain Average or Distinct Count summaries, or use Top N values.
When this option is applicable and used, the involved reports will perform faster. In addition, the detail level on these reports is still accessible through the standard drill-down functionality and will make dynamic connections to the database to bring back any user-requested detailed information.
SQL Expressions in Record Selections
As referenced and discussed previously in the book, SQL expressions are SQL statements that provide access to advanced database aggregations and functions. Using SQL expressions wherever possible in record selections and formula creation (versus using Crystal or Basic syntax) optimizes the amount of work that will get processed by the database server (versus the Crystal server)—and this will increase your report’s performance.
Some quick examples of SQL expressions that can be used in place of Crystal formula syntax:
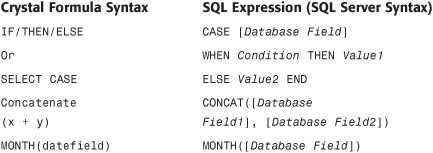
You should investigate the SQL capabilities of the report’s database thoroughly when report performance and optimization becomes a critical business issue. Mature databases like Oracle, DB2, SQL Server, and so on have mature SQL capabilities that can often be leveraged in lieu of the Crystal formula language in field selection and record selection. Using SQL expressions can dramatically increase report performance in many instances.
Use Indexes on Server for Speed
This is another performance option that is set under the Database tab of the Options dialog accessed from the main File menu. This option ensures that the involved Crystal Report uses any indexes that are present for the selected database and for the given report.
On-Demand or Reduced Number of Subreports
As discussed in the chapter on subreports, these objects are reports unto themselves and maintain their own database connections and queries. As you can imagine, if too many subreports are added to a main report, this can lead to runaway report-processing times. A typical scenario where this might happen is when you want to include the data inside a subreport for every group within the main report. In a large report with hundreds or even thousands of groups, this can lead to that subreport running thousands of times—a palpable performance hit even when the subreport is small and/or optimized.
To minimize this challenge, it is a good idea to ensure that in-place subreports (as opposed to on-demand subreports) are used judiciously and that they are indeed required in performance-sensitive reports. Often times, only a very small subset of the subreports are ever viewed by a user and an acceptable user experience can be provided with On-Demand subreports instead.
Performance Monitor
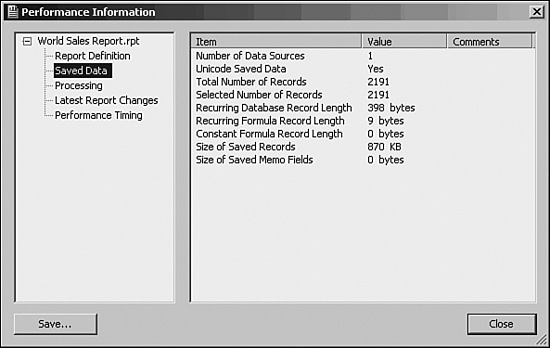
After a report has been functionally designed, Crystal Reports provides the Performance Information tool to facilitate performance testing. This tool provides information that helps in optimizing the current report for fastest performance. The Performance Information dialog shown in Figure 11.5 is accessed from the main Report menu.
Figure 11.5. The Performance Information window provides detailed report performance metrics.
The left side of the Performance window provides a tree structure that facilitates navigation among the different report metrics areas maintained by this tool:
- Report Definition—This node provides information about the content of the report: the number of fields, the number of summaries, UFLs (User Function Libraries), Chart objects, and so on. Each of these objects will have some impact on the performance of the report dependent on their quantity and complexity. The Page N of M Used option is relevant because it specifies whether a third pass of the data is needed when processing this report. If not required, this can be eliminated by removing any Page N of M special fields on the report.
- Saved Data—This node provides information about the data captured in the involved report: the number of data sources used, the total number of records, recurring database record length, size of saved data, and so on. These metrics are of particular relevance when Group By On Server is properly used but can be generally used to monitor the effects of report changes.
- Processing—This node provides information about the processing of the selected report: Grouping on Server?, Sorting on Server? Total Page Count required?, Number of Summary Values, and so on. The metrics provided here have a clear impact on performance and can be used to monitor the effective implementation of the optimization techniques described in this section.
- Latest Report Changes—This node provides information about recent changes to the report to facilitate performance monitoring.
- Performance Timing—This node provides the timing metrics based on opening the involved report and formatting its pages. These metrics provide the ultimate benchmark to determine the effectiveness of any implemented report optimization techniques.
Additional tree branches and nodes are displayed if the involved report contains subreports—each of these nodes will appear under a new parent node for each subreport facilitating performance analysis at a granular level.
One final note on performance monitoring: to facilitate record-keeping on the progress of any ongoing database or report optimizations, the Performance Information window provides the capability to save the involved report’s performance information to a file for future reference and time comparison.
Dynamic Cascading Prompts
Probably the most requested feature in years has been the desire to create Dynamic Cascading Prompts—a report prompt that adjusts scope as it’s being used, such as selecting Country, Region, and City and having only relevant Regions show for a selected Country and so on. This is now a powerful new feature in Crystal Reports XI. The following steps create a Dynamic Cascading Prompt that will allow the user to filter by Country, Region, and City.
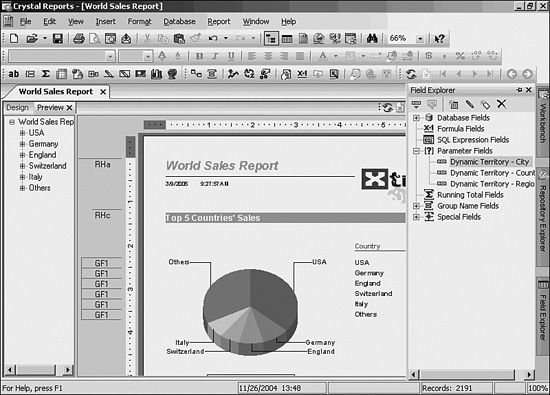
- Start by opening the sample World Sales Report (the default location is
C:Program FilesBusiness ObjectsCrystal Reports 11SamplesenReportsGeneral Business). - From the Field Explorer, select Parameter Fields, and click the New button. Figure 11.6 shows the new parameter window.
Figure 11.6. The new parameter window with default properties.
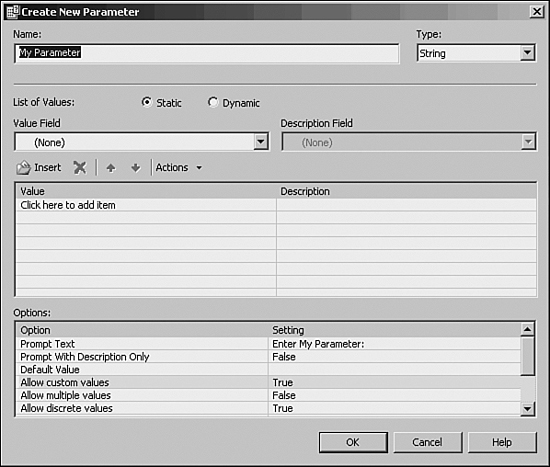
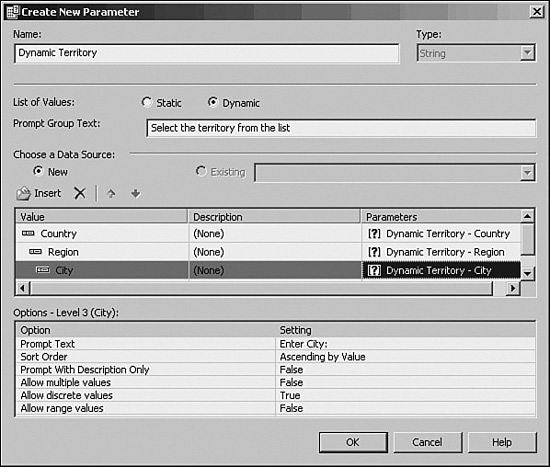
- Start by giving the Prompt a name such as Dynamic Territory. From the List of Values radio buttons, choose Dynamic, and for the Prompt Group Text enter some helpful text for the report consumer (in this case type in Select the territory from the list).
- When you click the box immediately below the Value header, you are able to select a report field. Choose Country. Click the box below Country and select Region. Click the box below Region and select City. In the three boxes below Parameter (where the text reads Click to Create Parameter), click each box one time to generate the default parameter. When complete, the window should look like Figure 11.7.
Figure 11.7. The new parameter window with the properties described in step 4.
- Now with the prompt created, click OK to save it. Notice in Figure 11.8 that with this one step, three distinct prompts have been created. This will be used in the last step to filter the report.
Figure 11.8. The parameter list with the three new parameters.
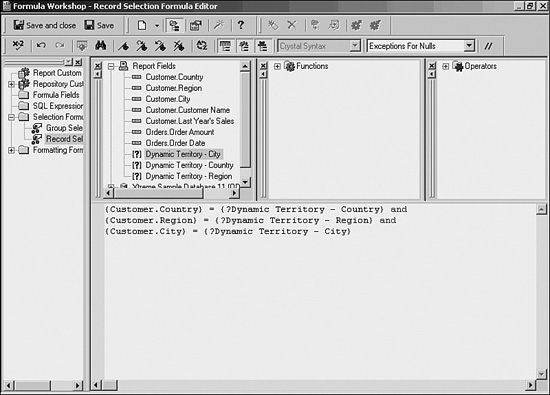
- In order to use these new parameters to filter this report, open the Record Selection Formula window (Report, Selection Formulas, Record). Enter the formula you see in Figure 11.9. In order to limit the risk of typing errors, you can simply double-click the fields and prompts from the list of report fields.
Figure 11.9. Using the new prompt to filter the report.
- After clicking the Save and Close button, you should be prompted immediately to select a Country, Region, and City.
Exploring the prompt window, you’ll notice several useful features:
• Only the top-level item is enabled. A user cannot select a Region or City until after they’ve selected a Country. The user is guided to the correct starting point.
• As the user selects a Country (such as USA), only those Regions appropriate to that Country are listed (in this case, States). Also, only Region becomes enabled, and City will not become enabled until after a Region is selected.
• If the user selects a Country, Region, and City but has not yet clicked OK and then goes back and changes the Country, both Region and City will be blanked out and City will again become disabled until the user picks a valid Region from the newly selected Country.
At all points during the process, the user is guided to where they need to go next.
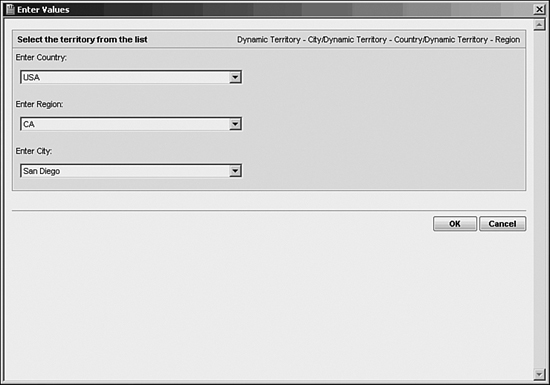
- Select USA for Country, CA for Region, and San Diego for City. See Figure 11.10 to confirm your selection. Clicking OK runs the report and the report is filtered according to your selection.
Figure 11.10. Set values for the Dynamic Cascading Parameters.
Crystal Reports in the Real World—Web Report Alert Viewing
This Real World section covers two very practical options. First, good uses of Alerting are discussed and second, learn how put together a complex Record Selection Formula.
There are many creative ways to employ alerting in Crystal Reports to direct the report consumer to information that requires attention. The following scenario helps you understand the use of alerting.
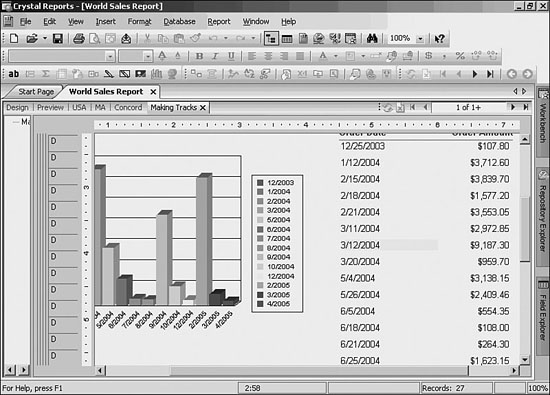
As part of her daily function, a Sales Executive views the World Sales Report multiple times. Although she is familiar with the report, it is easy to overlook an important piece of information if it is hidden in the pages to follow. Simply by looking at the first page of the report, it might not be clear if there is a problem that requires attention. The Sales report that is discussed here is grouped by Country, Region, City, and Customer. The detail section shows the order date and order amount. For the purpose of the example, the problem in the business occurs when a sales order is booked for more than $5,000. An alert will be created that flags this circumstance (see Figure 11.6).
Figure 11.11. Create an alert and set the properties.
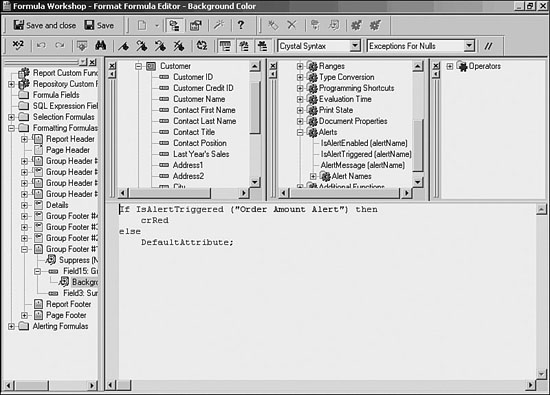
This sample report uses two techniques to draw the viewer’s attention to the significant records. The first step highlights the Group Header in red if any record in the group sets the alert. To do this the report will evaluate a built-in function IsAlertTriggered ('Order Amount Alert') and set the highlighting appropriately (see Figure 11.12).
Figure 11.12. Set properties for the group header.
Additionally, to help draw the executive to the order(s) triggering the alert you will highlight the background of the detail record(s) that have triggered the alert. To do this, conditionally set the fill color of the detail section to yellow (see Figure 11.13).
Figure 11.13. Set properties for the detail line.

Now, when the executive views the sales report and drills to the detail data, the records highlighted in yellow indicate where the problem occurred.
Conditional formatting techniques described here can be applied to other attributes of report elements such as ToolTips. ToolTips can contain alert messages based on the triggered alerts. You can also conditionally hide or display report sections to highlight (see Figure 11.14).
Figure 11.14. Report highlighting draws attention to critical records.
Now consider a complex Record Selection Formula. The goal of a Selection Formula is to determine which records belong in a report. To do this, each record is evaluated against the given Selection Formula and only those records that return True are passed into the report. A number of very simple Record Selection Formula’s are listed above. These formulas, so far, have all compared one field to one value, but what happens if there is a need to evaluate several different criteria for the same record? Frequently when this occurs, report authors try to resolve this with a complex nested if-then-else statement. There is a very simple alternative, however.
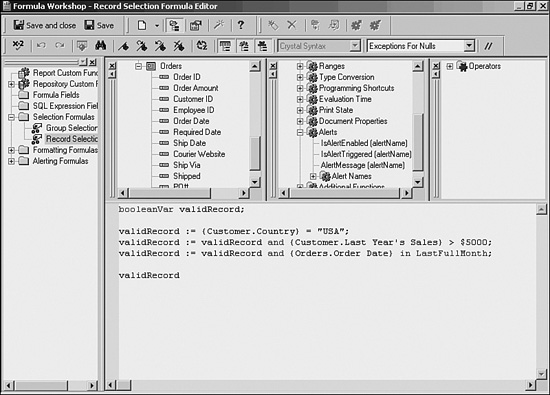
Consider this situation. What if the World Sales Report (from the samples that ship with Crystal Reports) needed to be filtered on the following three items:
- Only orders from Canada/Mexico/USA
- Only orders greater than $5,000
- Only orders shipped within the last full month
The Selection Formula in Figure 11.15 explicitly shows how the different parts of the formula are evaluated and then combined to resolve to a single Boolean value. There are a number of ways to achieve this goal, and this formula could be written very differently—this example is just intended to show the method step by step.
Figure 11.15. A sample Record Selection Formula that explicitly evaluates each criteria and returns one final evaluation.

Troubleshooting
Selection Formulas
There should be data in the report, but no records are returned.
Start by breaking out the Selection Formula into the component parts. As an example, the Selection Formula from Figure 11.15 is made of three parts. Start by commenting out the existing formula and build it up one part at a time. Test to see when the expected result is different from what is returned. After the specific parts are identified, it should be easier to see what the problem is. Also, remember that the result of the Selection Formula is Boolean (True or False) and only those records that result in True are accepted into the report.