
Chapter 10 Using Cross-Tabs for Summarized Reporting
Introduction to Cross-Tabs 250
Using the Cross-Tab Wizard 252
Using Top N with Cross-Tabs Reports 254
Using Advanced Cross-Tab Features 256
Crystal Reports in the Real World—Advanced Cross-Tabs 262
Introduction to Cross-Tabs
Cross-tabs are highly formatted and densely populated reports that look a lot like a spreadsheet. This chapter gives you an understanding of how and when to use cross-tabs for your reporting needs.
A cross-tab is a fully summarized set of cells in a grid format. It summarizes values both across as well as down. It is a compact representation of information that is grouped on two different axes. There can be more than one level of grouping on either axis (row or column).
A row goes across the page with the header on the left or right, whereas a column runs down the page with the header at the top or bottom. The intersections between the rows and columns are called cells. Cells are places where a value to be summarized displays. Totals in the cells are summarized for each row and column as well as the break points for the different levels of groupings.
Benefits of Cross-Tabs
Cross-tabs deliver data in a familiar spreadsheet format. They also summarize both vertically and horizontally, have a grid format, and can change size depending on the data.
Several of the most compelling reasons for using cross-tabs are
- Making better use of space
- Leveraging experience with the spreadsheet format
- Horizontal expansion
- Custom formatting
Because cross-tabs are grouped and summarized both vertically and horizontally, they are incredibly efficient at saving space as compared to a typical grouping report. They are very good at showing key information if the information required has at least two levels of grouping.
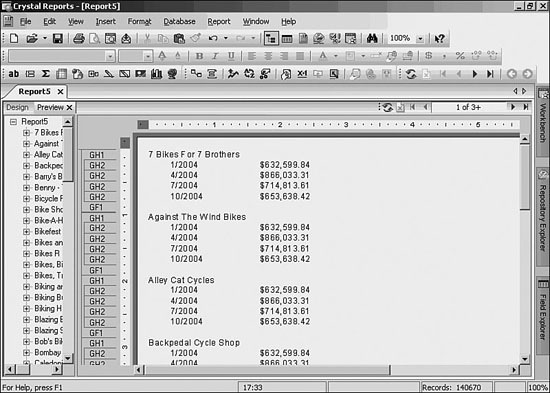
Here’s an example: quarterly sales figures for the customers in a sales report. These need to be grouped by customer and quarter. If the report were shown in a standard grouping layout like you’ve worked with previously, it could be several pages long. Figure 10.1 shows a typical Crystal Report in which nine pages display only the USA customers grouped by customer and quarter.
Figure 10.1. Standard grouping style used on a typical sales report.
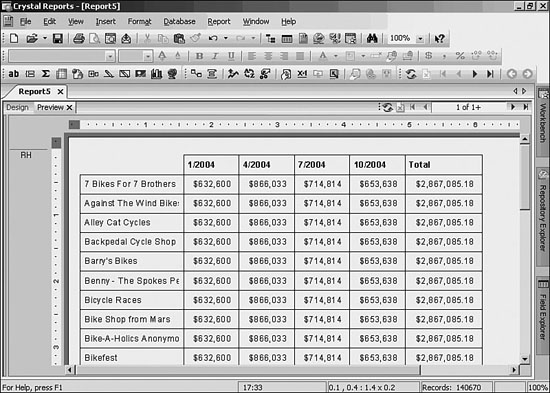
Cross-tabs replicate the information contained in a sales report while resembling a spreadsheet. Managers get a one-stop view of all the customers and their quarterly sales. Figure 10.2 shows how the information is more efficiently presented when a cross-tab is used to display the same information. Now the manager can view all the sales information at a glance.
Figure 10.2. Sales shown in a cross-tab.
Leveraging Experience with the Spreadsheet Format
Another benefit of the cross-tab format is its familiarity to many users of spreadsheet applications. Many people use spreadsheets in their daily routines and are accustomed to their look and feel. Because cross-tabs do appear very much like spreadsheets, Crystal Reports offers a familiar format and reporting style for many users. Again, providing the information in the format most comfortable to the user improves his productivity and your success.
Horizontal Expansion
Cross-tabs, like spreadsheets, expand both vertically and horizontally. In Crystal Reports, cross-tabs are one of only two object types that expand across horizontal pages. Crystal Reports handles this expansion automatically. If there is more data to display than the original size of the cross-tab allows for, Crystal Reports doesn’t cut off any critical data from the cross-tab area.
Custom Formatting
Cross-tab objects are also highly customizable in terms of formatting. Everyone has different needs from their data, so Crystal Reports allows for a great deal of changes to the formatting of these objects. Some of the most highly useful formatting features that are used in cross-tabs are
- Customizable styles (colors, grid lines, and so on)
- Vertical and horizontal placement of summaries
- Formatted grid lines
- Toggle for summary totals (rows/columns)
- Cell margins
- Indented row labels
- Location of totals (beginning or end for both rows/columns)
- Repeatable row labels
Using the Cross-Tab Wizard
Start with an example for the Xtreme Mountain Bike Company—the fictitious company that corresponds to the sample database provided with Crystal Reports.
Xtreme management needs a summary report to provide a quick glance at its shipped orders. The managers want to know how much has been spent by country for every six-month period, but they only want to see the top 10 countries. Follow these steps to create this report:
- Create a new report by choosing File, New and when the Report Gallery appears, choose As a Blank Report and then click OK.
- The Database Expert appears. In the Available Data Sources list, expand the following nodes: Create New Connection, ODBC. Select the Extreme Sample database 11, click Next, and then click Finish.
- Expand Tables, and double-click on Customer and Orders. Click OK.
- The Database Expert dialog appears again. Click OK again to accept the default linking and click Finish to go to the report.
- Insert a cross-tab by choosing Cross-Tab from the Insert menu, or click the Insert Cross-Tab button on the Insert toolbar (the fourth item from the left). This will present you with a shadowed box attached to your cursor. Place the box in any Header or Footer of your report (not on a page header or footer) and in this case put it in the upper-left corner of the Report Header. The box will become an empty cross-tab.
- Set up the initial cross-tab. Right-click on the empty cross-tab and choose Cross-Tab Expert. The rows of the report are the countries, so select Country from the Available Fields and then click the arrow button (>) under Rows. The column grouping is going to be by Order Date, so choose Order Date from Available Fields and then click the arrow button (>) under Columns. Because the Order Date is supposed to be by quarter, click on the Group Options drop-down under Columns and change the third list box from Each Day to For Each Quarter. Finally, choose Order Amount from Available Fields and click the arrow button (>) under Summarized Fields so that the cell’s summary is also selected. The final result looks like Figure 10.3.
Figure 10.3. Cross-Tab Expert—Cross-Tab tab.

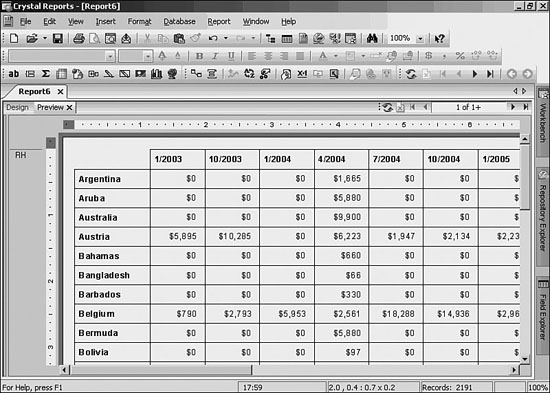
- Click the OK button to close the Cross-Tab Expert and see the result in the report Preview, as shown in Figure 10.4.
Figure 10.4. Cross-tab in Preview.
- Before continuing, save your work. Choose File, Save As. Call this cross-tab1.rpt and then click OK.
Using Top N with Cross-Tabs Reports
Group sorts can be done on a report level so that the records are sorted and removed as necessary. However, there are times when the records are needed in the overall report but not in a cross-tab.
- Right-click in the top-left corner of the cross-tab where there is no data or words and choose Group Sort Expert. Choose Top N for the primary list box and change 5 to 10 in the Where N Is field. In this example, make sure that the Others option is not selected.
- Click OK in the Group Sort Expert to view the final result, as shown in Figure 10.5.
Figure 10.5. Cross-tab with a Top 10 Group Sort applied.

- Save your work by choosing File, Save As. Call this cross-tab2.rpt and then click OK.
- What would happen if there was a need to have the option of showing the Top 5, the Top 10, or some other value for N? In previous versions of Crystal Reports, N was hard coded; if this level of flexibility was needed, there would be quite a bit of work involved! New in Crystal Reports XI, however, a formula may be used to set the value of N—and where there is a formula, there can be a parameter. Using the skills you learned in Chapter 5, “Implementing Parameters for Dynamic Reporting,” create a parameter.
- To create a new parameter, open the Field Explorer, select Parameter Fields, and click the New button. For Name, call this Top N, and set the type to Number. Because you’ve already learned about parameters, simply click OK to move on.
- Right-click on your cross-tab in the top left where there are no numbers or text, and select Group-Sort Expert. To the right of the number 10, click the Formula button. When the window opens, simply double-click the parameter in the list of fields. Figure 10.6 shows what the formula should look like.
Figure 10.6. Setting the parameter to be the value for N makes this chart much more flexible.

- Refresh the report several times using different values for N. Save this report as cross-tab dynamic N.rpt.
Using Advanced Cross-Tab Features
Crystal Reports version 9 introduced significant cross-tab improvements. The advanced features gave cross-tabs improved flexibility and functionality to satisfy even more reporting requirements.
Setting Relative Position
When it comes to planning the width or length of cross-tabs, remember they expand dynamically. With the addition of new information or data, the number of rows or columns can grow or shrink. This makes putting objects at the end of a cross-tab very difficult because it’s unclear when the object will be overwritten if new data appears.
For the same issue at the bottom of a cross-tab an easy solution exists. Place the new object in the next report section—even if it means adding a new section. By default, objects in Crystal Reports do not overwrite a section.
However, you often need to specify an item in the far-right column. In this report you might want a logo to be displayed to the right of the cross-tab. But, in Design, the size of the cross-tab doesn’t match what you see in Preview. Follow these steps to set the Relative Position:
- Open cross-tab dynamic N.rpt. Start with your last saved document by choosing it from the File list on the File, Open menu.
- Insert a text object by opening the Insert menu, and then selecting Text Object. Type something into the text box and color the font red so you can see it easily.
- Preview the report. Click F5 to see the result. It’s not exactly as you intended (see Figure 10.7).
Figure 10.7. Design with cross-tab and text field in improper location.
- Set the Relative Position property. Right-click on the Report Header label (on the left where it says Report Header, or RH, in the gray area). Choose Section Expert. Toggle the Relative Positions check box and click OK. To see the resulting report, refer to Figure 10.8.
Figure 10.8. Preview of the cross-tab and text field as requested.
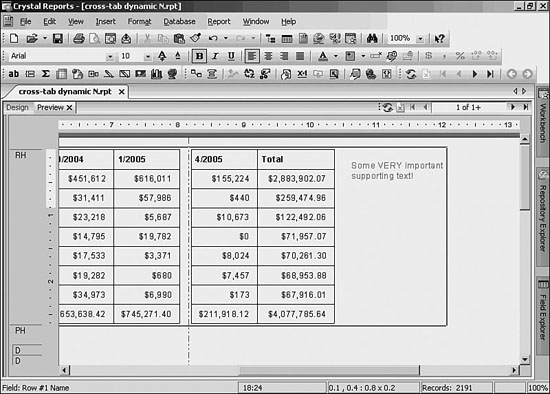
The Relative Position property works on the left, top, and right borders of the cross-tab. Remember that the bottom border of the cross-tab is handled by the end of a section. Relative positions can be used in many situations. For example, showing a chart on the information in the cross-tab can be very useful.
Inserting a “Percentage of” Summary
Cross-tabs are great for compressing a lot of data into a small space, but it can be difficult to find the peaks or valleys in the data when just looking at the raw numbers. In order to highlight these peaks and valleys, summary values can also be displayed as percentages of either the total rows or total columns:
- Add another summary. Right-click in the top left of the cross-tab where no data appears and choose Cross-Tab Expert. In the Cross-Tab tab, choose to add the Order Amount to the Summarized Fields list box by clicking the arrow (>) button. Notice that it looks like it duplicates the summary above it, so choose the Change Summary button.
- Change the Summary to a Percentage Summary. In the Edit Summary dialog in the Options box, select Show As Percentage Summary. Notice that it has an option for Row or Column. In this case you want to know by country (row) where the percentage split is, so keep Row selected as shown in Figure 10.9.
Figure 10.9. The Edit Summary dialog.

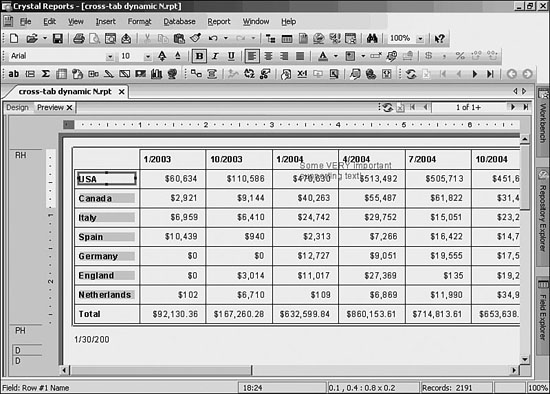
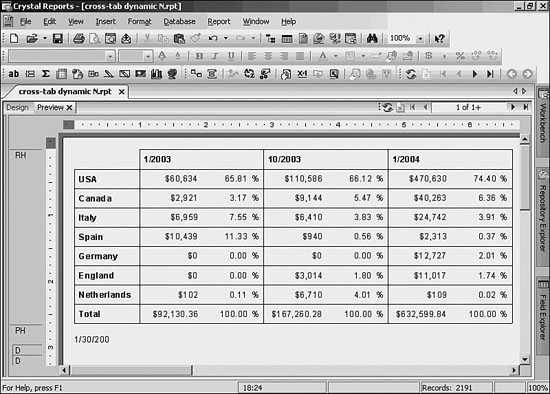
- Preview the results by clicking OK on both dialog windows. It should look like Figure 10.10.
Figure 10.10. Percentages by country.

Notice that the USA is consistently the largest percentage of Xtreme’s orders. It’s very easy to see this when percentages are added to the cross-tab.
Horizontal and Vertical Placement
Because the percentages add up to 100% down the page, it would be easier to understand if the summaries could be displayed side by side instead of one on top of the other. That way, the numbers down the page could be added up easily.
Crystal Reports allows the toggle between horizontal and vertical placement of summaries:
- Launch the Cross-Tab Expert. Right-click in the top-left of the cross-tab again and choose Cross-Tab Expert. Select the Customize Style tab. Under Summarized Fields, choose Horizontal; select the Show Labels option.
- View the report. Click the OK button to see the changes made to the cross-tab (see Figure 10.11).
Figure 10.11. Horizontal placement of summaries.
Inserting Summary Labels
Notice that on the report in Figure 10.11, the columns don’t have a title to identify them. Right-click on the cross-tab as before and choose Cross-Tab Expert, go to the Customize Style tab, and make sure to select the Show Labels option. Both titles for the percentage and the summary are exactly the same (Order Amount). This is because Crystal Reports is showing the field that a summary is acting on. In this case, where the field is being acted on twice, it’s not a good choice.
Crystal Reports enables you to edit these labels right on the cross-tab in both Design and Preview modes:
- Edit the Summary’s Title. Right-click on the first Order Amount title in the cross-tab and choose Edit Text. Delete the Order Amount Text and add Sum instead. Then choose the Align Center button on the toolbar while the item is highlighted. Click off the object and see the result.
- Edit the Percentage Title. Repeat the previous step for the second Order Amount field, but instead of changing the text to sum, change it to %, as shown in Figure 10.12.
Figure 10.12. Cross-tab with both labels changed.

Adding a Display String
Cross-tabs are based on the need for numbers or currency to be summarized, but there are times when the numbers don’t need to be seen to get the point across. Crystal Reports has a feature for all fields called Display String. This formatting feature allows a different representation for a field than its underlying value. For example, a manager might want to see text beside a percentage mark, as shown in Figure 10.13.
Figure 10.13. Sales report with text to identify great sales as display strings.

As previously mentioned, cross-tab cells are always an intersection of rows and columns with a summary because the strings are the visual representation of the underlying summary being computed in the cross-tab. You can affect this string using the advanced Cross-Tab features of Crystal Reports.
Crystal Reports can now separate the data value from its display. This is a powerful feature and is not limited to cross-tabs, although it plays a major role in cross-tabs because of the requirement of summaries.
To complete this report, ensure that all $0.00 amounts be shown as NONE on the report.
- Format the Order Amount Summary. Right-click on one of the $0.00 amounts on the report and choose Format Field. Choose the Common tab and then choose the Conditional Formatting (x+2) button to the right of Display String. The Formula Workshop appears.
- Format Formula for strings. Use an
If-Then-Elseformula structure to accomplish the task. The final result isIf CurrentFieldValue = 0 Then "NONE" Else ToText(CurrentFieldvalue)(see Figure 10.14).
Figure 10.14. Display String formatting formula.

- Close the dialog windows. Choose the Save and Close button on the Formula Workshop and then click OK on the Formatting dialog. The result is shown in Figure 10.15.
Figure 10.15. $0 changed to
NONEby using the Display String feature.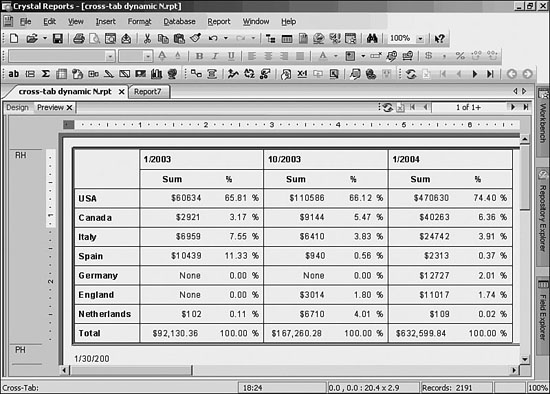
- Save the report as Crosstab3.rpt by choosing File, Save As.
The same technique that you used to change the display value of the cell can be used on any area, and you can combine the interactivity provided by parameters and other formula functions to drive any section or field in the cross-tab.
Crystal Reports in the Real World—Advanced Cross-Tabs
Although a single Cross-Tab that covers all the data in a report can be quite useful, with some large datasets it can be quite unreadable. A simple solution to this is to group the report and place the cross-tab in the group header or footer. Cross-tabs are context sensitive and if placed in a group header or footer will show only data for that group.
- Using the skills described in earlier chapters, create a new report from the Xtreme Sample Database. Add the Customer table to the report, group the report by country, and remove all fields but the Country field in the group header. See Figure 10.16 to see the report’s starting point.
Figure 10.16. Report framework.

- From the Insert menu, choose Cross-Tab. Add the Cross-Tab to the Group Header. Right-click on the Cross-Tab and select the Expert. From the list of available fields, select Customer Name and add it to the Rows window of the Cross-Tab. Select the Region and add it to the Columns window. Select Last Year’s Sales and add it to the Summarized Fields window. Check your work against Figure 10.17 for accuracy.
Figure 10.17. Building the cross-tab.

- Click OK to close the Cross-Tab expert. In Figure 10.18, we see the complete report.
Figure 10.18. Grouped cross-tabs can avoid confusion through improved readability.
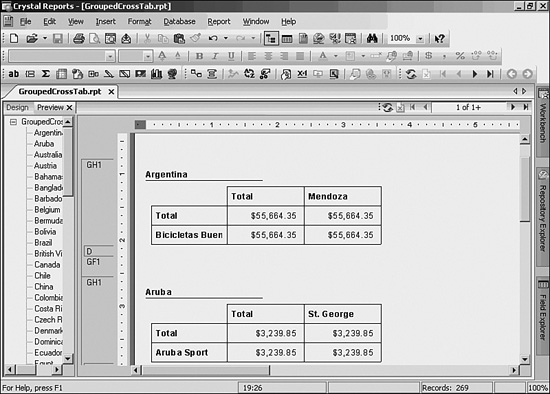
- Save the report as GroupedCrossTab.rpt.