Section 2.5 Properties of Functions

Before Starting this Section, Review
1 Inequalities (Section P.1 , page 6)
2 Evaluating a function (Section 2.4 , page 219)
Objectives
 Algebra in Coughing
Coughing is the body’s way of removing foreign material or mucus from the lungs and upper airway passages or reacting to an irritated airway. When you cough, the windpipe contracts to increase the velocity of the outgoing air.
The average flow velocity, υ,
where r0
Increasing and Decreasing Functions
1 Determine whether a function is increasing or decreasing on an interval.
In most applications, functions describe the relation between two quantities with variables representing their respective numerical values, with one quantity (the dependent variable) being directly determined by the other (the independent variable). As part of the study of such functions, we explore how the output values of the given function change with respect to the input values. When input values are increasing, the output values of the function may increase, decrease, or remain constant. We are also interested in the largest and smallest output values of the function within a given range of input values (relative maximum or minimum). We will formulate these concepts algebraically, but we first look at a graph to help us visualize them. Figure 2.57 represents the function that models regular weekday ridership numbers in the New York City Metro Subway as a function of time.
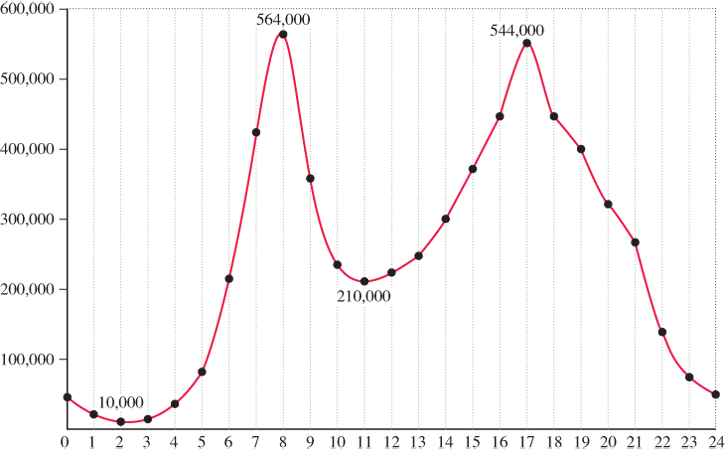
Figure 2.57
Weekday ridership numbers in New York Metro Subway as a function of time
We can see from the graph that the number of passengers is at an all-time low of 10,000 at about 2 a.m., and that the number of passengers increases during the morning commute period, peaking at 564,000 at about 8 a.m. After the morning rush hour peak, the number of passengers decreases, reaching a mid-day low of 210,000 at about 11 a.m., and increasing again to reach the afternoon rush hour period peak of 544,000 at about 5 p.m. Finally, the number of passengers decreases from 5 p.m. to 12 a.m.
Geometrically, the graph of an increasing function on an open interval (a, b) rises as x-values increase on (a, b). This is because, by definition, as x-values increase from x1
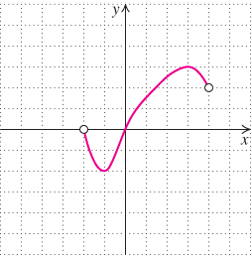
Functions can increase, decrease, or remain constant on different intervals within their domains. The function that assigns the height of a ball tossed in the air to the length of time it is in the air is an example of a function that increases, but also decreases, over different intervals of its domain. See Figure 2.59.
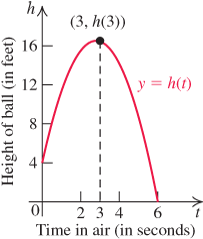
Figure 2.59 The function h(t) increases on (0, 3) and decreases on (3, 6)
Example 1 Tracking the Behavior of a Function
From the graph of the function f in Figure 2.57, find the intervals over which f is increasing, is decreasing, or is constant.
Solution
The function f is increasing on the open intervals (2, 8) and (11, 17). The function f is decreasing on the open intervals (0, 2), (8, 11), and (17, 24).
Side Note
When specifying the intervals over which a function f is increasing, decreasing, or constant, you need to use the intervals in the domain of f, not in the range of f.
Practice Problem 1
Using the graph of g in Figure 2.60 , find the intervals over which g is increasing, is decreasing, or is constant.
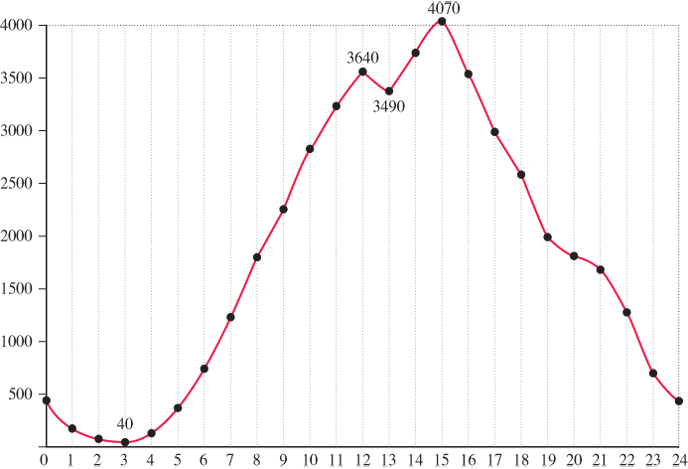
Figure 2.60
Weekend ridership numbers in St. Louis as a function of time
Relative Maximum and Minimum Values
2 Use a graph to locate relative maximum and minimum values.
If a function f has a value at a point a that is greater than or equal (less than or equal) to the values of f at all nearby points on both sides of a, that value is called a relative maximum (relative minimum). To locate the relative maxima and minima of a function on an open interval, we need to determine where the graph attains its highest and lowest points, respectively.
The value f(a) is called an extreme value of f if it is either a relative maximum value or a relative minimum value.
The graph of a function can help you find or approximate maximum or minimum values (if any) of the function. For example, the graph of a function f in Figure 2.61 shows that
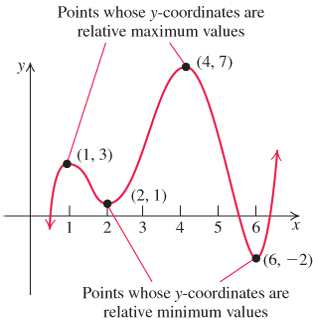
Figure 2.61
Relative maximum and minimum values
f has two relative maxima:
at x=1
x=1 with relative maximum value f(1)=3f(1)=3 at x=4
x=4 with relative maximum value f(4)=7f(4)=7
f has two relative minima:
at x=2
x=2 with relative minimum value f(2)=1f(2)=1 at x=6
x=6 with relative minimum value f(6)=−2f(6)=−2
Points on a graph where a function changes direction from increasing to decreasing or from decreasing to increasing are called turning points. See Figure 2.62. Turning points help us find relative maxima or minima.
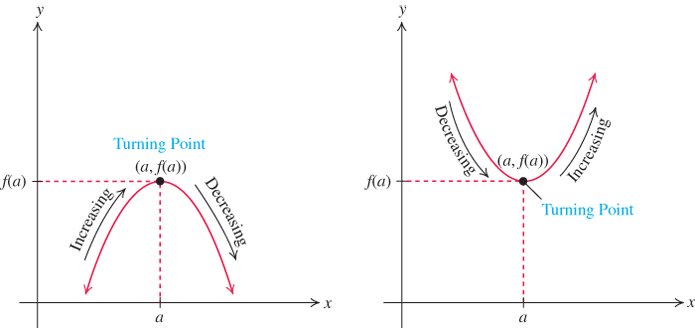
Figure 2.62
Turning points of a function
In Figure 2.61, each of the points (1, 3), (2, 1), (4, 7), and (6,−2)
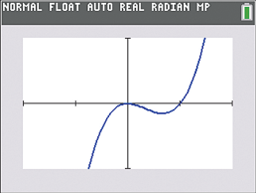
Figure 2.63
Example 2 Finding Relative Maxima and Minima
Use the graph of the function f in Figure 2.57 on page 236 to find the relative maxima and minima of f.
Solution
The function f has a relative maximum of 564,000 at 8 and of 544,000 at 17. The function f has a relative minimum of 10,000 at 2 and of 210,000 at 11.
Practice Problem 2
Use the graph of the function g in Figure 2.60 to find the relative maxima and minima of g.
![]() A graph is a powerful visual method of tracking the behavior of a function, including finding its maxima and minima. In calculus you will learn the general technique for finding the maxima and minima of functions based on just their equation. For the present, however, we will settle for an approximation of these points by using a graphing utility.
A graph is a powerful visual method of tracking the behavior of a function, including finding its maxima and minima. In calculus you will learn the general technique for finding the maxima and minima of functions based on just their equation. For the present, however, we will settle for an approximation of these points by using a graphing utility.
Example 3 Approximating Relative Extrema
![]() Use a graphing utility to approximate the relative maximum and the relative minimum points on the graph of the function f(x)=x3−x2
Use a graphing utility to approximate the relative maximum and the relative minimum points on the graph of the function f(x)=x3−x2
Solution
The graph of f is shown in Figure 2.63. By using the TRACE and ZOOM features of a graphing utility, we see that the function f has the following:
Relative minimum is estimated to be −0.15
−0.15 at 0.67.Relative maximum is estimated to be 0 at 0.
Practice Problem 3
Repeat Example 3 for g(x)=−2x3+3x2
g(x)=−2x3+3x2 .
 Example 4 Algebra in Coughing
The average flow velocity, υ
where r0
Solution
The graph of υ
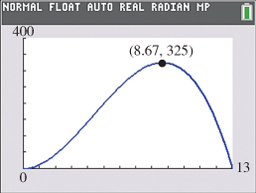
Figure 2.64
Flow velocity
Practice Problem 4
Repeat Example 4 for Mrs. Osborn. Again, let c=1
c=1 but r0=11.r0=11.
Even–Odd Functions and Symmetry
3 Identify even and odd functions.
This topic, even–odd functions, uses ideas of symmetry discussed in Section 2.2.
Example 5 Graphing the Squaring Function
Show that the squaring function f(x)=x2
Solution
The function f(x)=x2
To sketch the graph of f(x)=x2,
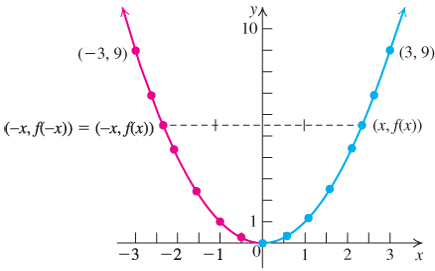
Figure 2.65
Graph of f(x)=x2
Table 2.9(a)
| x | 0 | 12 |
1 | 32 |
2 | 52 |
3 |
| f(x)=x2 |
0 | 14 |
1 | 94 |
4 | 254 |
9 |
Table 2.9(b)
| x | 0 | −12 |
−1 |
−32 |
−2 |
−52 |
−3 |
| f(x)=x2 |
0 | 14 |
1 |
94 |
4 |
254 |
9 |
Practice Problem 5
Show that the function f(x)=−x2
f(x)=−x2 is an even function and sketch its graph.
Side Note
The graph of a nonzero function cannot be symmetric with respect to the x-axis because the two ordered pairs (x, y) and (x,−y)
Example 6 Graphing the Cubing Function
Show that the cubing function defined by g(x)=x3
Solution
The function g(x)=x3
To sketch the graph of g(x)=x3,
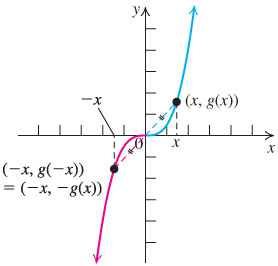
Figure 2.66
Graph of g(x)=x3
Practice Problem 6
Show that the function f(x)=−x3
f(x)=−x3 is an odd function and sketch its graph.
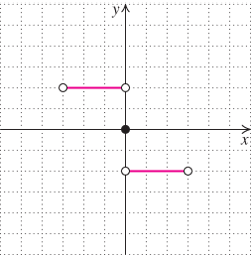
The function h(x)=2x+3,
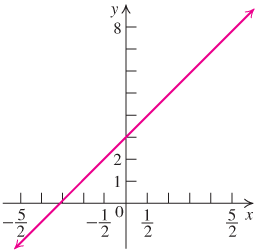
Figure 2.67
Graph of h(x)=2x+3
Example 7 Testing for Evenness and Oddness
Determine whether each function is even, odd, or neither.
g(x)=x3−4x
g(x)=x3−4x f(x)=x2+5
f(x)=x2+5 h(x)=2x3+x2
h(x)=2x3+x2
Solution
g(x) is an odd function because
g(−x)=(−x)3−4(−x)Replace x with −x.=−x3+4xSimplify.=−(x3−4x)Distributive property=−g(x)g(−x)====(−x)3−4(−x)−x3+4x−(x3−4x)−g(x)Replace x with −x.Simplify.Distributive property f(x) is an even function because
f (−x)=(−x)2+5Replace x with −x.=x2+5Simplify.=f(x)f (−x)===(−x)2+5x2+5f(x)Replace x with −x.Simplify. - h(−x)=2(−x)3+(−x)2Replace x with −x.=−2x3+x2Simplify.
h(−x)==2(−x)3+(−x)2−2x3+x2Replace x with −x.Simplify. Comparing h(x)=2x3+x2
h(x)=2x3+x2 , h(−x)=−2x3+x2h(−x)=−2x3+x2 , and −h(x)=−2x3−x2−h(x)=−2x3−x2 , we note that h(−x)≠h(x)h(−x)≠h(x) and h(−x)≠−h(x)h(−x)≠−h(x) . Hence, h(x) is neither even nor odd.
Practice Problem 7
Repeat Example 7 for each function.
g(x)=3x4−5x2
g(x)=3x4−5x2 f(x)=4x5+2x3
f(x)=4x5+2x3 h(x)=2x+1
h(x)=2x+1
Average Rate of Change
4 Find the average rate of change of a function.
Suppose your salary increases from $25,000 a year to $40,000 a year over a five-year period. You then have the following:
Regardless of when you actually received the raises during the five-year period, the final salary is the same as if you received your average annual increase of $3000 each year.
The average rate of change can be defined in a more general setting.
Since the slope of a line is the ratio of the vertical change in y to the horizontal change in x, ΔyΔx
Geometrically, the average rate of change of f from x=a
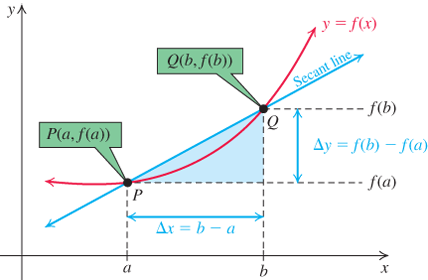
Figure 2.68
Secant line and average rate of change
Practice Problem 8
Find the average rate of change of f(x)=1−x2
f(x)=1−x2 as x changes from 2 to 4.
Example 9 Finding the Average Rate of Change
Find the average rate of change of f(t)=2t2−3
Solution
Practice Problem 9
Find the average rate of change of f(t)=1−t
f(t)=1−t as t changes from t=2t=2 to t=x, x≠2.t=x, x≠2.
Example 10 Average Decrease in Sound Level
The loudness of music coming from a TV is given by the function f(x)=2500x2
Solution
We want to determine the average rate of change in f from x=5
Then, f(b)−f(a)b−a=f(10)−f(5)10−5=−755=−15
The average rate of change is −15
Practice Problem 10
The number of bacteria per cubic centimeter in a swimming pool x days after adding chlorine to the pool is given by the function f(x)=100x2−800x+2000
f(x)=100x2−800x+2000 . Find the average rate of change in the number of bacteria per cubic centimeter in the pool from the day the chlorine is added to three days later. [Hint: The chlorine is added on day 0.]
The average rate of change calculated in Example 9 is a difference quotient at 5. The difference quotient is an important concept in calculus.
Example 11 Evaluating and Simplifying a Difference Quotient
Let f(x)=2x2−3x+5.
Solution
First, we find f(x+h).
Then we substitute into the difference quotient.
Practice Problem 11
Repeat Example 11 for f(x)=−x2+x−3.
f(x)=−x2+x−3.
Section 2.5 Exercises
Concepts and Vocabulary
A function f is decreasing if x1<x2
x1<x2 implies that f(x1)f(x1) f(x2).f(x2). f(a) is a relative maximum of f if there is an interval (x1, x2)
(x1, x2) containing a such that for every x in the interval (x1, x2).(x1, x2). A function f is even if .
The average rate of change of f as x changes from x=a
x=a to x=bx=b is , a≠b.a≠b. True or False. The average rate of change of f as x changes from a to b is the slope of the line through the points (a, f(a)) and (b, f(b)).
True or False. A relative maximum or a relative minimum point on a graph is a turning point on the graph of a function.
True or False. Functions can increase, decrease, or remain constant on different intervals of their domains.
True or False. The graph of an odd function is symmetric with respect to the y-axis.
Building Skills
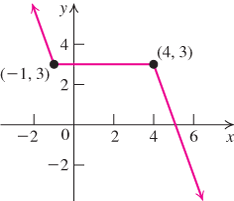
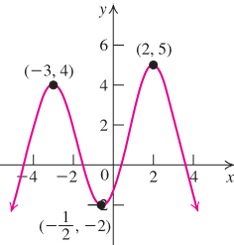
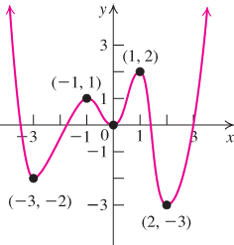
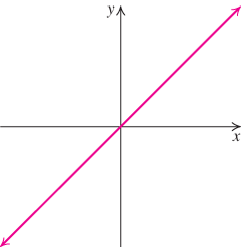
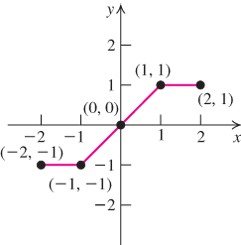
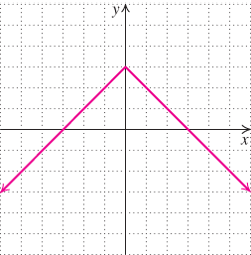
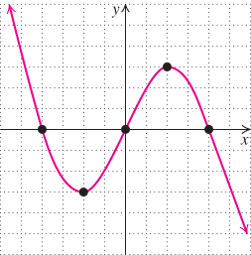
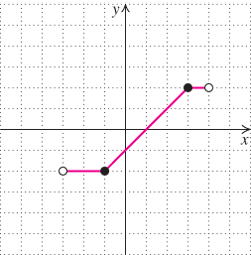
In Exercises 9–16, the graph of a function is given. For each function, determine the intervals over which the function is increasing, decreasing, or constant.

In Exercises 17–24, locate relative maximum and relative minimum points on the graph. State whether each relative extremum point is a turning point.
The graph of Exercise 9
The graph of Exercise 10
The graph of Exercise 11
The graph of Exercise 12
The graph of Exercise 13
The graph of Exercise 14
The graph of Exercise 15
The graph of Exercise 16
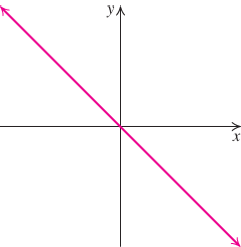
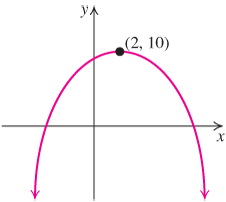
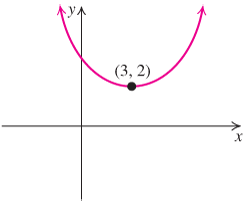
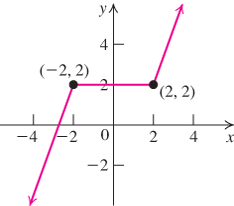
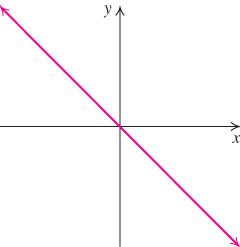
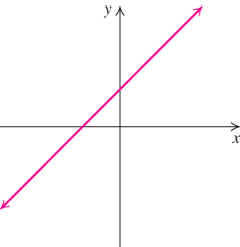
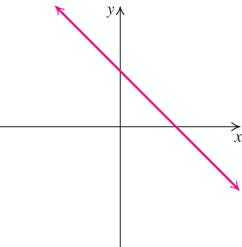
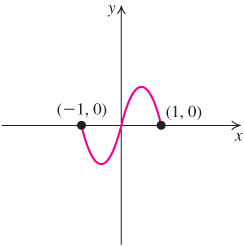
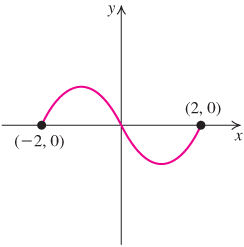
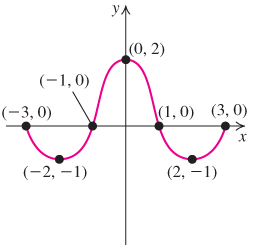
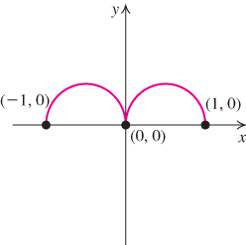
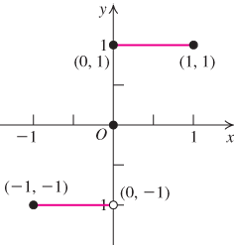
In Exercises 25–34, the graph of a function is given. State whether the function is odd, even, or neither.
In Exercises 35–48, determine algebraically whether the given function is odd, even, or neither.
f(x)=2x4+4
f(x)=2x4+4 g(x)=3x4−5
g(x)=3x4−5 g(x)=3x3−5
g(x)=3x3−5 g(x)=3x3−5
g(x)=3x3−5 f(x)=2x+4
f(x)=2x+4 g(x)=3x+7
g(x)=3x+7 f(x)=1x2+4
f(x)=1x2+4 g(x)=x2+2x4+1
g(x)=x2+2x4+1 f(x)=x3x2+1
f(x)=x3x2+1 g(x)=x4+32x3−3x
g(x)=x4+32x3−3x f(x)=xx5−3x3
f(x)=xx5−3x3 g(x)=x3+2x2x5−3x
g(x)=x3+2x2x5−3x f(x)=x2−2x5x4+7
f(x)=x2−2x5x4+7 g(x)=3x2+7x−3
g(x)=3x2+7x−3
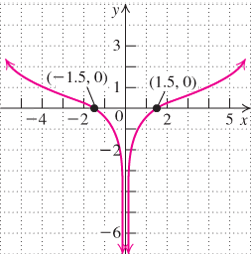
In Exercises 49–56, the graph of a function is given; each grid line represents 1 unit. Use the graph to find each of the following.
The domain and the range of the function
The intercepts, if any
The intervals on which the function is increasing, decreasing, or constant
The relative extrema points, if any
Whether the function is odd, even, or neither
In Exercises 57–68, find the average rate of change of the function as x changes from a to b.
f(x)=−2x+7; a=−1, b=3
f(x)=−2x+7; a=−1, b=3 f(x)=4x−9; a=−2, b=2
f(x)=4x−9; a=−2, b=2 f(x)=3x+c; a=1, b=5
f(x)=3x+c; a=1, b=5 f(x)=mx+c; a=−1, b=7
f(x)=mx+c; a=−1, b=7 h(x)=x2−1; a=−2, b=0
h(x)=x2−1; a=−2, b=0 h(x)=2−x2;a=3, b=4
h(x)=2−x2;a=3, b=4 f(x)=(3−x)2;a=1, b=3
f(x)=(3−x)2;a=1, b=3 f(x)=(x−2)2;a=−1, b=5
f(x)=(x−2)2;a=−1, b=5 g(x)=x3;a=−1, b=3
g(x)=x3;a=−1, b=3 g(x)=−x3;a=−1, b=3
g(x)=−x3;a=−1, b=3 h(x)=1x;a=2, b=6
h(x)=1x;a=2, b=6 h(x)=4x+3;a=−2, b=4
h(x)=4x+3;a=−2, b=4
In Exercises 69–82, find and simplify the difference quotient of the form f(x+h)−f(x)h, h≠0.
f(x)=x
f(x)=x f(x)=3x+2
f(x)=3x+2 f(x)=−2x+3
f(x)=−2x+3 f(x)=−5x−6
f(x)=−5x−6 f(x)=mx+b
f(x)=mx+b f(x)=−2ax+c
f(x)=−2ax+c f(x)=x2
f(x)=x2 f(x)=x2−x
f(x)=x2−x f(x)=2x2+3x
f(x)=2x2+3x f(x)=3x2−2x+5
f(x)=3x2−2x+5 f(x)=4
f(x)=4 f(x)=−3
f(x)=−3 f(x)=1x
f(x)=1x f(x)=−1x
f(x)=−1x
Applying the Concepts
The graph of the function f that models the number of flu cases (per 100,000) observed in urban areas in Pennsylvania in flu seasons between 2006 and 2014 is given below.
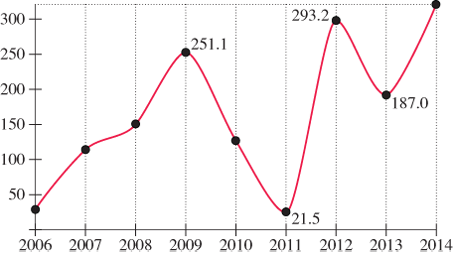
Determine the open intervals on which the function is increasing or decreasing.
Find all relative maxima and minima.
The graph of the function f that models monthly averages of rainfall (in mm) in Tokyo (Japan) observed over the period of one year is given below.
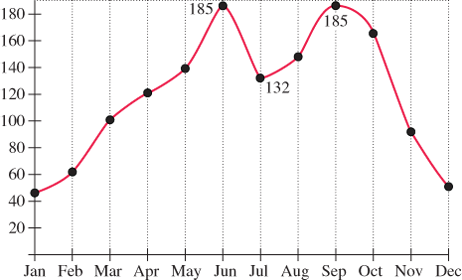
Determine the open intervals on which the function is increasing or decreasing.
Find all relative maxima and minima.
Motion from a graph. For Exercises 85–94, use the accompanying graph of a particle moving on a coordinate line with velocity v=f(t)
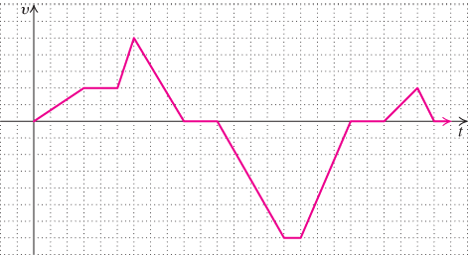
Find the domain of υ=f(t).
υ=f(t). Interpret.Find the range of υ=f(t).
υ=f(t). Interpret.Find the intervals over which the graph is above the t-axis. Interpret.
Find the intervals over which the graph is below the t-axis. Interpret.
Find the intervals over which |v|=|f(t)|
|v|=|f(t)| is increasing. Interpret for υ>0υ>0 and for υ<0.υ<0. Find the intervals over which |v|=|f(t)|
|v|=|f(t)| is decreasing. Interpret for υ>0υ>0 and for υ<0.υ<0. When does the particle have maximum speed?
When does the particle have minimum speed?
Describe the motion of the particle between t=5
t=5 and t=6.t=6. Describe the motion of the particle between t=16
t=16 and t=19.t=19. Maximizing volume. An open cardboard box is to be made from a piece of 12-inch square cardboard by cutting equal squares from the four corners and turning up the sides. Let x be the length of the side of the square to be cut out.
Show that the volume, V, of the box is given by
V=4x3−48x2+144x.V=4x3−48x2+144x. Find the domain of V.
- Use a graphing utility to graph the volume function and determine the range of V from its graph.
Find the value of x for which V has a maximum value.
Minimizing the sum. Find two positive numbers whose product is 32 and whose sum is as small as possible.
Let one of the numbers be x; show that the sum
S=x+32x.S=x+32x. - Use a graphing utility to graph the sum function and estimate the value of x for which S has a minimum value.
Cost. A computer notebook manufacturer has a daily fixed cost of $10,500 and a marginal cost of $210 per notebook.
Find the daily cost C(x) of manufacturing x notebooks per day.
Find the cost of producing 50 notebooks per day.
Find the average cost of a computer notebook, assuming that 50 notebooks are manufactured each day.
How many notebooks should be manufactured each day so that the average cost per notebook is $315?
Geometry. Find an equation of the secant line to the graph of f(x)=−2x2+3x+4
f(x)=−2x2+3x+4 passing through the points on the graph with x-coordinates 1 and 3.Average student population. In 2000, about 15.3 million students were enrolled in U.S. colleges. In 2014, about 20.2 million students were enrolled in U.S. colleges. Assuming a linear increase in student population, find the average rate of increase in the number of students per year from 2000 to 2014.
Average drain rate. Beginning one minute after draining a storage tank starts, the amount of water in the tank is given by f(t)=60t−5
f(t)=60t−5 gallons. Find the average rate of decrease in the number of gallons in the tank between one and five minutes.Average velocity. A particle is moving in a straight line so that its position at time t in seconds is f(t)=t2+3t+4
f(t)=t2+3t+4 feet to the right of a reference point for t≥0.t≥0. Find and interpret f(0).
Find the distance traveled by the particle in four seconds.
Find the average velocity of the particle during the first three seconds.
Find its average velocity between the second and fifth seconds.
Population. The population of Sardonia (in millions) t years after 2000 is given by P(t)=0.01t2+0.2t+50.
P(t)=0.01t2+0.2t+50. Find and interpret (i) P(0), (ii) P(4).
What was the average rate of growth of Sardonia’s population between 2000 and 2010?
Beyond the Basics
let f(x)=x−1x+1.
f(x)=x−1x+1. Show that f(2x)=3f(x)+ 1f(x)+ 3.f(2x)=3f(x)+ 1f(x)+ 3. What function is both odd and even?
Find algebraically the relative maximum point on the graph of f(x)=−(x+1)2+5.
f(x)=−(x+1)2+5. Does its graph have a relative minimum point?Give an example to illustrate that a relative maximum point on a graph need not be a turning point on the graph.
In Exercises 107–110, find the difference quotient
f(x+h)−f(x)h, h≠0.
f(x)=√x
f(x)=x−−√ f(x)=√x−1
f(x)=x−1−−−−−√ f(x)=−1√x
f(x)=−1x−−√ f(x)=1x2
f(x)=1x2
Critical Thinking / Discussion / Writing
Let f be a function with domain [a, b] so that a and b are endpoints of this domain.
Define relative maximum (minimum) at a.
Define relative maximum (minimum) at b.
Give an example (if possible) of a function f matching each description.
f has endpoint maximum and endpoint minimum.
f has endpoint minimum but no endpoint maximum.
f has endpoint maximum but no endpoint minimum.
f has neither endpoint maximum nor endpoint minimum
Getting Ready for the Next Section
In Exercises 114–116, find the slope–intercept form of the equation of the line that passes through the given points P and Q.
P=(−1, 3)
P=(−1, 3) and Q=(4,−2)Q=(4,−2) P=(6, 2)
P=(6, 2) and Q=(7,−1)Q=(7,−1) P=(3,−5)
P=(3,−5) and Q=(6,−3)Q=(6,−3) Sketch the graph of y=−2x+3
y=−2x+3 .Sketch the graph of 2x+5y−10=0
2x+5y−10=0 .If x=−3
x=−3 , then |x+1|=|x+1|= .Find x so that |2x−8|=0
.|2x−8|=0 Let f(x)=x3/2.
f(x)=x3/2. Find (i) f(2), (ii) f(4), and (iii) f(−4).f(−4). Let f(x)=x2/3.
f(x)=x2/3. Find (i) f(2), (ii) f(8), and (iii) f(−8).f(−8).