
Chapter 2
Camera and Printing Exposure
Photograph by David Kelbe, Imaging Science Student, Rochester Institute of Technology
Camera Exposure Versus Photographic Exposure
Although the terms camera exposure and photographic exposure are related, they are not the same. The term camera exposure refers to the combination of shutter speed and ƒ-number used to expose an image. Photographic exposure is defined as the quantity of light per unit area received by the film, photosensitive material, or digital sensor, and it is calculated by multiplying the illuminance (H) and the exposure time (t). The relationship is commonly expressed as H = E × t.
Assuming that a camera shutter is accurate, the shutter setting is a measure of exposure time (t), but the ƒ-number setting is not a measure of the illuminance. In a typical picture-making situation, the film or sensor receives many different photographic exposures in different areas. Opening the diaphragm by one stop doubles all the different illuminances that constitute the light image on the film or sensor. The ƒ-number and shutter settings on a camera enable the photographer to control the photographic exposures received by the film or sensor, even though the quantitative values of those exposures are not known. The function of an exposure meter is to determine a combination of ƒ-number and shutter speed settings that will produce a correctly exposed photograph, taking into account the amount of light falling on or reflected by the subject and the speed rating of the light-sensitive material being exposed.
Relative aperture is the same as f-number, but camera exposure is not the same as photographic exposure.
F-Numbers
F-Number = focal length/(effective aperture)
Relative aperture is another name for ƒ-number. The value of the relative aperture or ƒ-number depends upon two things: the ƒocal length of the lens and the effective aperture. The effective aperture is defined as the diameter of the entering beam of light that will just fill the opening in the diaphragm of a camera lens or other optical system. The diameter of the opening in the diaphragm is known as the aperture. When the diaphragm is located in front of a lens, the effective aperture is the same as the aperture, as illustrated in Figure 2-1. Rarely is the diaphragm located in front of a photographic lens, which makes it necessary to take into account any change in direction of the light rays between the time they enter the lens and when they pass through the diaphragm opening. Since a lens compresses the entering beam of light into a converging cone, a diaphragm with a fixed aperture will transmit more light when it is located behind the lens than in front (see Figure 2-2).
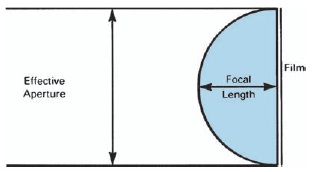
Figure 2-1 When a diaphragm is located in front of a lens, the effective aperture is the same as the aperture or diaphragm opening.
The larger the f-number the smaller the aperture.

Figure 2-2 A diaphragm will transmit more light when located behind the lens than in front.
Calculating F-Numbers
F-numbers are calculated by dividing the lens focal length (/) by the effective aperture (D), or ƒ-number = ƒ/D. Since the effective aperture is rarely the same size as the aperture (the physical opening in the diaphragm), the diameter of the entering beam of light that just fills the diaphragm opening must be measured. One method to determine this diameter is to place a point source of light one focal length behind the lens so the diaphragm opening restricts the beam of light emerging from the front of the lens. This beam will be the same size as an entering beam that just fills the diaphragm opening (see Figure 2-3). The diameter of a beam of light can be measured with a ruler in front of the lens.
Focusing the lens on a distant object, such as the sun, and measuring the distance from the middle of the lens to the sharp image can determine the focal length of a simple lens. (A more precise procedure is described in Chapter 4, Photographic Optics.) If the focal length of an uncalibrated lens is found to be 8 inches, and the diameter of the effective aperture at the maximum opening is 1 inch, the /-number is the focal length divided by the effective aperture—8/1, or ƒ/8. Note that when the lens is stopped down so that the effective aperture becomes smaller, 1/2 inch, for example, the /-number becomes larger since 8 divided by 1/2 is ƒ/16. The ƒ-numbers become larger as the diaphragm is stopped down and the amount of light transmitted by the lens becomes smaller, however this relationship is not a simple inverse ratio. The reason for this is that ƒ-number is based on the diameter of the entering beam of light, whereas the relative amount of light transmitted is based on the area of a cross section of the beam of light. The relationship between the area (A) and the diameter of a circle (D) is A = π × D2/4. Thus the amount of light transmitted by a lens varies directly with the diameter squared (D2) and inversely with the ƒ-number squared.

Figure 2-3 A procedure for determining the effective aperture is to place a point source of light one focal length behind the lens and measure the diameter of the beam of light that emerges from the front of the lens.
Whole Stops
Photographers find it useful to know the series of /-numbers that represent whole stops: ƒ/0.7, 1.0, 1.4, 2.0, 2.8, 4, 5.6, 8, 11, 16, 22, 32, 45, 64. The ƒ-number series can be extended in either direction by noting that the factor for adjacent numbers is the square root of 2, or approximately 1.4. Also note that alternate /-numbers vary by a factor of 2, with a small adjustment between 5.6 and 11, and between 22 and 45, to compensate for the cumulative effect of fractional units.
Each time the diaphragm is stopped down one stop (e.g., from ƒ/8 to ƒ/11), the amount of light transmitted is divided by two, and the exposure time required to obtain the same photographic exposure on the film is multiplied by two.
Maximum Diaphragm Openings
The ƒ-number range on most camera lenses is approximately seven stops. A typical 35-mm camera lens may have, for example, a range from ƒ/1.4 to ƒ/16 (seven stops), and a typical view camera lens may have a range from ƒ/5.6 to ƒ/45 (six stops). There has been a constant demand over the years for lens designers to make faster and faster lenses. In the 1940s, ƒ/2 lenses were considered fast for 35-mm cameras. Now ƒ/0.7 lenses are mass-produced, a gain of three stops. The fastest one-element lens that can be made with conventional optical design is ƒ/0.5. Such a lens would be half a glass sphere with the film in contact with the flat surface, as illustrated in Figure 2-4.
f/2 is two stops faster than f/4.
The need to make photographs under very low light levels, such as moonlight and even starlight for surveillance and other purposes, has led photographic engineers to explore alternatives to the difficult task of further increasing the speed of lenses and films. The most successful are “image-intensifiers,” which can electronically amplify the light image formed by the camera lens by as much as 30,000 times. To achieve the same effect by designing a lens faster than ƒ/0.7 would require an ƒ-number of ƒ/0.004, which represents an increase in speed of approximately 15 stops. To achieve the same effect by making film faster than ISO 400/27° would require the film to have a speed of ISO 12,000,000/72°. With image intensifiers that are now available, it is necessary to trade off some resolution of fine detail for the increase in speed.
Figure 2-4 An f/0.5 lens, where the lens is half a sphere. The focal length is the radius of the sphere, and the effective aperture is the diameter.
Common f-number series: f/0.7, 1.0, 1.4, 2.0, 2.8, 4, 5.6, 8, 11, 16, 22, 32, 45, 64.
The fastest singleelement glass lens that can be made is f/0.5.
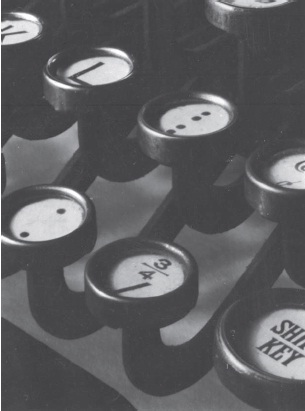
Figure 2-5 Photograph made in 1912 by Ralph Steiner, originator of the East Coast f/180 School, using a pinhole in combination with a camera lens (photograph by Ralph Steiner).
Minimum Diaphragm Openings
Depth of field increases as a lens is stopped down, therefore it would seem desirable to mark f-numbers down to very small openings on all lenses. In 1932, a group of photographers including Ansel Adams, Imogen Cunningham, and Edward Weston formed an organization called Group ƒ/64, with the name implying that they favored making photographs in which everything was sharp.1 Later, Ralph Steiner used a pinhole with his camera lenses and began his own East Coast ƒ/180 School (see Figure 2-5).2
Although stopping down increases depth of field, it also increases the diffraction of light, which tends to reduce image sharpness overall. With a lens stopped down to ƒ/64, the maximum resolving power that can be obtained— no matter how good the lens or accurate the focusing—is approximately 28 lines/mm. For an 8 × 10-inch camera this is quite good because 10 lines/mm is considered adequate in a print viewed at a distance of 10 inches. Stopping a 35-mm camera down to ƒ/64 would produce the same resolving power of 28 lines/mm in the negative, but since the negative must be enlarged eight times to obtain an 8 × 10-inch print, the resolving power in the print would be only 28/8, or 3.5 lines/mm. (The calculation of diffraction-limited resolving power is discussed in the Photographic Optics chapter.) Lens manufacturers normally do not calibrate lenses for 35-mm cameras for openings smaller than ƒ/22 because at that opening the diffraction-limited resolving power is approximately 80 lines/mm in the negative or 10 lines/mm in an 8 × 10-inch print (see Figure 2-6).
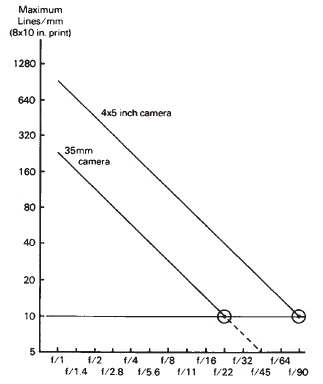
Figure 2-6 The sloping lines show that the diffraction-limited resolving power decreases as a lens is stopped down. A just-acceptable resolving power of 10 lines/mm is reached at f/22 with a 35-mm camera and at f/90 with a 4 × 5-inch camera. Resolving-power values are based on 8 × 10-inch prints, which represent a magnification of 2 for 4 × 5-inch negatives and 8 for 35-mm negatives.
Intermediate F-Numbers
There are situations in which it is necessary to know the ƒ-number of divisions smaller than whole stops, such as 1/3, 1/2, or 2/3 stop larger or smaller than a given ƒ-number. (Many lenses have click-stops to obtain 1/2-stop settings, and modern exposure meters can display down to 1/10-stop differences.) Intermediate values can be determined easily on instruments having interval scales, such as thermometers and balances for weighing chemicals, by measuring or estimating between markings or numbers. The ƒ-number series, on the other hand, is a ratio scale in which each number is determined by multiplying or dividing the preceding number by a constant factor—the square root of 2 (approximately 1.4) for whole stops. For 1/2 stops the factor is the square root of 1.5 (1.22). For 1/3 stops the factor is the square root of 1.33 (1.15), and for 2/3 stops the factor is the square root of 1.67 (1.29). Multiplying ƒ/2, for example, by these factors to determine /-numbers that represent stopping down by 1/3, 1/2, 2/3, and 1 stop, the ƒ-numbers are ƒ/2.30, f/2.45, ƒ/2.58, and ƒ/2.8.
Limitations of the F-Number System
F-numbers quite accurately indicate the change in the amount of light transmitted by the lens and therefore the change in the exposure received by the film or sensor in the camera. F-numbers cannot be relied upon to provide the correct exposure based on exposure meter readings of the light falling on a subject or reflected by a subject. The most obvious shortcoming of the ƒ-number system is that it is based on the focal length of the lens. The only time the film or sensor is located one focal length from the lens is when the camera is focused on infinity, which only happens occasionally.
The square root of 2 is the factor needed to calculate a whole-stop change between f-numbers.
As a result, when the camera is focused on objects that are closer than infinity (image distance is larger than 1 focal length), it is necessary to make adjustments to the exposure. In practice, it is usually not necessary to make any adjustment until the camera is focused on a distance equal to 10 times the lens focal length or closer. At an object distance of 10 focal lengths, the exposure error would be 23% or about one-quarter stop if no adjustment were made. With short focal-length lenses 10 focal lengths is a small distance, only 20 inches, for example, with a normal 50-mm or 2-inch focal-length lens on a 35-mm camera. With a normal 12-inch focal length lens on an 8 × 10-inch view camera, on the other hand, 10 focal lengths amount to an object distance of 10 feet. It can be dangerous to assume that an exposure correction is necessary only when the camera is focused on a very close object.
The f-numbers marked on lenses are accurate only when the camera is focused on infinity.
A 1-to-1 closeup photograph requires a four-times increase in the exposure.
There are various methods for making the adjustment when photographing objects that are within the 10-focal-length range. One method is to calculate the effective f-number, and then determine the exposure time for that number rather than for the ƒ-number marked on the lens. The effective ƒ-number is found by multiplying the marked ƒ-number by the ratio of the image distance to the focal length, or

(Eq.2-1)
With lenses of normal design, the image distance is approximately the distance from the center of the lens to the film or sensor plane. (The procedure for determining the image distance with telephoto and other special lenses is covered in Chapter 4.) For example, if the image distance is 16 inches (406 mm) for a close-up photograph with a 4 × 5-inch view camera equipped with an 8-inch (203 mm) focal-length lens, the effective /-num-ber when the lens is set at ƒ/11 is ƒ/11 X 16/8 = ƒ/22. When an exposure meter reading is made, the exposure time for ƒ/22 would be used even though the lens is set at ƒ/11. There is a two-stop difference between ƒ/22 and ƒ/11; the exposure meter will indicate four times the uncorrected exposure time at ƒ/11 (see Figure 2-7).
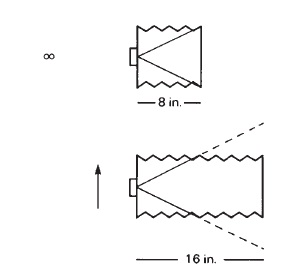
Figure 2-7 F-numbers are based on an image distance of one focal length (above). Doubling the image distance to photograph a close-up object produces an effective f-number that is double the marked f-number; that is, a lens set at f/8 acts as though it is set at f/16.
An alternative method for determining the exposure correction is to divide the image distance by the focal length and square the result. In the previous example, the exposure factor equals (16/8) or 4. The correction can be applied either by using the indicated exposure time and opening the diaphragm two stops from ƒ/11 to ƒ/5.6, or by multiplying the exposure time indicated for ƒ/11 by 4.
Lens Transmittance
A second shortcoming of f-numbers is they do not account for differences between lenses with respect to the amount of light lost because of absorption and reflection by the lens elements. No lens can transmit 100% of the light that strikes it. The introduction of anti-reflection coating for lenses has reduced variability between lenses caused by this factor, but in situations where accurate exposures are essential, an adjustment is appropriate. This is a major concern in television and cinematography where exposure latitudes are small. This problem can be greater for lenses with many elements, for example, an early zoom lens for 35-mm cameras was approximately three-quarters of a stop slower than indicated by the f-number because of the large number of elements, even though they were coated.
The T-number system of calibrating lenses based on the lens transmittance was devised as an alternative to the f-number. Two lenses may have the same f-number, indicating they are the same speed, but different T-numbers. This could be caused by differences in the number of lens elements and construction of the lens or to differences in lens coatings. Two lenses set at the same T-number will always produce the same image brightness under identical lighting conditions. As a simple example, if a lens marked ƒ/ 2 in the ƒ-num-ber system transmits only one-half the light that falls on the lens, it would be recalibrated as T/2.8. See Eq. 2-2 for an example. When an exposure meter reading is made, the exposure time is then selected for ƒ/2.8 rather than for ƒ/2, and the longer exposure time would exactly compensate for the loss of light caused by absorption and reflection. T-number is defined as the /-number of an ideal lens of 100% transmittance that would produce the same image illuminance on axis as the lens under test at the given aperture.

(Eq.2-2)
Exposure Time
Photographers can vary either of two factors to alter the exposure received by the film or other light-sensitive material, namely illuminance (ƒ-number) or time (shutter speed). In many picture-making situations, the photographer has a choice of any of a number of combinations of ƒ-numbers and shutter speeds, all of which will produce the same level of photographic exposure but with different depth-of-field and action-stopping characteristics.
Rule of thumb: The slowest safe shutter speed for handheld 35-mm cameras is 1/the focal length of the lens in millimeters—1/50th of a second for a 50-mm focal-length lens.
Photographers cannot always select a shutter speed based only on the exposure time that will produce the correct exposure. When photographing a rapidly moving object it may be necessary to use a very short exposure time to prevent unwanted blurring of the image, and occasionally a photographer will select a slow shutter speed to obtain a blurred image (see Figure 2-8).
Handholding cameras at slower shutter speeds often will produce an unsharp image, especially with long focal-length lenses. The rule of thumb is that it is unsafe to handhold a 35-mm camera with an exposure time longer than the reciprocal of the focal length of the lens in millimeters—for example, 1/50 second with a 50-mm lens and 1/500 second with a 500-mm lens. Many modern cameras now offer an image stabilization or anti-shake feature that helps to reduce image blur caused by camera motion. This may allow for the mentioned rule of thumb to be stretched another two stops in shutter speed, but it is still not a replacement for a tripod.
Lens Shutters
Most shutters fall into one of two categories: leaf or between-the-lens (or front) shutters and focal-plane (or back shutters. The ideal position for a lens shutter is between the elements close to the optical center, which is also the ideal position for the diaphragm. These shutters are commonly referred to as between-the-lens shutters.
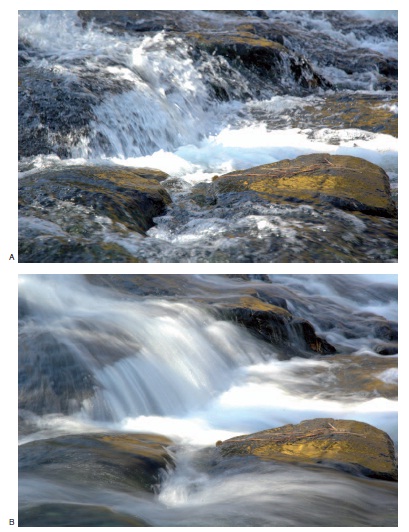
Figure 2-8 Image A was exposed at f/4.5 for 1/250 of a second to stop the action of the water. Image B was exposed at f/29 for two seconds to allow the motion of the water to blur. (Photographs by Professor Glenn C. Miller, Imaging and Photographic Technology, Rochester Institute of Technology.)
Effective Exposure Time
If a perfect shutter could be constructed, the blades would uncover the entire lens, or the entire diaphragm opening, simultaneously. A high-speed motion picture of the operation of a lens shutter shows the blades uncovering the center of the lens first and then gradually uncovering more and more of the lens. At the higher shutter speeds, the shutter blades no sooner uncover the outer edges of the lens than they again cover them at the beginning of the closing operation. The result is that the center of the lens is uncovered for a longer time than the edges, and the total amount of light that is supposed to be transmitted by a lens is actually transmitted only during the time that the diaphragm opening is completely uncovered by the shutter blades (see Figure 2-9). If a light meter is used to measure the change in the amount of light transmitted by a lens during the operation of the shutter, we would find that the reading would increase during the opening stage, remain constant while the shutter blades remained fully open, and decrease during the closing stage. Figure 2-10 shows the change of illuminance with time in the form of a graph.
The effective exposure time of a between-the-lens shutter increases as the diaphragm is stopped down.

Figure 2-9 On the right are the diaphragm openings for the whole stops on a typical lens. On the left are the positions of the shutter blades at which the diaphragm openings are just completely uncovered. Since the smaller openings are uncovered sooner and stay uncovered longer, the effective exposure time is longer than with a larger opening and the same shutter setting.
With focal plane shutters, stopping down has little effect on effective exposure time.
If lens manufacturers calibrated shutters from the time they start to open until they are completely closed again, the loss of light during the opening and closing parts of the cycle would lead to underexposure—in other words, the effective exposure time is shorter than the total exposure time. To avoid this underexposure problem, shutters are calibrated from the half-open position to the half-closed position with the diaphragm wide open, as illustrated in Figure 2-11. The loss of light during the opening and closing operations is compensated for by the fact that the total exposure time is longer than the time marked on the shutter.

Figure 2-10 The amount of light transmitted by a lens increases as the shutter blades open, remains constant as long as the diaphragm opening is completely uncovered, and decreases as the shutter blades close.

Figure 2-11 Shutters are calibrated from the half-open position to the half-closed position. The total exposure time is longer than the effective exposure time to compensate for the loss of light during the opening and closing stages of the cycle.
Unfortunately, when the diaphragm is stopped down, the smaller opening is uncovered sooner and remains completely uncovered longer. As a result, the half-open to half-closed time (which is the effective exposure time) increases as the diaphragm is stopped down, even though the shutter blades are opening and closing exactly the same as when the diaphragm was wide open (see Figure 2-12).
A distorted image may result when photographing rapidly moving objects with a focal-plane shutter camera.
Shutters that are calibrated with the diaphragm wide open, as is the practice, tend to overexpose images at small diaphragm openings because of the increase in the effective exposure time. The error is small at slow shutter speeds but approaches double the indicated exposure, or the equivalent of a one-stop error, at combinations of high shutter speeds and small diaphragm openings. Compensation for this error should be made by stopping down farther than an exposure meter reading indicates for the selected shutter speed, or by selecting the ƒ-number specified for the effective exposure time rather than the marked time. Table 2-1 indicates the correction needed for different combinations of shutter speeds and diaphragm openings.
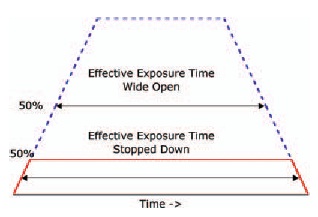
Figure 2-12 When a lens is stopped down, the smaller opening is uncovered sooner and remains uncovered longer, increasing the effective exposure time from half-open to halfclosed.
Focal-Plane Shutters
The basic design of the focal-plane shutter is a slit in opaque material placed close to the film or sensor that moves across the film from edge to edge. Exposure could be altered with early focal-plane shutters by selecting one of several slit widths in the shutter curtain and selecting one of a number of spring tensions that controlled the speed of the slit's movement. Rewinding the curtain before inserting the dark slide in the film holder resulted in fogged film. Modern focal-plane shutters have an adjustable opening between two curtains (or blades) with a self-capping feature to eliminate the slit when the curtain is rewound (see Figure 2-13).
There are several advantages of a focal-plane shutter. The first is that the shutter can be built into the camera and used with interchangeable lenses rather than placing a shutter in each lens, which reduces lens cost. A second advantage is that stopping a lens down has little effect on the effective exposure time with focal-plane shutters so that exposure compensation is not necessary.
Table 2-1 The correction needed for different combinations of shutter speeds and diaphragm openings


Figure 2-13 At slower shutter speeds, curtain 1, which protects the film from light before the shutter is tripped, completely uncovers the film before curtain 2 begins to cover it again. At higher shutter speeds, curtain 2 begins to cover the film before it is completely uncovered. The space between the two curtains decreases as the shutter speed increases.
Disadvantages of focal-plane shutters are: changes in speed of the slit across the film or sensor result in uneven exposure (see Figure 2-14), images of rapidly moving objects are distorted in shape, and it is more difficult to synchronize flash and electronic flash at higher shutter speeds (see Figure 2-15).

Figure 2-14 Cold weather caused this focal-plane shutter to malfunction, producing variations of exposure from side to side. (Photograph by Nanette L. Salvaggio.)

Figure 2-15 Electronic-flash illumination used with a focal-plane-shutter at shutter speeds of 1/60, 1/125, and 1/250 second (top to bottom). At the higher speeds the second curtain begins to cover the film before the first curtain has completely uncovered it. The highest shutter speeds that can be used with electronic flash have increased dramatically with newer single-lens-reflex cameras and flash units.
Electronic Shutters
For a typical mechanical between-the-lens shutter, the power to open and close the shutter is provided by a spring that is placed under tension, and the timing is controlled by a watch-type gear train. Early focal-plane shutters on sheet-film cameras provided the photographer with two controls over the exposure time: variable tension on the spring that controlled the movement rate of the focal-plane curtain, and a choice of various slit widths in the curtain.
Electronic shutters can be divided into two categories—those using electronics to control the timing with a spring-activated shutter (more properly called electromechanical shutters) and those using electronics for both the timing and the power to activate the shutter. Electronically controlled focal-plane shutters and between-the-lens shutters (on the mass-produced Polaroid Auto-100 camera) were introduced in 1963.
The timing of electronic shutters is typically controlled by a capacitor charged by a current from a battery, which can be altered with a variable resistor, causing the shutter to close when the capacitor is filled. By adding a camera exposure meter to the circuit, the exposure time is controlled automatically by the amount of light received by the meter photocell. Oneway electricity is used to open and close a shutter with solenoids, where a magnetic field produced by current flowing through a coil moves a plunger and the shutter. The liquid Kerr cell, used for scientific photography, is an electronic shutter that is capable of providing exposure times as short as one-billionth of a second (see Figure 2-16).
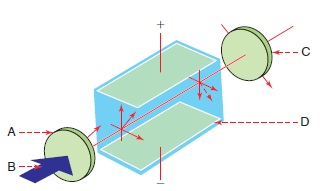
Figure 2-16 Electro-optical shutter (Kerr cell). (A) first polarizer; (B) light beam from subject; (C) second polarizer; (D) electrodes in the liquid cell. The liquid becomes birefringent on application of a high-voltage pulse to the electrodes.
It is possible for a shutter to be accurate at one speed setting, to overexpose at another setting, and to underexpose at a third setting.
Advanced design flash units that fire a burst of stroboscopic flashes can be used with some focal-plane cameras at their top speeds, such as 1/8,000 second.
The Kerr cell was invented by Rev. John Kerr in 1875.
Between-the-lens shutters are calibrated by the manufacturer at the maximum diaphragm opening.
Shutter Testing
If unsure of the correct exposure, bracket the assumed correct exposure.
The previous discussion concerning effective exposure times with between-the-lens shutters is based on a shutter that is accurately calibrated (at the maximum diaphragm opening) and in perfect working condition. Some shutter manufacturers have not guaranteed their shutters to be any more accurate than ±40% of the marked speed. In past years, it was possible to test 100 shutters selected at random representing various brands and periods of use without finding more than one or two that were accurate within ±5% at every setting. Shutters with electronic timing control tend to be more accurate than mechanical shutters, where the timing depends upon gear trains, springs and cams, but the accuracy of any shutter should not be taken for granted. Shutter variability for 140 35-mm single-lens reflex cameras is illustrated by the frequency histogram in Figure 2-17.

Figure 2-17 The shutters on 140 35-mm cameras were tested at a setting of 1/125 second. The range of variability is from 20% underexposure to 30% overexposure. The conversion data in Table 2-2 indicate that -20% and +30% are both equivalent to a 1/3-stop change in exposure, producing a range of 2/3 stop.
Figure 2-18 An electronic shutter tester that displays the shutter's operation as a trace on an oscilloscope.
Table 2-2 Conversion of percentage over- and underexposure to stops. This conversion table (see Figure 2-17) indicates that -20% and +30% are both equivalent to a 1/3-stop change in exposure
| Ratio | Log | Stops | |
| Over | Actual/Marked | Ratio | (Log/0.3) |
| 0% | 1.0 | 0.00 | 0.00 |
| 1 0% | 1.1 | 0.04 | 0.13 |
| 20% | 1.2 | 0.08 | 0.27 |
| 30% | 1.3 | 0.11 | 0.34 (1/3) |
| 40% | 1.4 | 0.15 | 0.50 (1/2) |
| 50% | 1.5 | 0.17 | 0.58 |
| 60% | 1.6 | 0.20 | 0.67 (2/3) |
| 70% | 1.7 | 0.23 | 0.77 |
| 80% | 1.8 | 0.25 | 0.85 |
| 90% | 1.9 | 0.28 | 0.93 |
| 100% | 2.0 | 0.30 | 1.00 (1) |
| 300% | 4.0 | 0.60 | 2.00 (2) |
| 700% | 8.0 | 0.90 | 3.00 (3) |
| Under | |||
| 0% | 1.0 | -0.00 | 0.00 |
| 1 0% | 0.9 | -0.046 | 0.15 |
| 20% | 0.8 | -0.097 | 0.32 (1/3) |
| 30% | 0.7 | -0.155 | 0.52 (1/2) |
| 40% | 0.6 | -0.222 | 0.74 (2/3) |
| 50% | 0.5 | - 0.301 | 1.00 (1) |
| 60% | 0.4 | -0.398 | 1.33 |
| 70% | 0.3 | -0.523 | 1 . 74 |
| 80% | 0.2 | -0.699 | 2.33 |
| 90% | 0.1 | -1.000 | 3.33 |
| 100% | 0.0 | - | - |
The most satisfactory method of testing a shutter for a film camera is with an electronic shutter tester that displays the shutter's opening and closing as a line on an oscilloscope where deviations from 100% accuracy can be determined from a calibrated grid, or where the effective exposure time is presented as a digital readout (see Figure 2-18).

Figure 2-19 The two shutter-tester traces reveal the change in the effective speed of a between-the-lens shutter at a shutter setting of 1/250 second with the diaphragm at the maximum aperture of f/4 (top) and stopped down to f/11.
Such instruments are capable of being very accurate because they can be calibrated with the 60-cycle alternating current with which they are normally used. Such testers can also be used to determine the change in the effective exposure time of between-the-lens shutters as the diaphragm is stopped down, and to check the consistency of focal-plane shutters across the film (see Figures 2-19 and 2-20). Shutter-speed settings that are found to be inaccurate can still be used by recording the test results and then using the appropriate ƒ-number for the actual shutter speed rather than for the marked speed.
In the absence of a shutter tester, a practical test can be conducted by exposing film in the camera at each setting provided certain precautions are taken. It is best to use reversal color film since it has a small exposure latitude that permits small changes in exposure to be detected. A subject having a normal range of tones should be used with front illumination. The exposure meter used should be tested against a standard light source or against a number of other meters or one meter of known accuracy, and care must be taken to make an accurate meter reading. With between-the-lens shutters the diaphragm must be wide open, but different shutter speeds can be tested by using neutral-density filters, adding 0.3 in density each time the exposure time is doubled. With focal-plane shutters it is safe to stop down the diaphragm one stop for each change of shutter speed. Finally, it is important to be sure the film is processed normally, and the transparencies should be viewed under standardized viewing conditions.

Figure 2-20 The three traces reveal the change in the effective speed of a focal-plane shutter at (from top) the right edge, center, and left edge of the film aperture. The shutter was set at 1/60 second, and the shutter traveled from right to left.
Camera Exposure Latitude
It is safer to overexpose than to underexpose—with negative-type films.
If we assume that for every photograph made there is a combination of ƒ-number and shutter speed that will produce the optimum level of exposure, photographers should know what will happen to the image quality if the level of exposure is either increased or decreased. It is unrealistic to believe that all the factors, such as film speed or sensor ISO rating, exposure meter, shutter, and ƒ-number that determine the “correct" exposure are calibrated to be 100% accurate and that no human error is involved in the process. For the purpose of this discussion, however, we will make the assumption that there are no such inaccuracies. The range over which the exposure can be increased and decreased from the “correct" exposure and still produce acceptable results is known as the exposure latitude.
Reversal films have much less exposure latitude than negative films.
As exposure is decreased from the optimum level, which is called underexposure, the darker areas or shadows of the scene will first lose contrast and then detail. If we continue to reduce the exposure, the detail will be lost in progressively lighter areas of the scene, and eventually there will be no image, even in the lightest areas or highlights of the scene (see Figure 2-21).

Figure 2-21 These images illustrate the influence of under- and overexposure on image quality. All prints were made of negatives from the same role of film, highlight densities were kept consistent through print exposure, and an effort was made to keep shadow densities consistent by modifying print contrast. Prints from the overexposed negatives show no negative effect on image quality. Prints from the underexposed negatives show a significant loss of image quality.
If we now take the process in the opposite direction and overexpose the images, the first noticeable change is commonly an increase in shadow contrast (and therefore an increase in overall contrast). Overexposure will also produce a decrease in image definition or, more specifically, an increase in graininess, a decrease in sharpness, and a decrease in detail. These changes may be apparent only with small-format images magnified considerably in printing. As the exposure continues to be increased, the image contrast will decrease, first in the highlight areas and then toward progressively darker areas of the scene. Seldom is all detail lost with overexposure of negative-type films, although extreme overexposure can result in a partial or complete reversal of tones known as solarization.
When dealing with black-and-white negative films, overall changes in contrast caused by underexposure or overexposure can be compensated for at the printing stage, but local loss of contrast and detail are not correctable. The effects of underexposure (loss of shadow contrast and detail) occur more quickly and are more severe than the effect of overexposure (modest change in contrast and decrease of definition), leading to the long-standing belief that “It is safer to overexpose than to underexpose” (see Figure 2-22). Stated in terms of exposure latitude, there is more exposure latitude on the overexposure side than on the underexposure side. These statements apply to conventional black-and-white and color negative films.
With reversal-type films the exposure latitude is small in both directions, especially when the slide, transparency, or motion-picture film exposed in the camera is the final image to be viewed—often juxtaposed spatially or temporally with other images, making relatively small density differences apparent. Changes of ±1/2 stop in exposure are commonly considered to be the maximum tolerable, with the possible exception of images that are viewed in isolation (as in an otherwise darkened room), viewed in comparison to other images equally underexposed or overexposed, or are to be reproduced photographically or photomechanically. Compensation in reproducing slides and transparencies is generally more successful when they are slightly dark (underexposed) than when they are too light, but this depends to some extent on the relative importance of highlight and shadow detail in each photograph. Because reversal color films have so little exposure latitude, they are especially useful for testing exposure systems.
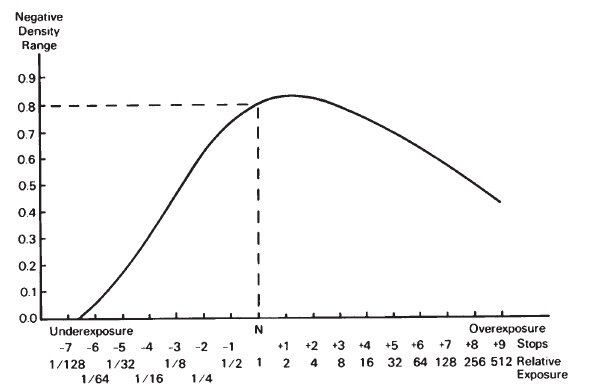
Figure 2-22 The effects of underexposure and overexposure on negative contrast are shown in this curve. Contrast decreases rapidly with underexposure. Overexposure first produces an increase in contrast before it declines at a more gradual rate.
Exposure latitude with digital sensors is more difficult to pin down. In general, digital cameras are thought to have a slightly less exposure latitude than print film does, but there are some advantages that you gain in the digital realm. Most digital cameras allow you to view the image histogram. This provides instant feedback about the exposure, thus allowing the photographer to correct any errors instantly. Bracketing the exposure is also a very viable option here. Large memory cards for cameras do not limit the user to the same number of images that can be taken as a roll of film can. Poor exposures can simply be erased. Additionally the ability to save an image in RAW format allows the photographer to “pull" information out of blocked-up shadows in software later, an option that is not possible with film. However, there is less overexposure latitude in digital cameras. Digital sensors tend to have a sharp cut-off in sensitivity at the high end of the response. Figure 2-23 provides a comparison of the exposure latitude for film and digital cameras.

Figure 2-23 Exposure latitude for film and digital. Negative films have the greatest latitude, being greater for overexposure than for underexposure.
Alternatives to Exposure Meters
Many photographers, both professional and amateur, consider exposure meters to be as indispensable to photography as cameras, but there are other methods for determining the correct camera-exposure settings. Even trial-and-error can be used appropriately if lighting conditions are remaining constant and will be encountered again.
One of the most constant of lighting conditions is direct sunlight between the mid-morning to mid-afternoon hours. A widely used rule in this situation is the correct exposure is obtained by using a shutter speed equal to the reciprocal of the ISO speed of the film at a relative aperture of ƒ/16. For example, with of ISO 125/22° a camera exposure of 1/125 second at ƒ/16 would most likely produce good results. Data sheets provided for film include exposure information for other outdoor lighting conditions including hazy sun, light overcast, and heavy overcast. Exposure tables also have been used successfully for tungsten lamps, flashlamps, and electronic flash units where the lamp output and lamp-to-subject distance are constant or are measurable.
One of the most ambitious projects to provide exposure information for a variety of natural lighting conditions is the American National Standard Photographic Exposure Guide, ANSI PH2.7-1986. The exposure data for daylight are based on the latitude, time of day, sky conditions, subject classification, and direction of the lighting. Also included are data for aerial photography, underwater photography, photography by moonlight, and photographs of sunsets, rainbows, lightning, lunar and solar eclipses, and the aurora borealis. Certain artificial lighting conditions are also covered, including fireworks and television screens.
Exposure Meters
In the past, many different types of light-measuring devices or exposure meters have been used, but nearly all contemporary exposure meters are photoelectric.
Rule of thumb for exposing film outdoors in sunlight: Shutter speed at f/16 = 1/film speed.
Ideally, the spectral sensitivity of exposure-meter cells would closely resemble the spectral sensitivity of typical panchromatic films or modern digital sensors, but unfortunately none of them does. The curves in Figure 2-24 show the spectral sensitivity of selenium, cadmium sulfide, silicon, and silicon-blue cells. Variations of spectral sensitivity will be found among cells of the same type because of manufacturing controls, including the use of filters over the cells; and minor variations are even found among meters of the same brand and model because of the variability inherent in all manufacturing processes.
Taking exposure meter readings through filters can lead to exposure errors caused by differences in the spectral sensitivity of the meter and the film.
Blue filters, as used in silicon-blue meters, can compensate for the cells' inherently low blue sensitivity.

Figure 2-24 Relative spectral response functions for some common detector materials: selenium, cadmium sulfide, silicon, and gallium arsenide phosphide.
However, full correction is not an attractive option, since the filter simply absorbs the colors of light to which the cells are more sensitive, thereby reducing overall sensitivity. Silicon cells, which were introduced in the 1970s, share the high sensitivity of cadmium sulfide cells without the disadvantage of memory. Meter manufacturers are continuing to develop new types of photoelectric cells, such as silicon photodiode and gallium arsenide phosphide photodiode, in an effort to achieve further improvements in performance.
High red sensitivity and low blue sensitivity of a meter cell, compared to the sensitivity of panchromatic film, can cause a difference in density of negatives exposed outdoors and indoors because of the difference in the color temperature of the light sources. To further complicate this matter, film may not have exactly the same speed with the two types of illumination even though only a single speed is published or set for both. The greatest danger of incorrect exposure stemming from poor spectral response, however, occurs when reflected-light meter readings are taken from strongly colored subject areas and when color filters are used over the camera lens with behind-lens meters. With a meter having high red sensitivity, metering through a red filter would lead to underexposure of the film (see Figure 2-25).
A typical angle of acceptance for general-purpose exposure meters is 30 degrees. Some spot meters have an angle of acceptance as small as 1 degree.
Reflected-Light/ Incident-Light Exposure Meters
Strictly speaking, all exposure meters can measure only one thing—the light that falls on the photoelectric cell. By adjusting the angle over which the cell receives light, and by using neu-tral-density filters that transmit only a desired proportion of the light (or by incorporating a corresponding adjustment in the calibration system), it is possible for the photographer to obtain correct exposure information (a) when the cell is aimed at the subject as a reflected-light meter; (b) when the cell is placed near the subject and aimed at the camera as an incident-light meter; and (c) when the cell is placed behind the lens in a camera where it receives a sample of the image-forming light that falls on or is reflected by the film or sensor.
Another name for a reflected-light exposure meter is a luminance meter.
Reflected-light exposure meters are calibrated to produce the correct exposure when the reading is taken from a medium-tone area. An 18%-reflectance gray card is widely used as an artificial or substitute midtone. Some hand-held reflected-light meters have acceptance angles that are approximately the same as the angle of view of a camera equipped with a normal focal-length lens, which is approximately 53°, although 30° is more typical. The acceptance angle of reflected-light exposure meters is defined as the angle where the response is one-half the on-axis response.*
When a reflected-light meter is aimed at a scene from the camera position, it integrates the light from the scene's various parts and gives an average reading. Such a reading will produce the correct exposure only with scenes that have a balance of light and dark tones around an appropriate midtone. The meter can be moved closer to the subject to make a reading from a single subject area or from a substitute midtone area, such as an 18% gray card. An alternative is to limit the angle of acceptance so a smaller subject area can be measured from the camera position. Spot attachments are available for some reflected-light meters, and some meters are designed as spot meters with angles of acceptance as small as 1° (see Figure 2-26). Fiber-optic probes are also offered as accessories for some meters, permitting readings to be made from very small areas.
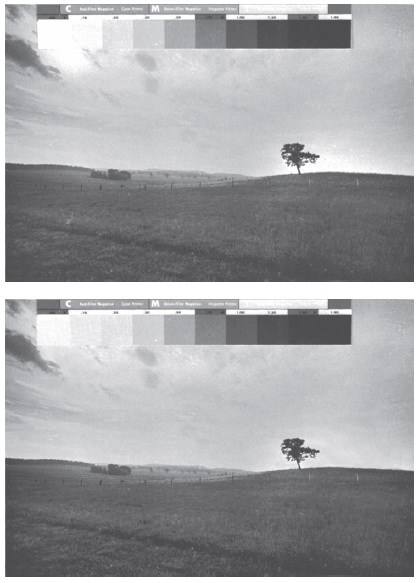
Figure 2-25 Copy photographs of a black-and-white print and gray scale, exposed according to a through-the-lens exposure meter. The top photograph, made with no filter, is correctly exposed. The bottom photograph, made through a red filter, is underexposed because of the high red sensitivity of the cadmium sulfide cell, which produced a false high reading.
A more appropriate description of a reflected-light exposure meter is luminance meter, since such meters are used to measure more than just reflected light such as light transmitted by transparent and translucent objects (such as stained-glass windows) and light emitted by objects (such as night advertising signs and molten metal). Also, some persons prefer to use the term light meter rather than exposure meter, but the terms reflected-light meter and exposure meter have become entrenched in the photographic vocabulary through common usage. Actually, since the spectral response curves of exposure meters do not (and should not) match the spectral response curve of the standard observer, the meters do not truly measure light.
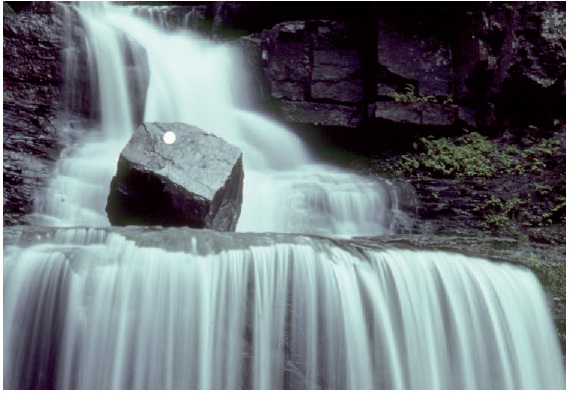
Figure 2-26 The white circle on the post on the right represents the approximate area measured with a 1° spot meter on a photograph made with a normal focal length lens where the angle of view is approximately 53°. (Photograph by (Professor Stephen J. Diehl, Imaging and Photographic Technology, Rochester Institute of Technology.)
Behind-lens meters also can be designed either to integrate the light over a large angle to provide an average reading, or to measure the light from smaller areas. Some cameras have center-weighted meter systems, others measure off-center areas. A newer type of metering called evaluative metering is available in most brands of digital SLR cameras, although every manufacturer has a unique name for it. This type of metering will break the scene up into zones and used built in software to analyze the scene and provide an appropriate reading (see Figure 2-27).
If a hand exposure meter is to be used for both reflected-light and incident-light readings, an adjustment must be made when the meter is turned around so that the cell is receiving the higher level of light falling on the subject rather than just the 18% that is reflected from a typical scene. Dividing 100% by 18% produces a ratio of approximately 5.6:1. Therefore, a neutral-density filter that transmits 1/5.6th of the light, placed over the cell, would convert the reflected-light meter to an incident-light meter that would produce the same exposure with a subject that reflects 18% of the incident light (see Figure 2-28). This is typically done with a white translucent dome that is placed over the meter sensor when taking incident readings.

Figure 2-27 The three most popular distributions of exposure-meter sensitivity within the picture area in 35-mm single-lens reflex cameras are averaging (top), spot (middle), and center-weighted (bottom).
It is appropriate to use a flat receptor on incident-light meters that are to be used for photographic copying, so that the illuminance will vary on the meter cell and the flat original exactly the same when the direction of the lighting changes. Such a meter is identified as a cosine-corrected meter because the cosine law of illumination states that illuminance changes in proportion to the trigonometric cosine of the angle between the light path and a perpendicular to the surface. Copying lights are typically placed at an angle of 45° on both sides of the stand rather than near the camera, to avoid glare reflections. The cosine of 45° is approximately 0.7, which means the illuminance on the original and the cosine-corrected meter cell will be only 0.7 what it would be if the lights were placed directly in front of the original on the lens axis at the same distance (see Figure 2-29).
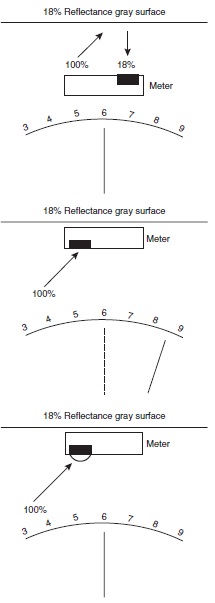
Figure 2-28 Conversion of a reflected-light exposure meter to an incident-light exposure meter. (Top) A reflected-light exposure meter measures 18% of the incident light reflected from a subject of average reflectance. (Middle) A reflected-light exposure meter used as an incident-light exposure meter, without modification, measures 100% of the incident light and produces a false high reading. (Bottom) Adding a diffuser that transmits 18% of the incident light produces the same correct reading as that obtained with the reflected-light exposure meter.

Figure 2-29 The cosine law of illumination (A) the illuminance for light falling on a flat surface varies with the cosine angle of incidence, the relationship represented by the solid curve. The dashed line indicates the relative illuminance for 45° copy lighting. (B) Both flat (cosine-corrected) and hemispherical diffusers are provided with this exposure meter.
Some general-purpose exposure meters provide a flat diffuser to place over the cell that transmits the proportion of light needed to convert the meter to an incident-light meter, as well as to provide cosine-corrected readings for copying purposes. Since the cosine of 90° is zero, flat receptors could not be used with sidelit and backlit three-dimensional subjects and scenes with the meter aimed at the camera. Such a meter could be aimed at the key light provided that a suitable adjustment is made, with a calculator dial, for example, to compensate for the change in effectiveness of the illumination, from 100% for front lighting to 50% for 90° side lighting to 0% for 180° back lighting.
Flat diffusers are recommended for incident-light exposure meters for copying work, and hemispherical diffusers are recommended for photographing three-dimensional subjects.
In 1940, however, Don Norwood introduced a more satisfactory solution— an incident-light exposure meter with a hemispherical diffuser over the cell that automatically compensated for changes in the direction of the key light with the meter aimed at the camera.3 The Norwood exposure meter operated on the principle that as the key light was moved toward the side from *a front-lighted position, it illuminated less and less of the hemispherical diffuser, producing proportionally lower readings. With 90° side lighting, for example, the key light illuminated half the diffuser, and the illuminance reading was 50% of the front-lighted reading—the equivalent of a one-stop change in the camera exposure settings (see Figure 2-30). Today almost all meter manufacturers have adopted the hemispherical diffuser for incident-light exposure meters intended for use with three-dimensional subjects and scenes.
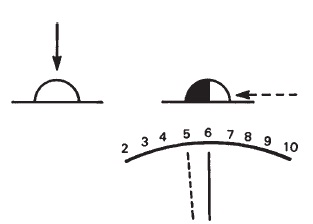
Figure 2-30 Front lighting and 90° side lighting of a hemispherical diffuser, resulting in a one-stop decrease in the meter reading.
With some, however, care must be taken in positioning the meter so that the meter body does not shield the diffuser from the key light in backlit situations.
Meter Scales
Early photoelectric exposure meters were commonly calibrated in photometric units, such as footcandles for illuminance and candelas per square foot for luminance readings, or in numbers that represented relative photometric units. The numbers on these meters formed ratio scales such as 1-2-4-8-16, etc., so that each higher number represented a doubling of the light, or the equivalent of a one-stop change (see Figure 2-31). Some other types of markings have been used, including ƒ-numbers that correspond to whole-stop changes, but most contemporary meters with calibrated scales use a simple interval series of numbers such as 1-2-3-4-5-6, etc., where each higher number again represents a doubling of the light, or a one-stop change (see Figure 2-32).
If the numbers on a meter interval scale are light values in the additive system of photographic exposure (APEX), then the relationship of the four factors involved in camera exposure—ƒ-number, exposure time, scene illuminance, and film speed—is expressed as:

Figure 2-31 The numbers on this meter dial are proportional to the amount of light falling on the cell. Since each number is double the next lower number, the numbers form a ratio scale.

Figure 2-32 Even though the numbers on this meter dial form an interval scale with equal increments of 1, each number represents double the amount of light of the next lower number.

An average outdoor scene has a luminance ratio of approximately 128:1, or a luminance range of approximately seven stops.
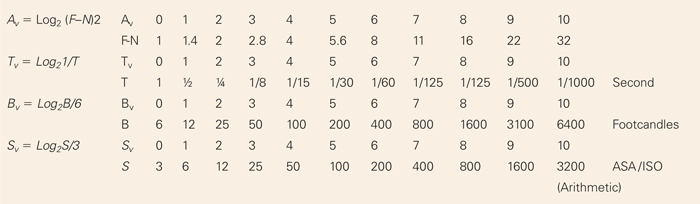
For example with a meter reading light value of 5 (30 foot-lamberts) and a film speed value of 5 (ISO 100) the exposure value is 5 + 5 or 10. Therefore, any combination of aperture and time values that adds up to 10 can be used, such as an aperture value of 3 (f/2.8) and a time value of 7 (1/125 second). The values for other f-numbers, exposure times, film speeds, and scene illuminance readings are given in Table 2-3. Most interval-scale meters use an arbitrary set of numbers beginning with 1 for the lowest mark on the scale rather than using APEX light-value numbers, but some do include exposure value (Ev) numbers—a combination of light values (Lv) and film-speed values (Sv)—on the calculator dial or elsewhere.
The f/16 rule can be used as one check on the accuracy of an exposure meter. A meter also can be checked against other meters with a standard light source.
Light Ratios
Because exposure meter readings are commonly used to determine lighting ratios and scene luminance ranges or ratios, it is important to understand the difference between ratio (1-2-4-8) scales and interval (1-2-3-4) scales on meters and to be able to use either. With a ratio-scale meter, the scene luminance ratio can be determined by taking reflected-light readings from the highlight and shadow areas and dividing the larger number by the smaller. For example, 256 (highlight) divided by 2 (shadow) is 128, or a luminance ratio of 128:1. Similarly, the lighting ratio for a studio portrait can be determined by taking an incident-light or a reflected-light reading for the key or main light plus the fill light and a second reading for the fill light alone, so that readings of 60 and 15, for example, represent a 4:1 lighting ratio. A comparison of shadow and highlight reflected-light readings is shown below for the two types of scales:

There are several methods for determining the lighting ratios. The 128:1 luminance ratio scene on the ratio scale can most be expressed as a 7-stop (9 - 2) scene on the interval scale. Seven stops can be converted to a 128:1 ratio by raising 2 to the seventh power, 27 (i.e., 2 X 2 X 2 X 2 X 2 X 2 X 2) = 128. (Using logarithms, 7 X log 2 = 7 X 0.3 = 2.1, and the antilog of 2.1 is approximately 128.)
Table 2-3 Conversion formulas and data for the aperture value, time value, light value, and speed value in the additive system of photographic exposure (APEX)
Meter Accuracy and Testing
Variability tells us that we cannot assume all exposure meters are accurate, even when they are new. We know variability affects all aspects of the photographic process, including different exposure meters produced by the same manufacturer that are supposed to be identical. The issue is whether the variability is small enough so that it can be ignored or whether some compensation should be made. How much error should be tolerated in an exposure meter is not an easy question to answer. In any event, photographers commonly test their new meters against other meters of known performance, and professional photographers usually feel insecure unless they have more than one meter in their possession at all times.
Calibrated light sources are available for testing exposure meters and other light meters, but their high cost usually keeps individual photographers from owning one, although they are used by manufacturers and testing laboratories. Sunlight can be used as a standard light source, however factors that can affect the illuminance, such as time of day and sky conditions must be accounted for. If you only want to make a comparison between exposure meters, for example a new meter and one of known performance, a light source only needs to be constant and does not need to be calibrated. A transparency illuminator works quite well for comparing exposure meters. The meter should be placed against the center of the illuminator, which will eliminate variability because of differences in angle of acceptance, distance from the light source, and shadows of the meters (see Figure 2-33).
The frequency histogram in Figure 2-34 shows the result of a comparison of approximately 200 new and used exposure meters of various brands. All meters were set at the same ISO, and the indicated exposure times for a relative aperture of f/16 were recorded. The total range of exposure times corresponds to a ratio of approximately 16:1 or four stops. Ninety percent of the readings fell within a 2:1 ratio, or a one-stop range. Since all of the meters that had zero settings were properly zeroed, the only method of compensating automatically for consistently high or consistently low readings is to make an adjustment in the ISO setting. Thus if a meter reads one stop too high, it should be set for one-half the published ISO speed.
An alternative method for testing an exposure meter is to capture an image at the settings indicated by the meter. Additional images are taken by bracketing the original indicated exposure by 1/3 or 1/2 stops which both overexposes and underexposes the image. The photographer would then determine which image had the best exposure and compensate the meter readings accordingly. Photographers sometime refer to this testing process as deriving a personalized exposure index. There are many factors that can affect these results such as shutter accuracy and efficiency, flare, lens transmittance, color temperature of the light source and if using film development and reciprocity law failure. Because of this the photographer should not rely on a single set of images to determine meter accuracy.

Figure 2-33 A transparency illuminator being used as a standard light source to check the calibration of an exposure meter.
Reflected-light exposure meters are calibrated for midtone readings.
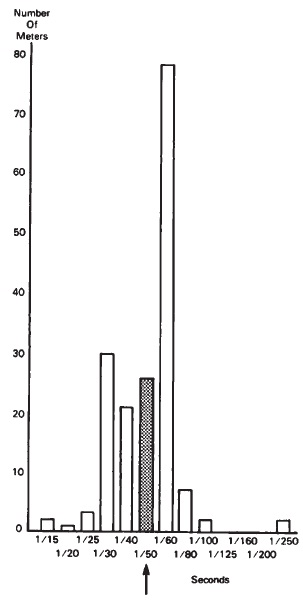
Figure 2-34 Frequency histogram showing the results of the testing of approximately 200 exposure meters on a standard light source. Although the variability represents a range of four stops, 90% of the meters fell within a one-stop range.
Compensation can be made for an exposure meter that reads consistently high or low by adjusting the ISO setting.
Methods of Using Reflected-Light Exposure Meters
Not only do photographers have a choice between reflected-light and incident-light exposure-meter readings, but they also have a choice of various types of reflected-light readings. The types of reflected-light readings that will be considered here are midtone, Keytone and Zone System, calculated midtone, camera position, and behind-lens camera meter readings.
Midtone Readings
Film speeds for conventional black-and-white films are based on a point on the toe of the characteristic curve where the density is 0.1 above base-plus-fog density, which corresponds to the darkest area in a scene where detail is desired. Exposure-meter manufacturers, on the other hand, calibrate the exposure meter to produce the best results when reflected-light readings are taken from midtone areas. Meter users who are not happy with this arrangement can make an exposure adjustment (or, in effect, recalibrate the meter) so that the correct exposure is obtained when the reflected-light reading is taken from the darkest area of the scene—or the lightest area, or any area between these two extremes. This type of control is part of the Keytone method and the Zone System.
Reflected-light meters are calibrated for midtone readings, therefore any area used for a reflected-light reading will be reproduced as a midtone, even if the area is the lightest or darkest area in the scene, if no adjustment is made. For example, if a reflected-light reading is taken from a white subject, this will cause the white subject to be recorded as a medium-tone, which is considerably darker than it would be if it were correctly exposed. If we were using film, the negative will be underexposed. In terms of the film characteristic curve, all of the tones will be moved to the left on the log exposure axis, causing the midtone of the scene to move from the straight line down onto the toe, and the shadows to move from the toe onto the base-plus-fog part of the curve where detail will be lost. In a digital system this would cause the image brightness histogram to shift to the left causing shadow information to be clipped to zero.
A typical white surface reflects about 90% of the incident light, which is five times as much as is reflected from an 18%-reflectance gray card, so that taking the reading from a white area causes an underexposure by a factor of five, or a little more than two stops. With the negative-positive process this underexposed negative still can be printed so that the white area from which the reading was taken appears white; but the loss of contrast, and especially the loss of detail in the darker areas, cannot be fully corrected. With reversal color films where the slide or transparency is the end product, and with instant or one-step picture materials that produce prints directly, taking a reflected-light reading from a white area again reproduces that area as a medium tone—which now is denser than it would be with normal exposure. Since such reversal materials have little exposure latitude, they are especially useful for demonstrating the differences in results of the various methods of using exposure meters.
The photographs in Figure 2-35 illustrate the results when reflected-light readings are taken from a midtone area, a light area, and a dark area. Note that the areas from which the readings were taken are all reproduced as the same medium density but that the overall effect is satisfactory only when the reading was taken from the midtone area.
One of the problems with the midtone reflected-light method is the difficulty of selecting an appropriate medium-tone area to take the reading. If we think in terms of a copying situation in which the subject tones range from white to black, as in a gray scale, a gray that appears to be midway between white and black will have a reflectance of about 18%, or a density of about 0.74 (see Figure 2-36).

Figure 2-35 Reflected-light exposure meter readings. (Left) The black-and-white plaster cats correspond in reflectance to the two ends of a gray scale; the gray cat represents a midtone. A reflected-light meter reading from the gray cat reproduces it as a realistic medium gray and produces the best exposure for the entire scene. In the original Polaroid print, there is tonal separation of all ten steps in the gray scale and detail in the front planes of all three cats—although not in the shadow underside of the black cat or the rim-lighted top edge of the white cat. (Middle) A reflected-light reading from the white cat results in its being reproduced as a medium gray rather than white, and the photograph as a whole is underexposed. (Right) A reflected-light reading from the black cat results in its being reproduced as a medium gray rather than black, and the photograph as a whole is overexposed.
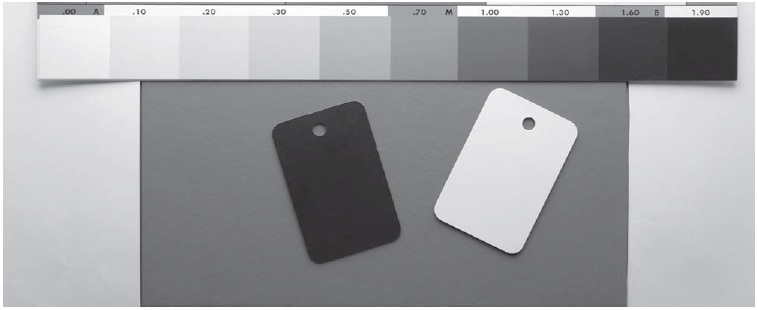
Figure 2-36 A gray surface with a reflectance of 18%, or a reflection density of about 0.74, is perceived as being midway between white and black in lightness and serves as an appropriate photographic midtone.
Taking a reflected-light meter reading from a light area, without adjustment, results in underexposure.
Since the photographic midtone agrees with the visual midtone, it is appropriate to use an 18%-reflectance gray card as an artificial midtone— such neutral test cards are made for this purpose. In copying situations, the neutral test card should be positioned parallel to the original so that the change in illuminance with the angle of the light, as specified by the cosine law of illumination, is the same on the original and the test card.
Detail can be obtained in a shadow area by taking a reflected-light reading in that area and decreasing the indicated exposure by four stops.
A neutral test card can be used as an artificial midtone with three-dimensional subjects as well, provided the card is now aimed midway between the camera and the dominant light source rather than directly at the camera (see Figure 2-37). Neutral test cards have a fairly dull surface, however care must be used when taking reflected-light meter readings so that the angle of the meter avoids glare reflections from the light source. The meter should be positioned close enough to the card to avoid including any areas behind the card in the reading, but not so close as to cast a shadow onto the card. Spot attachments or spot meters make it possible to obtain accurate readings at a greater distance than with conventional reflected-light meter to avoid this problem.

Figure 2-37 In copying setups, the gray card should be positioned parallel to the original. With three-dimensional subjects the gray card should be angled midway between the main light and the camera.
Keytone and Zone System Readings
White-card film speeds were commonly provided on film data sheets in addition to the conventional film speeds in past years, and are still provided for some films designed especially for copying. Since a typical white surface reflects about 90% of the light, or five times as much as the 18%-reflectance neutral test card, the white-card film speed would be only one-fifth the gray-card film speed with arithmetic film speeds.
Reasons for using a white-card exposure meter reading in preference to a gray-card reading are that white surfaces are more readily available than 18%-reflectance gray surfaces, and in low light levels it might be possible to obtain a white-card reading when an exposure meter is not sufficiently sensitive to obtain a reading from a gray card. An alternative to changing the ISO setting on the exposure meter for white-card readings is to place a marker in the appropriate position on the meter calculator dial and then set that marker rather than the normal marker opposite the meter reading.
When it is especially important to retain shadow detail in a photograph, the Keytone method can be used whereby a reflected-light meter reading is taken from the shadow area and an appropriate mark is made on the calculator dial opposite that reading. (If no adjustment were made, the shadow area would be reproduced as a medium tone, and the negative overall would be much too dense.) The original Weston exposure meter had a U-position or shadow marker four stops below the normal arrow. The same effect can be obtained with any reflected-light exposure meter by reading the shadow area and then giving the film one-sixteenth the exposure or four stops less exposure than that indicated by the normal marker.
A logical extension of the Keytone method, beyond calibrating the calculator dial for white-card or highlight readings and for shadow readings, is to calibrate it for each stop between these limits. Such a calibration is an important part of the Zone System, whereby eight neutral patches with increasing densities from white to black are associated with the seven-stop range on the meter dial that represents a normal scene having a luminance ratio of about 1:128. The lightest and darkest patches represent the useful density range of the printing paper, and each patch indicates the predicted density on the print for the corresponding luminance value in the scene.
The photographer, however, is not limited to striving for a faithful tone reproduction with Keytone and Zone System readings. If, for example, the photographer wants to depict snow somewhat darker than normal to emphasize the texture, the patch having the desired density is placed opposite the meter reading from the snow. This procedure is especially useful when using color transparency film in which the transparency is the end product, and therefore printing controls are not available (see Figure 2-38).

Figure 2-38 Silhouettes and semi-silhouettes are dramatic examples of situations in which facsimile tone reproduction is not the objective, as with this photograph of white golf balls. With the Zone System, the photographer can determine the reproduction tone for a given subject area at the time the film is exposed.
Adjusting film development to compensate for high-contrast and low-contrast scenes is also an important feature of the Zone System.
Calculated Midtone Readings
In practice, it is often difficult to visually scan a scene and subjectively select an appropriate midtone area to take a reflected-light exposure meter reading. The scene may contain light and dark tones but no midtones, and even if there is an appropriate midtone area, it may be difficult to identify because of the influence of the colors of objects, an imbalance in the size of light and dark areas, local brightness adaptation of the visual system, and other factors. An objective method for locating a midtone reading is to take separate readings from the lightest and darkest areas where detail is desired and to select a middle value.
Calculated midtone reflected-light exposure meter readings can be obtained by averaging highlight and shadow readings.
Some care is necessary because the middle value is not an arithmetic average of the highlight and shadow luminances. The scales on most hand meters are set up so that each higher major marking and number represents a doubling of the luminance, or the equivalent of a one-stop change. If the meter has an interval scale of numbers (1-2-3-4-5-6-7), and if the shadow reading is 1 and the highlight reading is 7, the calculated midtone value is the middle number, 4. With such interval scales, the same midtone value is obtained by adding the highlight and shadow values and dividing by 2—for example,

If the meter has a ratio scale of numbers (1-2-4-8-16-32-64), and the shadow reading is 1 and the highlight reading 64, the calculated midtone value is again the middle number, in this example 8. Calculating the midtone value by averaging the shadow and highlight readings with the ratio scale will result in a large error since the average of 1 and 64 is 32.5, not 8.
No change in procedure is required for hand meters or behind-lens meters that read directly in ƒ-numbers (for a given shutter speed) or in shutter speeds (for a given ƒ-number), since both scales are ratio. A correct midtone value is obtained by taking a shadow reading and a highlight reading and selecting the middle number on the ƒ-number or shutter-speed scale (see Figure 2-39).
A bonus of the calculated-midtone method is that by taking readings in the darkest and lightest areas where detail is desired, it is easy to determine whether or not the scene is normal in contrast. The original Weston exposure meter had shadow and highlight markings on the calculator dial to indicate that the luminance ratio for an average scene is 1:128 (or a luminance range of seven stops or seven zones). Later studies suggested a slightly higher ratio of 1:160, which still rounds off to seven stops in terms of whole stops.
Figure 2-39 The calculated midtone is found with a shutter-priority system (left) by noting the f-number that is midway between the f-numbers indicated for a shadow reading and a highlight reading. With an aperture-priority system (right) the shutter speed midway between the indicated speeds for shadow and highlight readings is selected.
Various options are open to the photographer if, for example, a scene is discovered to have considerably more contrast than the average scene:
- By adjusting the exposure, detail can be retained in either the highlights or the shadows by sacrificing detail in the other areas.
- In some situations, it is possible to reduce the luminance ratio with a fill light or a reflector; in this case, the midtone value should be recalculated.
- For negative films, contrast can be lowered by reducing the development time so that the negative will print on normal-contrast paper. Since the effective film speed varies with the degree of development, it is necessary to make an adjustment in the film speed or the exposure.
- Since conventional negative-type films have more exposure latitude than required for an average scene, the contrast adjustment can be postponed to the printing stage. The excess latitude is mostly on the overexposed side, however, so an exposure adjustment may be required to retain shadow detail.
- With reversal-type color films, contrast can be reduced with controlled flashing. Some slide copiers are designed to provide this option. The same effect can be achieved with any camera by giving the film a second exposure, using an out-of-focus image of a gray card and an appropriate reduction of the exposure.
Other terms applied to exposure methods that are similar or identical in concept to the calculated-midtone method are brightness-range, luminance-range, luminance-ratio, and log luminance-range.
Camera-Position Readings
The camera-position or integrated-light metering method consists of aiming a reflected-light exposure meter at the scene from the camera position. Assuming that the meter's angle of acceptance is about the same as the angle of view of the camera-lens combination, the meter provides a single reading that represents an average of all the luminances of the different subject areas being included in the photograph. Correct exposures should result with scenes that are well balanced with respect to light and dark areas. Scenes in which light areas are dominant produce false high readings, which lead to underexposure. Scenes in which dark tones prevail produce false low readings and overexposure (see Figure 2-40).
The success of camera-position reflected-light readings depends upon a reasonable balance of light and dark tones in the scene being photographed.
A large proportion of photographs made using this method are satisfactory because most of the scenes photographed are reasonably well balanced in light and dark areas or because of the exposure latitude of the film or sensor. It is not difficult to recognize scenes that deviate dramatically from a balance of light and dark areas, where corrective action should be taken. Also, exposure-meter instruction manuals usually caution the user to tilt the meter downward to avoid including bright sky areas in outdoor meter readings.
Scenes in which light areas dominate produce false high readings, which lead to underexposure. Scenes in which dark tones prevail produce false low readings and overexposure.
Camera Meters
No compensation is required for the increased lens-to-film distance for close-ups with behind-lens exposure meters
Although selenium-cell photovoltaic-type exposure meters have been built into small-format cameras, the introduction of the more sensitive cadmium sulfide cell and other meters of the photoconductive type made it possible to reduce the cells to a more appropriate size. With the development of small

Figure 2-40 Camera-position reflected-light readings. (Top left) Camera-position reflected-light exposure meter readings produce the best results with scenes that are balanced in light and dark tones. (Photograph by Derrick Clark.) (Bottom) Predominately light scenes produce inflated meter readings, which produce underexposure. (Photograph by Derrick Clark.) (Top right) Dark scenes produce false low readings, which produce overexposure. (Photograph by David Filiberti.) (David and Derrick are both Advertising Photography students, Rochester Institute of Technology.)
cells, camera meters were moved from being mounted on the front surface of the camera to behind the lens of the camera. Meters with surface-mounted cells perform in a manner similar to that of a reflected-light hand meter, that is, aimed at the subject from the camera position to make an integrated-light reading.
Considering only small-format cameras, behind-lens meters are better suited to focal-plane shutter cameras than to cameras having between-the-lens shutters that are open only when the film is being exposed. There has been considerable experimentation with the location, size, and shape of the behind-lens cell or cells. Cells have been placed in various positions on the prism of single-lens-reflex cameras, on the mirror, behind the mirror, and off to one side where the cells receive and measure light reflected from a mirror or beam splitter, the shutter curtain, or even the film itself (see Figure 2-41).
Many technical problems had to be solved with behind-lens meters, such as preventing light that enters the viewfinder from behind the camera from reaching the cell, preventing polarization of the image light being measured (which would give inaccurate readings when a polarizing filter is placed on the camera lens), and compensating for the change in the size of the diaphragm opening between the time the light is measured and when the exposure is made. There are also many variations concerning the size, shape, and location of the picture area being measured, including integrated, center-weighted, off-center weighted, spot, and multiple cells.
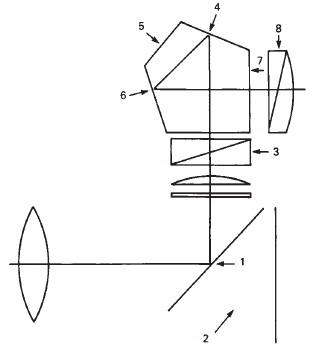
Figure 2-41 A variety of positions have been used for the exposure-meter cell in single-lens reflex cameras by different manufacturers. 1.Behind the mirror. Measures direct light from the lens through clear lines or partially transmitting mirror. 2.Behind the mirror. Measures light reflected from the film or sensor during the exposure. 3.Between the focusing screen and the pentaprism. Measures light diverted by a beam-splitter. 4-7.On the pentaprism. 8.On the eyepiece. Measures light diverted by a beam-splitter. Difficulties of behind-the-lens metering can include inflated readings due to light entering the eyepiece from the rear, false readings with polarizing filters due to polarization of light by the metering system, and inconsistencies in diverting a fixed proportion of light to the meter cell.
Although behind-lens meters generally offer less precision with respect to measuring the light from selected parts of a scene and are restricted to reflected-light-type readings, they offer certain advantages over handheld meters in addition to convenience. Behind-lens meters essentially measure the light falling on the image sensor, variations in the light caused by increasing the lens-to-image sensor distance for close-up photography, flare light, and variations in transmittance of different lenses set at the same f-number are automatically compensated for. Some camera manufacturers also claim that their meters compensate for the absorption of light by color filters placed over the lens. If a film camera is being used with panchromatic film, caution should be used here. The spectral response of the meter cells may not be in close agreement with the spectral sensitivity of the panchromatic film, which may cause a metering error. There is currently no such data available for digital cameras. Color filters may, however, produce unpredictable results when interacting with the white balancing software of the camera. Experimenting with your camera is recommended here.
Incident-Light Readings
Incident-light meter readings have long been popular with professional motion-picture and still photographers because they can be made quickly and they give dependable results. The basic instructions for using an incident-light exposure meter is to hold the meter in front of the subject and aim it at the camera. This eliminates the need to decide if the scene has an equal balance of light and dark areas because the meter measures the light falling on the subject rather than the light reflected by the subject, and the meter is calibrated for a subject having a range of tones from black to white with a medium tone of 18% reflectance. Considering the placement of the position of the dominant light source is also eliminated with incident-light meters having hemispherical diffusers because this compensates for changes in the direction of the light and the corresponding change in the relative sizes of highlight and shadow areas.
Instruction manuals for exposure meters sometimes warn the user that the meter can only measure light, it can't think for the photographer; this applies to incident-light as well as reflected-light exposure meters. One potential source of error is associated with the time-saving observation that when the light falling on the subject and the camera is the same, as when both are in direct sunlight, the reading can be taken at the camera position. It is obvious that when the camera is in the shade of a tree or building and the subject is in direct sunlight, the incident-light reading must be taken in the sunlight—but it is not so obvious, when a light source is close to the subject, that readings can be dramatically different at the subject and one foot in front of the subject. Therefore, the closer the light source is to the subject, the more important it is to take the incident-light meter reading as close to the subject as possible. The inverse-square law of illumination can be ignored with sunlight because of the great distance of the sun, but it should not be ignored indoors when a light source is within a few yards of the subject.
Although the point has already been made that it is not necessary to consider the balance of light and dark areas in a scene for incident-light readings, it is advisable to modify the exposure indicated by an incident-light meter when the main subject is either very light or very dark in tone. It is advisable to increase the exposure by one-half to one stop with black or very dark objects and to decrease the exposure by one-half to one stop with white or very light objects. Since it is possible to hold detail in an entire gray scale or a scene containing both white and black areas, even with reversal color films, which have limited exposure latitude, it is necessary to explain why the exposure should be adjusted when the subject is predominantly light or dark.
The best illustration of the principles at work here is with the characteristic curve for a reversal-type film shown in Figure 2-42; it will be noted that the white end of a correctly exposed gray scale falls on the toe and the black end falls on the shoulder. Some contrast is therefore lost in both of these areas, compared to the intermediate tones, which fall on the central part of the curve. This compression of contrast in the lightest and darkest areas is acceptable when they are not the dominant subject of the scene, but when either becomes the main area of interest it is better to adjust the exposure to move that area onto or closer to the straight line in order to increase the detail and contrast (see Figure 2-43).
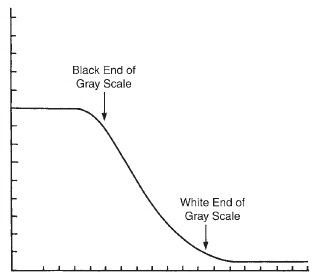
Figure 2-42 Since the white and black ends of a gray scale photographed on reversal-type film fall on the shoulder and toe of the characteristic curve where the slope is lower, some contrast is lost in both of these areas compared to the intermediate tones, which fall on the steeper central part of the curve.
Incident-light exposure meters with hemispherical diffusers should be positioned close to the subject and aimed at the camera.
Reflected-light-type exposure meter readings are appropriate for subjects that emit or transmit light rather than reflect light.
Properly made reflected-light meter readings and incident-light meter readings should indicate the same camera exposure settings with normal scenes.
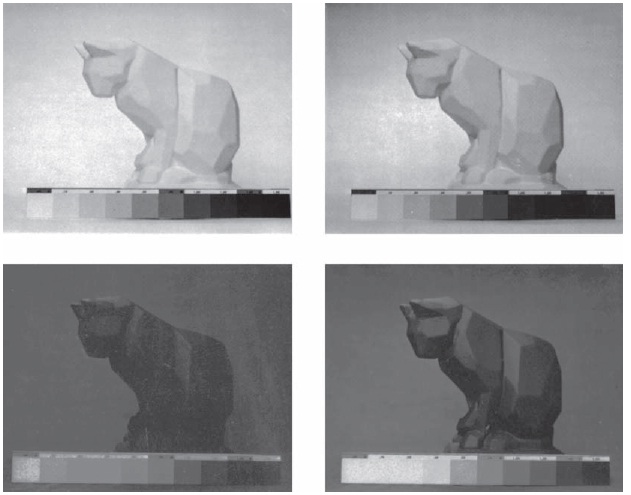
Figure 2-43 Although incident-light meter readings (or reflected-light meter readings from a neutral test card) produce the optimum exposure for subjects having a normal range of tones as represented by a gray scale, exposure adjustments are recommended for high-key scenes and for low-key scenes. (Top left) White object on light background with normal exposure. (Top right) One stop less exposure. (Bottom left) Black object on dark background with normal exposure. (Bottom right) One and one-half stops more exposure.
Figure 2-44 A situation in which it would be difficult to obtain a dependable reflected-light exposure meter reading because of the small size and the predominately light tone of the die. (Photograph by James Craven, Imaging and Photographic Technology student, Rochester Institute of Technology.)
No single method of using an exposure meter is appropriate for all picture-making situations. Incident-light readings cannot be made when the image-forming light is either emitted or transmitted by the subject rather than being reflected. Examples of emitted light are molten metal, flames, and fluorescent and phosphorescent objects. Transmitted light is encountered when transparent or translucent materials are illuminated from behind, as with stained-glass windows, some night advertising signs, a photographic transparency placed on an illuminator for copying, and sunsets. They also cannot be used when you cannot physically get close to the object being photographed, for example, an animal in the wild.
A downward adjustment in the film-speed setting is recommended when developing film to a lower-than-normal contrast index.
In some situations, incident-light meter readings are more appropriate than reflected-light readings. Probably the most commonly encountered situation of this type is where the subject or the subject areas are too small to be read accurately even with a narrow-angle spot-type reflected-light meter. This problem occurs not only in the fields of close-up photography and photomacrography but also when photographing a detailed object such as a black line drawing on a white background, where the light and dark tones are not balanced in size and the individual areas are too small to be measured (see Figure 2-44).
In most picture-making situations, the photographer has the choice of making either reflected-light or incident-light exposure meter readings. With meters that are designed to be used in both modes, it is a valuable exercise for the photographer to make comparison readings. When the readings do not agree, comparison photographs will reveal which method is superior in that type of situation. Reflected-light readings from an 18%-reflectance neutral test card are essentially the same as incident-light readings and should consistently indicate the same camera exposure.
Effective Film Speed and Degree of Development
Published film speeds for black-and-white films are based on a specified degree of development. Developing the film to a higher contrast index tends to increase the film's effective speed, up to a limit, and developing to a lower contrast index tends to decrease the effective speed. In practice, it is not uncommon for photographers to develop film to higher and lower contrast indexes than those indicated in the film speed standard.
Film development is sometimes altered to compensate for the difference in printing contrast between condenser and diffusion enlargers, to compensate for variations in scene contrast, and to compensate for variations in the amount of camera flare light in different situations. Adjustments in the effective film speed can be made either by altering the film-speed setting on the exposure meter, or by using the published film speed and then incorporating the correction in the choice of camera shutter speed and f-number settings.
Film manufacturers provide information on the film data sheet regarding adjustments to developing times and concentrations to assist the photographer in achieving the final desired contrast for the film. Film response curves are also provided to show the effect of altering the development on the shadow, midtone, and highlight areas within the negative.
Flash Guide Numbers
Put simply, a flash guide number is a measure of the light output by the flash unit. In the absence of a flash meter, the guide number is used to determine the proper exposure when using a manual flash. Guide number is defined as follows:
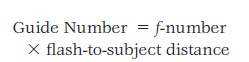
(Eq.2-4)
Notice that the equation indicates flash-to-subject distance and not cam-era-to-subject distance. If the flash is placed in the camera hotshoe the two distances are the same, however if the flash is not on the camera the distance may be different.
The above equation can also be used to determine the proper f-number to use (f-number = guide number/ flash-to-subject distance). The f-number calculation may have to be rounded to the nearest available f-number. Consider bracketing the exposure to ensure that the results are pleasing. Keep in mind most cameras have only one sync speed when using flash so only the aperture can be adjusted, not the shutter speed in this situation.
Flash guide numbers are provided for an ISO speed of 100. The higher the guide number, the higher the intensity and the greater the flash-to-camera distance can be. Guide numbers can easily be adjusted for different ISO values. The guide number will double for two stops in ISO speed. For example, if the guide number is 80 for an ISO of 100, it will be 160 for an ISO of 400. Guide numbers are often provided in both feet and meters distances, so care should be taken to use the proper units. A guide number of 43 when using meters is the same as 96 when using feet.
Additional complications are encountered in attempting to determine the correct exposure with guide numbers when using bounce flash (where the reflectance of the reflecting surface must be taken into account) and multiple flash (where the cumulative effect of two or more flash sources at different distances and angles, and sometimes different intensities, must be calculated).
Flash Meters
Some electronic flash units have built-in sensors that terminate the flash when the system indicates that the film has received the correct exposure.
Conventional exposure meters cannot be used with flash and electronic flash because the meters are designed to measure the light from a source of constant intensity rather than a source of rapidly changing intensity and short duration. Electronic-flash meters work on the principle of measuring the total amount of light that falls on the photocell over an appropriately short period of time by charging a capacitor and then measuring the charge (see Figure 2-45). Some electronic-flash meters have required a sync-cord connection with the flash unit to be able to measure the light from the flash plus ambient light for the approximate period that the camera shutter would be open. Other meters are able to achieve this without a physical connection with the flash unit, and meters are now available that can be used both as a conventional exposure meter and as an electronic-flash meter. Whereas certain electronic-flash meters can be adjusted to integrate the flash plus ambient light over a time interval equal to the selected shutter speed, others operate only over a fixed instantaneous interval, such as 1/60 second.

Figure 2-45 An electronic-flash exposure meter.
An alternative to measuring the light from an electronic-flash unit with a preliminary trial flash and a meter is to measure the light reflected from the subject by a sensor built into the flash unit and then terminate the flash when the sensor system indicates the film has received the correct amount of light. The process by which the duration of the flash is shortened to provide the correct exposure is called quenching. Early quenching systems achieved the effect by dumping the remaining capacitor charge when sufficient light had been emitted, thus wasting the unused charge and shortening battery life. More recent units have incorporated a means of breaking the circuit between the capacitor and the tube when a signal is received from the metering system, without wasting the remaining charge in the capacitor. When quench-controlled electronic-flash units are used for close-up photography, the flash duration tends to be extremely short. The short duration provides excellent action-stopping capabilities for the photographing of rapidly moving objects—but because of reciprocity effects, the density, contrast, and color balance of the photographic image can be affected (see Figure 2-46).
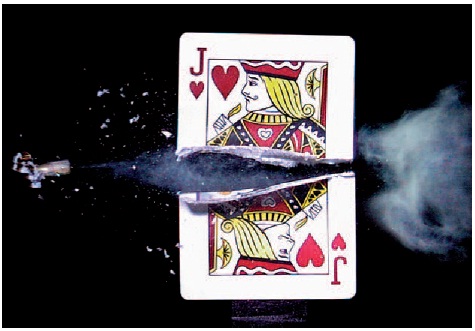
Figure 2-46 A bullet photographed in the process of cutting a playing card in half demonstrates the action-stopping capability of short-duration electronic-flash light sources. (Photograph by Professor Andrew Davidhazy, Imaging and Photographic Technology, Rochester Institute of Technology.)
Color-Temperature Meters
Color-temperature meters are closely related to photoelectric exposure meters, even though they are designed to measure the spectral quality of light rather than the quantity. An ingenious photographer can use a conventional exposure meter as a color-temperature meter by taking readings in sequence through a red filter and a blue filter and setting up a conversion chart or dial based on the relative values of the two readings. One type of color-temperature meter contains two photocells and circuits, with a red filter over one cell and a blue filter over the other, and a calibrated dial to indicate the relative currents in the two circuits in terms of degrees Kelvin or mireds (see Figure 2-46). Modern color-temperature meters typically use three silicon photodiodes that are filtered for red, green, and blue sensitivities that approximate the sensitivity of color film. The meter will measure the amount of energy present in the three regions and determine the color temperature by finding the closest match to a blackbody curve. Meters will either provide a color temperature, a mired shift, or a Wratten filter number to achieve the desired color temperature. These meters are intended to be used with continuous spectral power distributions that approximate a black-body such as tungsten lamps.
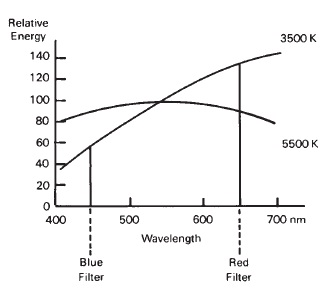
Figure 2-47 In a two-filter color-temperature meter the relative amounts of blue light and red light are measured. The ratio of blue to red is approximately 1:1 for the 5,500 K illumination, but approximately 1:2.4 for the 3,500 K illumination.
Color-temperature meters operate by comparing the relative amounts of two or three different colors of light in the incident light.
REVIEW QUESTIONS
- Identify the correct formula:
- ƒ-number = effective aperture/ focal length
- ƒ-number = image distance/ effective aperture
- ƒ-number = focal length/image distance
- ƒ-number = focal length/effective aperture
- As the opening in the diaphragm is made smaller, the /-number …
- increases
- decreases
- Select the number that does not represent a whole stop in the conventional ƒ-number series.
- 64
- 4
- 1.8
- 5.6
- 1.4
- Most lenses for 35-mm cameras are made so that they cannot be stopped down beyond ƒ/22 because …
- the exposure times would be too long to hand-hold the camera
- it is difficult to make diaphragms with such small openings
- diffraction would degrade the images
- of reciprocity effects
- The minimum resolving power that is considered adequate in a print to be viewed at a distance of 10 inches is approximately …
- 10 lines/mm
- 28 lines/mm
- 35 lines/mm
- 64 lines/mm
- 80 lines/mm
- The effective ƒ/number = …
- ƒ-number X (image distance/focal length)
- /-number X (focal length/image distance)
- A 50-mm focal length lens is set at ƒ/8. If the image distance is 100 mm, the exposure factor is …
- 1
- 2
- 4
- 8
- 16
- If an ƒ/1.4 lens that transmits only half of the light that it would if no light were lost because of reflection and absorption is recalibrated in T-numbers, ƒ/1.4 would become …
- T/1
- T/1.6
- T/1.8
- T/2
- T/2.8
- According to the rule of thumb, the slowest shutter speed that is safe to use with a hand-held camera equipped with a 55-mm focal-length lens is approximately …
- 1/15 sec
- 1/30 sec
- 1/60 sec
- 1/125 sec
- 1/250 sec
- When accurate between-the-lens shutters are used at high speeds with the diaphragm stopped down, the effective exposure time is …
- longer than the marked exposure time
- the same as the marked exposure time
- shorter than the marked exposure time
- Overexposure of black-and-white film can cause …
- an increase in contrast (only)
- a decrease in contrast (only)
- either an increase or a decrease in contrast
- None of the above. Exposure does not affect contrast
- If one were to test an exposure meter by exposing film in a camera, it would be best to use …
- a negative-type black-and-white film
- a negative-type color film
- a reversal-type color film
- If a black-and-white photograph is made on panchromatic film with a red filter on the camera lens according to a behind-lens meter that has high red sensitivity, the resulting negative will probably be …
- underexposed
- correctly exposed
- overexposed
- The term luminance meter is a synonym for …
- reflected-light meter
- incident-light meter
- ultraviolet radiation meter
- infrared radiation meter
- When using an exposure meter with a hemispherical diffuser with a threedimensional subject, it is recommended that the meter be aimed …
- at the main light source
- at the camera
- midway between the main light source and the camera
- The following series of numbers (1, 2, 4, 8, 16) is identified as …
- a ratio scale
- an interval scale
- a hybrid scale
- If a reflected-light exposure meter reading is taken from a white area in a typical scene, the resulting negative or transparency will be …
- underexposed
- correctly exposed
- overexposed
- Using a neutral test card as an artificial midtone for an exposure meter reading with a three-dimensional subject, the card should be aimed …
- at the camera
- at the dominant light source
- midway between the camera and the dominant light source
- With an exposure meter that has an interval scale of numbers (1-2-3-4-etc.), the calculated midtone reading for a scene in which the shadow reading is 2 and the highlight reading is 8 is …
- 3
- 4
- 5
- 6
- 7
- An advantage behind-lens meters have over hand-held meters is …
- greater sensitivity
- better spectral response
- automatic compensation for changes in lens-film distance
- that they do not require batteries