
Uh-Oh! (Responding to Errors)
You write perfect code, right? Even if it’s perfect this time, though, the day will come when it isn’t. When coding doesn’t go as planned, you have to figure out the problem. To help developers in the dire situation of a random application crash, the ADT provides valuable tools to help debug applications.
Using the Dalvik Debug Monitor Server
The Dalvik Debug Monitor Server (DDMS) is a debugging tool that provides these features, among others:
![]() Port forwarding
Port forwarding
![]() Screen capturing
Screen capturing
![]() Thread and heap information on the device
Thread and heap information on the device
![]() System log messages via LogCat
System log messages via LogCat
![]() Process and radio state information
Process and radio state information
![]() Incoming call and SMS spoofing
Incoming call and SMS spoofing
![]() Location data spoofing
Location data spoofing
DDMS, located in the Android SDK platform-tools directory, can work with an emulator and a connected device. In Chapter 2, you add the platform-tools directory to your path, so you should be able to access DDMS from the command line.
Why you should get to know DDMS
Debugging is rarely fun. Thankfully, DDMS provides the tools necessary to help you dig yourself out of a hole filled with bugs. One of the most commonly used features in DDMS is the LogCat viewer, which allows you to view the output of system log messages from your system, as shown in Figure 5-9.
This system log reports everything from basic information messages (which include the state of the application and device) to warning and error information. Seeing only an “Application Not Responding” or a force-close error message on the device doesn’t clarify what has happened. Opening the DDMS and reviewing the entries in LogCat can help identify, down to the line number, where the exception is occurring.
 DDMS doesn’t solve the problem for you (darn it!), but it can make tracking down the root cause of the issue much easier.
Figure 5-9: A view of LogCat.

DDMS is also useful in scenarios where you have no physical device for testing. For example, if your application is based on tracking a user who is moving across a map and the user’s device has no GPS (or the user has no device), the task becomes nontrivial. Thankfully, DDMS is here to help. DDMS provides tools via location control. As a developer, you can manually provide GPS coordinates or a GPS eXchange Format (GPX) file or a Keyhole Markup Language (KML) file that represents points on a map that can be timed accordingly. For example, you might specify that the user stay at this point for 5 seconds, move to another point, move to the next point, and so on.
Displaying log messages in DDMS
Displaying log messages in DDMS is as simple as adding one line of code to your app. Open the MainActivity.java file, and at the bottom of the method, add a log entry, as shown in bold in Listing 5-5.
Listing 5-5: The onCreate() Method
@Override
public void onCreate(Bundle savedInstanceState) {
super.onCreate(savedInstanceState);
setContentView(R.layout.activity_main);
mAudioManager = (AudioManager)getSystemService(AUDIO_SERVICE);
checkIfPhoneIsSilent();
setButtonClickListener();
Log.d(“SilentModeApp”, “This is a test”); →12
}
Line 12 demonstrates how to output a message into the system log. SilentModeApp is known as the TAG that you’re giving to this log entry; the second parameter to the log call is the message you want to output. The tag helps filter messages while looking at them in DDMS.
 Declare a
 TAG constant in your code and use it instead of repeatedly typing the TAG, as in this example:
private static final String TAG = “SilentModeApp”;
Notice the d in Log.d in Listing 5-5, indicating that this is a debug message. Other options are
![]()
e: error
![]()
i: info
![]()
wtf: What a terrible failure (Yes, it’s an option.)
![]()
v: verbose
The various logging types exist for you to decide how various messages should be logged.
For logging to work, you have to import the android.util.Log package.
Viewing DDMS messages
You can view DDMS messages by either opening DDMS manually or opening the DDMS perspective in Eclipse:
![]() Manually: Navigate to wherever you installed the Android SDK. Inside the
Manually: Navigate to wherever you installed the Android SDK. Inside the tools directory, double-click the ddms.bat file. The DDMS application opens outside the Eclipse IDE, as shown in Figure 5-10.
![]() In Eclipse: The ADT has installed a DDMS perspective. To open it, click the Open Perspective button (see Figure 5-11) and choose DDMS.
In Eclipse: The ADT has installed a DDMS perspective. To open it, click the Open Perspective button (see Figure 5-11) and choose DDMS.
If DDMS isn’t visible in this view, select the Other option and then select DDMS, to add a DDMS perspective to the list of perspectives that you can easily toggle.
If you prefer to move the LogCat window (usually near the bottom of the screen) to the main area of the screen, as shown in Figure 5-12, simply drag the LogCat tab title and drop it on the location you want.
Figure 5-10: An instance of DDMS running separately from Eclipse.

Start the application by choosing Run⇒Run or pressing Ctrl+F11. When your application is running in the emulator, open the DDMS perspective and look for your log message. It should look somewhat similar to the one shown in Figure 5-13.
You can now switch back to the Java perspective by clicking the Java Perspective button. (Refer to Figure 5-11.)
Figure 5-11: The Open Perspective button.
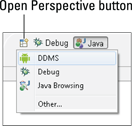
Figure 5-12: The LogCat window, in the main viewing area of Eclipse.
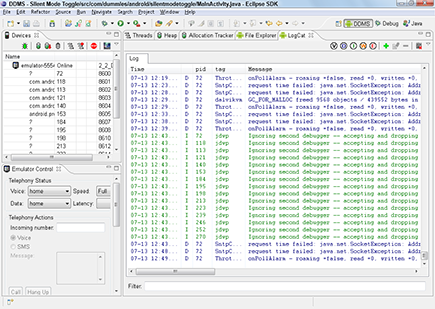
Figure 5-13: Viewing your LogCat message in Eclipse via the DDMS perspective.

Using the Eclipse debugger
Although DDMS might be one of your best allies, your number-one weapon in the battle against the army of bugs is the Eclipse debugger, which lets you set various breakpoints, inspect variables using the watch window, view LogCat, and much more. You use the debugger for either runtime errors or logic errors.
Eclipse catches errors in syntax. When the application doesn’t compile, Eclipse alerts you by placing a colored, squiggly line underneath the problematic area.
Checking runtime errors
The runtime error is the Wicked Witch of the East — it comes out of nowhere and leaves everything a mess. In Android, runtime errors occur while an application is running. Your application might be humming along and, all of a sudden, your application crashes when you click a menu option or a button, for example. The possible reasons for this behavior are innumerable — perhaps you didn’t initialize the AudioManager in the onCreate() method, and then you tried to access the variable later in the app, which would cause a run-time exception.
The debugger can help in this situation because you can set a breakpoint at the start of onCreate() that allows you to inspect the values of the variables through the debug perspective. You would likely then realize that you forgot to initialize the AlarmManager.
Listing 5-6 demonstrates what would create this scenario — commenting out the AlarmManager initialization causes an exception to be thrown at runtime.
Listing 5-6: Commenting Out the AlarmManager Initialization
private AudioManager mAudioManager; →1
private boolean mPhoneIsSilent;
@Override
public void onCreate(Bundle savedInstanceState) {
super.onCreate(savedInstanceState);
setContentView(R.layout.activity_main);
//mAudioManager = →9
// (AudioManager)getSystemService(AUDIO_SERVICE);
checkIfPhoneIsSilent();
setButtonClickListener();
Log.d(“SilentModeApp”, “This is a test”);
}
/**
* Checks to see if the phone is currently in silent mode.
*/
private void checkIfPhoneIsSilent() {
int ringerMode = mAudioManager.getRingerMode(); →22
if (ringerMode == AudioManager.RINGER_MODE_SILENT) {
mPhoneIsSilent = true;
} else {
mPhoneIsSilent = false;
}
}
Listing 5-6 works this way:
→1 The class-level AudioManager is introduced.
→9 This code, which is commented out, leaves the mAudioManager variable in a null state.
→22 When onCreate() called checkIfPhoneIsSilent(), the application threw a runtime exception because mAudioManager was null and the application tried to reference a member on an object that doesn’t exist.
Attaching a debugger to the onCreate() method allows you to track down the root cause of the error.
Creating breakpoints
You have a couple ways to create a breakpoint, which will pause your application mid-execution and let you examine its running state:
![]() Choose the line where you want to place the breakpoint by clicking it with the mouse. Choose Run⇒Toggle Breakpoint, as shown in Figure 5-14, or press Ctrl+Shift+B.
Choose the line where you want to place the breakpoint by clicking it with the mouse. Choose Run⇒Toggle Breakpoint, as shown in Figure 5-14, or press Ctrl+Shift+B.
![]() Double-click the left gutter in the Eclipse editor where you want to create a breakpoint.
Double-click the left gutter in the Eclipse editor where you want to create a breakpoint.
Figure 5-14: Setting a breakpoint by using a menu or hot keys.

Either method creates a small, round icon in the left gutter of the Eclipse editor, as shown in Figure 5-15.
To try debugging in Eclipse, comment out line 3 of the onCreate() method, as shown in Listing 5-7.
Listing 5-7: Commenting Out Code to Throw an Error
setContentView(R.layout.activity_main);
//mAudioManager = (AudioManager)getSystemService(AUDIO_SERVICE); →3
checkIfPhoneIsSilent(); →5
→3 The AudioManager is commented out.
→5 The method is called, which causes the application to fail.
Set a breakpoint on line 5.
Figure 5-15: A set breakpoint in the left gutter of Eclipse’s editor window.

Starting the debugger and the Debug perspective
You have one task to tend to before you start debugging: Tell the Android application that it’s debuggable. To do so, open the AndroidManifest.xml file, select the Application tab at the bottom (see Figure 5-16), and then choose the debuggable property and set it to true, as shown in the figure. Then save the file.
Figure 5-16: Setting up the application as debuggable.

Failing to set the debuggable property to true ensures that you never get to debug your application. Your application won’t even attempt to connect to the debugger. If you ever have problems with debugging, check to see whether this property is set to true.
Follow these steps to debug your code:
1. Choose Run⇒Debug or press F11.
The ADT and Eclipse install the application on the emulator (or device) and then attach the debugger to it.
2. Open your emulator.
The application installs, and you see the screen shown in Figure 5-17. It notifies you that the ADT and the emulator are trying to make a connection behind the scenes.
Figure 5-17: The emulator waits for the debugger to attach.
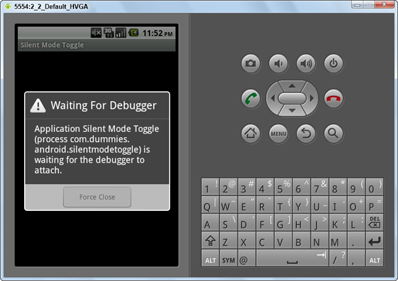
The emulator might sit for a moment while the debugger attaches. Then the emulator runs your application code and stops when it finds its first breakpoint.
You then see a dialog box asking whether the Debug perspective can be opened.
3. Click Yes to open the Debug perspective.
You’re now at a breakpoint, as shown in Figure 5-18. You can hover the cursor over variables to see their values.
4. Hover the cursor over the mAudioManager
variable.
The variable is null because you had commented out the code, as shown in Figure 5-18.
Figure 5-18: The Debug perspective is explained.

You can also step through the execution of the code by operating the debug navigation, as shown in Figure 5-18. If you click the Continue button (or press F8), you can see the Debug perspective change and eventually say source not found. Open the emulator, and you can see that your application has crashed, as shown in Figure 5-19. In the Google Play Store, users have come to know this screen as the force-close (or FC) screen. A force-close occurs when a runtime exception isn’t handled inside your code.
Figure 5-19: The force-close dialog box opens after a runtime exception.

5. To disconnect the debugger, click the Disconnect button.
Return to the Java perspective, and uncomment line 3 from Listing 5-7 in the MainActivity.java file to ensure that the application builds successfully.
Checking logic errors
Computers do exactly what you tell them to do, and this little smartphone isn’t smart enough to understand what’s right or wrong in literal logic. An example of an error in literal logic is demonstrated in Listing 5-8.
Listing 5-8: Code That Doesn’t Check the Phone for Silent Mode
/**
* Toggles the UI images from silent
* to normal and vice versa.
*/
private void toggleUi() {
ImageView imageView =
(ImageView) findViewById(R.id.phone_icon);
Drawable newPhoneImage;
if (mPhoneIsSilent) { →11
newPhoneImage =
getResources().getDrawable(R.drawable.phone_silent);
} else {
newPhoneImage =
getResources().getDrawable(R.drawable.phone_on);
}
imageView.setImageDrawable(newPhoneImage);
}
@Override
protected void onResume() {
super.onResume();
//checkIfPhoneIsSilent(); →26
toggleUi();
};
Listing 5-8 works this way:
→11 This line checks to see whether the phone is in Silent mode.
→26 For the toggleUi() method to properly display the correct user interface to the user, the application has to know what state the ringer is in. This line comments out the checkIfPhoneIs Silent() method, which updates the class-level mPhoneIs SilentVariable.
Because this occurs in the onResume() method, the user can leave the app, change its ringer state via the phone’s Settings app, then return to the app — and the app would be in an incorrect state simply because of a logic error.
Using a debugger, you can attach a breakpoint on the first line of the toggleUi() method to inspect the various variables that help make the logic calls. Then you would notice that mPhoneIsSilent isn’t being set.