
9
One-period binomial tree model
In the first part of this book, whenever we discussed options and other derivatives, we always considered the initial premium as given. We briefly discussed that to find the price of an option, a mathematical model for the evolution of the underlying asset price would be needed.
In the next chapters, we will introduce our very first class of market models for the price of the underlying asset, namely the binomial tree model. It is probably the most famous discrete-time financial model to represent the evolution of a stock price, an index value, etc. We will mostly focus on pricing and hedging financial and actuarial derivatives written on a risky asset whose price follows such a model.
Before introducing the general multi-period binomial tree model, we will have a first (but deep) look at the very important one-period and two-period versions of this model. These two special cases will allow us to introduce all the main ideas and concepts in a technically (and financially) easy fashion.
The main objective of this chapter is to investigate the one-period binomial tree model to price options and other derivatives. The specific objectives are to:
- describe the basic assets available in a one-period binomial model;
- identify the assumptions on which a one-period binomial model is based;
- understand how to build a one-period binomial tree;
- understand how to price a derivative by replicating its payoff;
- rewrite the price of a derivative using risk-neutral probabilities;
- recognize that risk-neutral probabilities are only a mathematical convenience.
9.1 Model
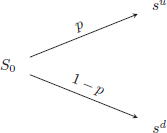
In a one-period model there are two time points: the beginning of the period is time 0 and the end of the period is time 1. In most cases, time 0 will represent inception or issuance of a derivative contract while time 1 will stand for its maturity. One should think of time 0 as today while time 1 is in the future.
A one-period binomial model is a frictionless financial market (see Chapter 2) composed of only two assets:
- a risk-free asset (a bank account or a bond), which evolves according to the risk-free interest rate r;
- a risky asset (a stock or an index) with a known initial value and an unknown future value.
9.1.1 Risk-free asset
A risk-free asset is an asset for which capital and interest are repaid with certainty at maturity. It is said to be risk-free in the sense that there is no default: the borrower always meets its obligations. We denote by B = {B0, B1} the evolution of the price of this asset with B1 ⩾ B0, which is the risk-free condition. In other words, B0 is today’s price while B1 is its value at the end of the period.
In the one-step binomial tree model, we assume there exists a constant interest rate r ⩾ 0 for which we can either write
Therefore, in this one-period model, r is not an annual rate.
Depending on whether we fix B0 or B1, B can be interpreted as the evolution of a bank account (in which case, we deposit B0 that accumulates with capital and interest to B1) or a zero-coupon bond (in which case, B1 is equal to the face value of the bond and B0 is the present value of B1).
For simplicity and without loss of generality, in what follows we assume that B0 = 1. In summary, we have
9.1.2 Risky asset
The evolution of the risky asset price is represented by S = {S0, S1} where S0 is today’s price and S1 is the asset price at the end of the period. We have that S0 is a known (observed) constant while S1 is a random variable. We assume that this random variable S1 takes values in {su, sd} with probability p and 1 − p respectively, where 0 < p < 1 and sd < su. The probability distribution of S1 (with respect to ![]() ) is simply:
) is simply:
which is similar to a (biased) coin toss experiment.
One could think of the scenario/event {S1 = su} as a bull market scenario (u for up) and {S1 = sd} as a bear market scenario (d for down). Therefore, the one-period binomial tree model is a 5-parameter model: those parameters are B1 (or equivalently r), S0, sd, su and p.
The one-period model and its randomness are often represented graphically by a tree:
Example 9.1.1 Construction of a binomial tree
We represent the possible prices of a stock in 3 months by a one-step binomial tree. The current stock price is $52 and a 3-month Treasury zero-coupon bond currently trades at $99 (for a face value of $100). According to financial analysts, the stock price in 3 months will either be $55 or $50 with a 60% chance of going up. Let us build the corresponding one-step binomial tree.
We have ![]() and the binomial tree for the stock is
and the binomial tree for the stock is

As illustrated by the previous example, a period in our model can represent either a day, a month, 6 months, a year, etc. As a result, the time length of the period has an impact on the interpretation of the parameters. For example, the interest rate r is not annualized even though it is the case in practice. One can also work directly with B0 and B1 to remove any ambiguity.
Finally, in order to make sure that the model is arbitrage-free, we must have
which means that no asset is doing better than the other one in both scenarios. Say an investor has S0$ in cash and needs to determine whether to invest S0$ in the risk-free asset B or purchase a share of S. Then the arbitrage-free condition states that neither of the two choices will perform better than the other in both scenarios.
If (9.1.1) is not verified, say if sd < su < S0B1, then we can construct an arbitrage by going long the risk-free asset and short-selling the risky asset. The inequalities in (9.1.1) will be referred to as the no-arbitrage condition. Note that the probability p does not appear in this condition.
Example 9.1.2 Absence of arbitrage between the stock and the bond
The current stock price is $10 and it will either increase by $1 or $2 over the next month. Finally, if we deposit $1 in a bank account, it will be worth 1.01 in a month. Determine whether there is an arbitrage opportunity between the risky and risk-free assets and how to exploit it.
Here, we have S0 = 10, sd = 11, su = 12 and B1 = 1.01. In this case, the no-arbitrage condition of equation (9.1.1) is not verified: we have
In other words, investing in the stock is always (in the two scenarios) a better investment than investing in the risk-free asset.
To exploit this opportunity, we can borrow $10 at the risk-free rate and immediately buy the stock for $10. At time 0, the net initial cash flow is 0. At time 1, we have a value in the stock that is either 11 or 12: in both cases, this is enough to pay back the loan with capital and interest (a total of 10.10). Therefore, there is a certain (at no risk) profit available, which is either 0.90 or 1.90.
9.1.2.1 Simplified tree
We can use an alternative representation1 for the stock price at maturity using an up factor u and a down factor d as follows: set
We can now write
Since it has been assumed that sd < su, we deduce that d < u.

With this new notation, we can say that the one-period binomial tree model is parameterized by ![]() and the no-arbitrage condition (9.1.1) is now equivalent to
and the no-arbitrage condition (9.1.1) is now equivalent to
Note that this alternative representation will play a crucial role for the multi-period binomial tree, to be studied in Chapter 11.
Example 9.1.3 Binomial tree using up and down factors
Suppose a stock can either increase by 10% or decrease by 5% by the end of the period. Therefore u = 1.1 and d = 0.95. In the context of example 9.1.1, we have
and
.
9.1.3 Derivatives
We now introduce a third asset in the market: it is an option or a derivative written on the risky asset S. The price of the derivative over the period is denoted by V = {V0, V1} with V0 being today’s price while V1 is the derivative’s value at the end of the period, i.e. V1 is the payoff. As for the risky asset, V0 is a (still unknown) constant but V1 is a random variable. The derivative is said to be written on the risky asset S because its payoff is such that V1 = vu when S1 = su, whereas V1 = vd when S1 = sd. As a result, V1 is a random variable taking values in the set {vu, vd}. Consequently, V1 has the following probability distribution (with respect to ![]() ):
):
For example, we can say that the probability that an option with payoff V1 expires in-the-money is given by ![]() .
.
In the next section, we will determine the value of V0, such that there are no arbitrage opportunities.
Underlying probability model and the real-world probability measure
It is sometimes useful to describe the full probability model on which the one-period binomial tree is constructed. As for coin tossing, one can choose its sample space Ω1 to be
It is then clear that each state of nature ω ∈ Ω1, that is each scenario, corresponds to a branch in the tree. Clearly, the possible prices at maturity are
Similarly, the random variable V1 is
In other words, the random variable V1 takes the value vu in the up scenario (ω = u) which is when S1 takes the value su. Moreover, V1 takes the value vd in the down scenario (ω = d) which is when S1 takes the value sd.
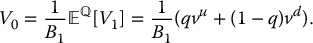
The objective probability measure ![]() contains the information of how investors view the market and consequently p is the likelihood (w.r.t.
contains the information of how investors view the market and consequently p is the likelihood (w.r.t. ![]() ) of the event {S1 = su} which characterizes the distribution of S1. The value of p could be estimated using data on the price of the risky asset being modeled.
) of the event {S1 = su} which characterizes the distribution of S1. The value of p could be estimated using data on the price of the risky asset being modeled.
We can now superimpose the evolution of the derivative price V (in boxes) and the evolution of the stock price S.

Because they are very important cases to analyze, instead of the notation V = {V0, V1}, we will use the notation C = {C0, C1} and P = {P0, P1} for a call option and a put option, respectively. Therefore, we have
if the options are both struck at K and if they both mature at time 1.
Example 9.1.4 Payoff of call and put options
A stock currently trades for $100 and will either increase or decrease by 10% over the next 6 months. It was determined by financial analysts that the stock price has a probability of 55% of increasing. Suppose an at-the-money call option is issued today. Determine the payoff of the call option at maturity and the probability that it expires in the money. Repeat with an at-the-money put option.
We have C1 = (S1 − 100)+ and therefore C1 = 10 when S1 = 110 and C1 = 0 when S1 = 90. As for the put option, P1 = (100 − S1)+ and therefore P1 = 0 when S1 = 110 and P1 = 10 when S1 = 90. Graphically, we have

Then, the probability that the call option expires in the money is 0.55 while there is a 45% chance for the put option to expire in the money.
9.2 Pricing by replication
We are now ready to price derivatives in the one-period binomial tree model. In other words, we seek to find the price (premium) V0 that a buyer should pay to be entitled to the random payment V1 at time 1. In a market where we should avoid arbitrage opportunities, a derivative V should have the same value as an investment strategy/portfolio replicating its payoff (its only cash flow) in each and every scenario.
It must be emphasized at this point that the only assets available to invest in, and thus to replicate V, are the basic assets B and S. If it is possible to build a portfolio matching the derivative payoff, the resulting portfolio will be called a replicating portfolio for V1.
First, we define a trading strategy (or simply portfolio) as a pair (x, y), where x (resp. y) is the number of units of S (resp. B) held in the portfolio from time 0 to time 1. If x > 0, then we are buying x units of S at time 0, while if x < 0, then we are (short-)selling x units of S at time 0. The same interpretation holds for y and B with the additional remark that a long (short) position in the bank account is equivalent to lending (borrowing). Thus, this strategy’s value over time is given by Π = {Π0, Π1} with
for today’s value whereas
is the (random) value of the strategy at the end of the period.
If our goal is to replicate the payoff V1, then we should choose the pair (x, y) to make sure that
in each possible scenario. Equivalently, we need to find (x, y) such that
In other words, the number of units of the basic assets to hold should be such that the portfolio’s value mimics the values vu and vd, i.e. the payoff in the up and down scenarios, respectively.
Therefore, we need to solve (9.2.1), a simple system of two equations with two unknowns, where B1, sd, su are given model parameters and vd, vu are given by the derivative payoff at maturity. The values of x and y are the only two unknowns.
The cost for setting up this replicating strategy at time 0 is simply
And since the binomial model is arbitrage-free, the time-0 value (cost) of this replicating portfolio must also correspond to the time-0 price of the derivative because otherwise, there would be an arbitrage opportunity. In other words, if (x, y) are chosen as in (9.2.1), then the initial no-arbitrage price of the derivative must be
Example 9.2.1 Price of a call option
Financial analysts have determined that ABC inc.’s stock, which is currently traded at $100, will either win or lose 10% of its value over the next year. Unfortunately, they have not been able to specify the likelihood of each scenario. If the interest rate is 6% (compounded annually), what is the replicating portfolio and the (no-arbitrage) price of a call option on ABC inc.’s stock with strike price $105 and expiring a year from now?
We can model the stock price using a one-period binomial model with parameters S0 = 100, d = 0.9 and u = 1.1 (or equivalently su = 110 and sd = 90), and B1 = 1.06. Moreover, the call option payoff is given by C1 = (S1 − 105)+. Therefore, we have the following tree:

To replicate C1 = (S1 − 105)+, we need to choose (x, y) such that
in each possible scenario, or equivalently solve
Subtracting one equation from the other, we easily get
and inserting x = 0.25 in any of these two equations, we get
So, in order to replicate this call option, at time 0 we must buy 0.25 unit of ABC inc.’s stock and sell 21.226 units of the risk-free asset (borrow 21.226 × B0 = $21.226). The cost for setting up this strategy is
To avoid arbitrage opportunities, the initial price of the call option must be equal to the initial value of this replicating portfolio, that is we must have C0 = $3.774.
If V0 ≠ Π0, then it is possible to construct an arbitrage by buying the cheapest (the derivative or the replicating portfolio) and selling the costliest (the replicating portfolio or the derivative). This is illustrated in detail in example 9.2.2.
In a one-period binomial tree model, for any derivative with payoff V1, there exists a replicating strategy. Said differently, the linear system in (9.2.1) can always be solved algebraically (and its solution is unique). It suffices to subtract one equation from the other in the system of (9.2.1) in order to get
and then
Using the expression for x given in (9.2.3), we get
Consequently, the time-0 value of this replicating strategy is
By the no-arbitrage principle, this must also be the time-0 price of this derivative and we conclude that
Overall, in the one-period binomial tree model, all derivatives can be replicated and have a unique no-arbitrage price. Such a market model is also said to be complete (market (in)completeness and its impact in risk management will be discussed in detail in Chapter 13).
Example 9.2.2 Exploiting arbitrage opportunities
In the context of example 9.2.1, you find that a market maker is willing to buy or sell the call option for $4. Determine whether there is an arbitrage opportunity and how to exploit it.
Setting up the replicating strategy, you know that the no-arbitrage price of the option should be $3.774. In other words, at $4, this option is overpriced. Therefore, you sell the $4 call option to the market maker, set up the replicating strategy for $3.774 (25 − 21.226) and get an instant profit of 22.6 cents.
We need to check that cash flows are covered at maturity in any given scenario. If we observe S1 = 110, then the short call option is exercised and the position is worth −5. However, the 0.25 share of stock you bought is worth 27.50 and you need to repay the loan with interest for 22.50. The net total value of the positions is 0. If we observe instead S1 = 90, then the short call option is out of the money and the replicating portfolio is worth 0. Therefore, in both the up and down scenarios, everything is covered confirming the risk-free profit of 0.226.
In summary, we have:
| Time | t = 0 | t = 1 | |
| Up | Down | ||
| Short option | +4 | −5 | 0 |
| Long stock | −25 | +27.5 | +22.5 |
| Short bond | +21.226 | −22.5 | −22.5 |
| TOTAL | +0.226 | 0 | 0 |
Example 9.2.3 Actuarial price
A stock currently trades for $30. You work for an insurance company selling a product that pays $5 in one period if the stock price goes up (to $35) and $10 if the stock price goes down (to $25). Based on findings from financial analysts, the probability that the stock price goes down is 20%. Moreover, interest rates are very low so you believe that assuming r = 0 is a conservative assumption.
Based on your experience as an actuary, you think that the premium for this insurance product should be
Let us explain why this is not a good price for this product.
First of all, this is a product that is easily replicated. Using (9.2.3) and (9.2.4), we find
and
Therefore, short selling 0.5 share of the stock and investing 22.5 at the risk-free rate will yield the same payoff as the insurance product described above. The initial cost of this replicating strategy is
Second, in a frictionless market where rational agents exploit arbitrage opportunities, the premium of this product should be $7.50, i.e. we should have V0 = $7.50. Therefore, the product is underpriced at $6.
To exploit this mispricing, it suffices to buy the product from the insurance company (for $6) and replicate a short position in the above portfolio (buy 0.5 share of the stock and borrow 22.50) to lock in a risk-free profit of $1.50, with offsetting cash flows at maturity.
The last example shows that trading a derivative at any price different from its replicating portfolio’s cost yields an arbitrage opportunity.
Example 9.2.4 Forward contracts
The payoff of a one-period forward contract with delivery price K is S1 − K. We want to find the replicating strategy and the no-arbitrage price of this derivative in a one-period binomial tree model.
In the up scenario, the payment will be su − K whereas the payment will be sd − K in the down scenario. To replicate this payoff, we use equations (9.2.3) and (9.2.4) and deduce that, at time 0, the number of shares of stock we need to buy is
and the position in the risk-free asset is
Therefore, to replicate the payoff S1 − K, which occurs at maturity, we need to hold one share of stock and borrow ![]() at inception. This is the same strategy as the one obtained in Chapter 3, which was a model-free replicating strategy.
at inception. This is the same strategy as the one obtained in Chapter 3, which was a model-free replicating strategy.
In conclusion, the initial cost of replicating this portfolio and consequently the no-arbitrage time-0 value of a forward contract with delivery price K are both equal to
Recall that a forward contract is usually set up such that its initial value is zero. Hence, the corresponding delivery price, known as the forward price and denoted here by F10, is
as expected. It is the same expression as the one obtained in Chapter 3.
We conclude this section with an example that illustrates how to manage a more realistic product sold by insurance companies, namely an investment guarantee, as discussed in Chapters 6 and 8.
Example 9.2.5 Investment guarantees and risk management
A life insurer sells a very simple variable annuity written on a risky asset S. The policy promises to credit the return on S after one period subject to a minimum of 2%. Using the context of example 9.2.1, let us calculate how much a policyholder should pay for this product.
We seek to price a derivative whose final payoff is V1 = max (S1, S0 × 1.02) = max (S1, 102). This product is known as an investment guarantee.
The corresponding binomial tree is depicted as follows:

Using equations (9.2.3) and (9.2.4), we find that to replicate this investment guarantee, we need to buy x = 0.4 shares of the stock and invest y = 62.26415094 at the risk-free rate. Therefore, the initial no-arbitrage price of this derivative is V0 = 0.4 × 100 + 62.26415094 = 102.26415094.
Note that, as we did in Section 6.2.1 of Chapter 6, using basic financial engineering arguments, we can decompose this payoff as
In other words, the insurance company has sold a package containing a stock and a put option on that stock. When an insured buys this product, it is therefore long a stock and long a put. Consequently, we have
Pricing the investment guarantee is somewhat equivalent to pricing this put option.
9.3 Pricing with risk-neutral probabilities
We will now appeal to elementary algebraic manipulations to reorganize our pricing formula of equation (9.2.5) and somehow simplify its expression. In fact, we will be able to write the initial price of any derivative in a probabilistic form.
First, notice that the formula in (9.2.5) can be rewritten as follows:

Consequently, if we define
then we can write
Alternatively, if the binomial tree is defined using up and down factors, i.e. if su = uS0 and sd = dS0, then we can rewrite q defined in (9.3.1) as
Recalling the no-arbitrage condition of (9.1.1), which is
then it should be clear that 0 < q < 1.
Obviously, the pricing formula obtained in (9.3.2) is equal to the one previously obtained in (9.3.5). However, it has a familiar look: it is an expectation. Indeed, it can be considered as the expected value of the discounted payoff, if we use the new probability weights q and 1 − q, where the discounting is done at the risk-free rate. Consequently, we will say that q is the risk-neutral probability of an up-move and that 1 − q is the risk-neutral probability of a down-move.
In conclusion, we have obtained our first risk-neutral pricing formula: in a one-period binomial tree, for any given payoff V1, we have
where the superscript ![]() in the expectation emphasizes the use of the risk-neutral probability weights q and 1 − q.
in the expectation emphasizes the use of the risk-neutral probability weights q and 1 − q.
Example 9.3.1 Pricing with risk-neutral probabilities
In the context of example 9.2.1, the risk-neutral probability q is
or alternatively
Consequently, 1 − q = 0.20.
Therefore, the price of the call option of example 9.2.1 can be computed with the risk-neutral pricing formula of equation (9.3.3):
Of course, this is the same price as in example 9.2.1.
Finally, the put option of example 9.2.5 can also be computed with the risk-neutral pricing formula of equation (9.3.3):
Again, this is the same price as in example 9.2.5.
The risk-neutral probability measure
To allow us to be more precise, let us define a new probability measure we will call the risk-neutral probability measure. We define ![]() by
by
where q is given by (9.3.1). It should be noted that the possible outcomes taken by the random variables S1 and V1 are not related to the choice of probability measure. However, their probability distributions and any expectation computed with these distributions will depend on whether they are identified with respect to ![]() or
or ![]() . Then, with respect to
. Then, with respect to ![]() , we have
, we have
In words, if we create a probability measure ![]() with weights q and 1 − q assigned to the up and down scenarios respectively, then we can write the price of a derivative
with weights q and 1 − q assigned to the up and down scenarios respectively, then we can write the price of a derivative
as an expectation under the probability measure ![]() .
.
Let us now illustrate what it means to compute expectations with the risk-neutral probabilities q and 1 − q rather than with the real-world or actuarial probabilities p and 1 − p. First of all, the expected asset price at time 1 is simply given by
This is the real or actuarial expected value of S1, i.e. what is expected by actuaries and financial analysts (agreeing on this market model).
Second, if we use the risk-neutral probabilities q and 1 − q, then
From equation (9.3.1), we have that
so we can further write
Therefore, in the risk-neutral world, on average, the stock earns the risk-free rate. This is clearly not equivalent to the actuarial expected value.
As it was made clear by the algebraic reorganization of the formula in (9.2.5) at the beginning of the section, the probabilities q and 1 − q make sense only whenever we want to find the no-arbitrage price of a derivative. The risk-neutral probabilities should not be used when assessing the likelihood of events.
Example 9.3.2 Forward contracts (continued)
We continue example 9.2.4. The risk-neutral pricing formula stipulates that
where
Consequently,
and we find that the forward price is given by F10 = S0B1.
Moreover, as discussed above, it does not make sense for a risk-averse investor to earn the risk-free rate on average on a stock. Therefore,
and we conclude again that the expected stock price (in one period) should be larger than the one-period forward price.
At this point, we should not try to find more financial or actuarial meaning to these new probability weights q and 1 − q. The fact that we can write the initial price V0 as a risk-neutral expectation of the discounted payoff is a (very convenient) mathematical curiosity/coincidence.
The risk-neutral pricing formula is a consequence of the derivation of the replicating portfolio. This portfolio mimics the payoff in each and every scenario, no matter how likely each scenario actually is.
9.4 Summary
One-period binomial model
- Risk-free interest rate: r.
- Risk-free asset price: B = {B0, B1}, where B0 = 1 and

- Risky asset price: S = {S0, S1}, where S1 is a random variable such that

- No-arbitrage condition: sd < S0B1 < su.
- Derivative (written on S): V = {V0, V1} where V1 is a random variable such that

- Simplified tree: up and down factors u > d such that

- Alternative no-arbitrage condition: d < B1 < u.
Trading strategy/portfolio
- Portfolio: a pair (x, y).
- Number of units of S, the risky asset: x.
- Number of units of B, the risk-free asset: y.
- Portfolio’s value: Π = {Π0, Π1} where

Pricing by replication
- A strategy (x, y) replicates V1 if Π1 = V1, i.e. if

- Replicating portfolio for V1:

- By no-arbitrage assumption: V0 = Π0 = xS0 + yB0, i.e.

Pricing with risk-neutral probabilities
- Risk-neutral probabilities: {q, 1 − q}, where

- Risk-neutral pricing formula for a derivative with payoff V1:
- Risk-neutral probabilities are only a mathematical convenience used when pricing under no arbitrage.
9.5 Exercises
-
Find the initial price of the following derivative: it provides one unit of the risky asset at time 1.
-
A stock currently trades for $23 and a 3-month zero-coupon bond sells for $99. In 3 months, a share of stock can take two possible values: $22 and $25. Is there an arbitrage opportunity between the stock and the bond? If it is the case, explain how to exploit such arbitrage.
-
The 6-month Treasury rate is 2% (compounded annually). We can find a share of stock of ABC inc. currently trading for $37 that can take only two possible values in 6 months: $38 or $40. Is there an arbitrage opportunity between the stock and the bond? If it is the case, explain how to exploit such arbitrage.
-
Your company sold an at-the-money put option on a stock currently selling for $75. The stock may sell for $70 or $85 in a year from now. Assume that the 1-year Treasury rate is 2.75% (compounded annually).
- What should be the no-arbitrage price of the put option?
- How many shares of the stock should you buy/sell at inception such that your company cancels out the liability tied to the put option?
-
A derivative pays $3 when the stock price goes up to $37 and the derivative pays $6 when the stock price goes down to $34. If the current stock price is $35 and the 3-month Treasury rate is 1% (compounded annually), find the number of units of stock and risk-free bond to exactly replicate this 3-month derivative.
-
A share of stock currently sells for $50 and can take up two values in a year: $57 or $48. It is believed by financial analysts that the probability of the stock going up is 85%.
- What is the expected return on the stock?
- If a 1-year Treasury zero-coupon bond currently sells for $97, what is the no-arbitrage price of a 52-strike call option?
-
A share of stock sells for $52 and can go up by 5% within 3 months or down by 2% in the same period. A 3-month zero-coupon Treasury bond trades for $98.67 (face value of 100). Experts are unanimous on the outlook of the stock: they agree the probability of the stock going up is 75%. An at-the-money call option is issued.
- Compute the risk-neutral probabilities.
- What is the probability of the call option maturing out-of-the money?
- What is the expected payoff from the call option?
- What is the no-arbitrage price of the call option?
-
A 5-year at-the-money put option is sold as protection against long-term bear markets. The stock currently trades for 100 and may increase to 130 or decrease to 50 over the next 5 years. The 5-year Treasury rate is 4.23% (compounded annually). According to an expert, the probability of the stock going down is only 15%.
- What is the expected 5-year return on this stock?
- What is the expected payoff on this put option?
- Compute the present value (at the Treasury rate) of the expected payoff of this option.
- What is the no-arbitrage price of the put option?
- The issuer sells this put option for 1.25 times the amount in (c). Does it correspond to the no-arbitrage price?
- Suppose the market is frictionless. Explain how to exploit the arbitrage opportunity, if any.
- Suppose the market is frictionless with the exception that small investors cannot sell the put option. Does this affect your answer in (f)?