
In this chapter, we will cover the following topics:
- Breakpoints
- Console
- Debug view hierarchy
- Data tips and quick look
- Debug gauges
Everyone knows that debugging is twice as hard as writing a program in the first place. So if you are as clever as you can be when you write it, how will you ever debug it? | ||
| --Brian Kerninghan | ||
No one writes code with the intention of introducing bugs. However, there are situations where despite the best intentions our worst nightmare comes true—the code crashes. Even with the new advancements that check for code issues and type-safe code, to make a long story short, even then bugs can creep in and cause crashes. Crashes and bugs are not just code errors; they could be missing or unreferenced libraries. There could also be a case where you might be attempting to optimize your code. Debugging provides you with a way to go through your code, and Apple has a whole heap of tools and utilities to help you achieve this task.
When you run your project, it opens up in the Simulator or the device (mainly in the simulator). You can stop it from running with the stop button. Clicking on the stop button returns you to your code. You can then update your code and rerun the project. Everything is fine but, if there was an error while the project was running, it goes back to Xcode and displays a source, either your own source code or some other code where the error occurred. However, instead of waiting for errors to break your code and provide you with an opportunity to debug it, you could set breakpoints. Breakpoints are, as the name suggests, points in your code that cause the running code to break (go to debugging mode) when the execution reaches that point.
One of the ways in which most developers try to resolve errors is by including statements that output some text and check what happened or is happening. This could work for some. However, these will have to be removed when you build your application for release. Then, there are times when your code does not do what you expect. For example, it loads the wrong image or does not display one, and so on. This will not crash your code and hence will not bring up the debugger, but you might still want to know the reasons why it did not work. The worst thing after an application that crashes is an application that does not do what it is expected to do.
Creating a breakpoint is quite simple; just click on the line number in the code editor and you will see a blue mark on that line. Click on it again and it will turn lighter indicating that the bookmark is inactive. Removing a bookmark is easy; simply drag the bookmark onto the code and it will turn into a dust ball and be removed once you release the drag.
There are additional types of breakpoints, as follows:
- Exception breakpoints
- Symbolic breakpoints
- OpenGL ES error breakpoints
- Test failure breakpoints
On the breakpoints navigator screen, the + button at the bottom can be used to add these additional breakpoints.
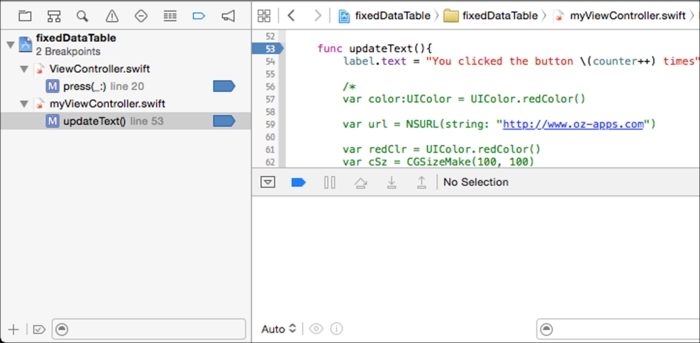
The breakpoint navigator (CMD + 7) displays all the breakpoints. The listing displays the source file and the line number where the breakpoint is created. Clicking on these breakpoints will quickly navigate to the location in the code where the breakpoint is set:
When Xcode breaks execution at a breakpoint, it offers you a couple of options to work with the code. You can continue executing the code (unless there is an error, which is equivalent to a crash if it was not being debugged). Then, there are the options to step over, step into, and step out, hierarchy view and location:
- Step over: This executes the line or function and goes to the next line
- Step into: This executes the line or jumps to the function being called
- Step out: This exits the function and jumps to the line of code it was called from
- Hierarchy view: This allows you to see all the elements on the screen
- Location: This allows you to set the location for the simulator since it does not have GPS capabilities

Xcode also displays a list of variables in the current module and function. These variables can be expanded, viewed, inspected, and even printed onto the console. The variables also display their type, which can be useful to determine the type of the variable when debugging.
When an error occurs in your code, there are a questions that need to be answered to help get a solution for the crashing code:
- What happened and why has the code stopped execution? Xcode displays this on the right-hand side of the editor.
- Which code resulted in this outcome? This line of code is highlighted in green with the reason why the code stopped execution.
- Investigate the variable and its values. Xcode displays the list of variables and their values just under the debug toolbar.
- Lastly, fix the code as required and step through the code.
The console is the area that displays all your system-generated messages and the messages that are printed using println or NSLog. The messages are displayed only when the application is running. This console provides interactivity when in debug mode. In interactive mode, you can view the values of variables and objects, run the debugger commands, inspect code, evaluate it, step through it, and even skip code.
For most developers that are new to debugging with Xcode, the GUI is self-sufficient and provides all the tools and icons to access these tools. However, if you want to use the command line in the console, you have the lldb commands at your disposal. Some of the commands that might be useful are as follows:
thread info: This displays information about the thread including the reason why the break occurred.thread backtrace: This dumps the trace and the frames. This information is displayed graphically as the thread information, which you can see in the previous screenshot.frame select n: This is quite useful when you are trying to focus on what the piece of code being executed is. It displays a couple of lines of source code around the line of that frame.br: Theborbrcommand allows you to work with breakpoints. Although you can set the breakpoints by simply clicking on the line in which you want to set them, you can also do this from the console. However, these do not set visual breakpoints:br l: This lists all the breakpoints that are set.b function_name: This sets a breakpoint for a function.b filename:line: This sets a breakpoint in the file specified by the filename at the specified line number.br del num: This deletes the breakpoints. Use the list command to see a list of the breakpoints that are set.br m –c "condition": This sets the condition for the breakpoint.
When you list the breakpoints, it displays detailed information about the breakpoint and also the number of times the breakpoint was reached.
A life saver in the console is the command po, which is the short for ‘print out’. This simply prints out the value of the variable following the po command. Sometimes this is more useful as you can use this to cast the values. For example, po theData as myClass.
The ability to switch to the
REPL mode (Read-Evaluate-Print-Loop) is new in Xcode 6. The REPL mode is specific for Swift. Getting into the REPL mode is as simple as typing repl in the console. Once you're in the REPL mode, you can type in the Swift commands or even write functions that can call or be called from your code. When you are done, simply type : to exit the REPL mode back to the lldb debugger.
When you reach a breakpoint or an exception/error, you can look at the information that is displayed; but what does it all mean? Here's a quick look at the information displayed and how to use it to debug and resolve the issues.
First, when the execution is interrupted either by reaching a breakpoint or an exception or by physically stopping the execution, lldb displays the reason for the code interrupting execution and all the frames and threads, as relevant.
To quickly understand debugging, let us create a new single-view project and call it myDebugging. Now, open the ViewController.swift file in the editor and add the code immediately after the ViewController class declaration line:
var counter = 0
Next, add the following code to the viewDidLoad function:
NSTimer.scheduledTimerWithTimeIntervals(0.5,
           target: self,
         selector: "runme:",
         userInfo: nil,
          repeats: true)
Lastly, create a function called runme. This function is called every time the timer that we created in the previous code fires:
func runme(timer:NSTimer) {
    counter++
    if counter <= 10 {
        println("timer fired (counter)")
    } else {
        timer.invalidate()
    }
}
Now, when we run the project, it displays timer fired 1, goes on till 10, and then stops printing. This is because of the timer.invalidate function that stops the timer from firing more events.
To start debugging, click on the line that has func runme. So, now whenever the function is called, Xcode will go to the debug mode.
You will notice that the line is highlighted and, to the right, Thread 1: breakpoint 1.1 is displayed. This means that the code has stopped because of a breakpoint.
We asked a couple of questions earlier, among which was: What caused the break? We can see the reason for the break in the code editor and also type thread information into the console. It will display something like the following code:
thread #1: tid = 0x1302c, 0x00000001006afab3 debugging`debugging.ViewController.runme (timer=0x00007fb6c1b6d250, self=0x00007fb6c0d23e70) (ObjectiveC.NSTimer) -> () + 19 at ViewController.swift:34, queue = 'com.apple.main-thread', stop reason = breakpoint 1.1
You can see that debugging`debugging.ViewController.runme is the representation of <Project>`<Folder>.<ClassName>.<function>. It simply means that the project is called debugging and the folder in this case is also called debugging. The class name for this is ViewController and the function is called runme. Further down, you can see ViewController.swift:34 that indicates a human-readable form for the source filename and the line where the breakpoint is created.
Let's list out the breakpoints. We can list them by typing the br l command in the console; it will display something like this:
Current Breakpoints:
1: file = '/Users/Jayant/Desktop/Projects/debugging/debugging/ViewController.swift', line=33, locations = 1, resolved = 1, hit count = 1

 1.1: where = debugging`debugging.ViewController.runme (debugging.ViewController)(ObjectiveC.NSTimer) -> () + 19 at ViewController.swift:34, address = 0x00000001006afab3, resolved, hit count = 1
We can inspect the variable counter by using the po counter command; if this were the first run, it would return the value of 0. We can also modify the value by using the expr counter = 5 command; this will set the value of the counter to 5. You can click on the Continue button to continue running the code till the next breakpoint stops it (or use the key combination CTRL + CMD + Y).
The scope of this chapter is a simple introduction and this can be a bit difficult to take in at one go; so play around with it and try the commands listed in this chapter. If you get stuck, just stop the project and rerun it.
If you have worked on a Mac, you would be aware of the Quick Look functionality. It provides a way to quickly see a file's contents without having to open it in the associated application. As you saw earlier in Chapter 3, Playgrounds, with Xcode you can now visualize objects and structs such as CGRect, CGPoint and so on. However, when it comes to your own classes, Xcode does not know how to render these. Your class can be an image, a text, or a combination of these. For example, if our object is an employee class, should it display the image, the employee number, or the employee name? The choices or options are endless. However, you are the best judge to decide the best way to visualize the employee class. So, Xcode provides us with a function that we can use to visualize the class as per our specifications.
Let us see how Quick Look works with our custom class that we created in the previous chapter. After opening the project, click on the myViewController.swift file and add the following code before the last curly bracket:
func debugQuickLookObject() -> AnyObject {
    return "This is the custom preview text"
}
Create a breakpoint on the viewDidLoad function. Now, if you run the application, you can see it in the self variable in the watch list, as shown in the following screenshot:

Creating a breakpoint on the viewDidLoad function
In the context of this example, the self variable refers to myViewController. You can click on it and then click on the little icon that looks like an eye. This displays a pop over with the visual representation of the custom class. In this case, since we return a string value, it displays the text in the pop-up, as shown in the preceding screenshot.
We can alternatively return a UIImage object or draw on one and return it. We can also render the current view to show what we have on the screen. This is relatively simple. Replace the debugQuickLookObject function with the following code:
func debugQuickLookObject() -> AnyObject {
    let theView = self.view
    UIGraphicsBeginImageContextWithOptions(theView.bounds.size, false, 0)

    if !theView.drawViewHierarchyInRect(theView.bounds, afterScreenUpdates:true) {
        theView.layer.renderInContext(UIGraphicsGetCurrentContext())
    }
    let image = UIGraphicsGetImageFromCurrentImageContext()
    UIGraphicsEndImageContext()
    return image
}
Using images with quick view
When an application is running, it is made up of a hierarchy of windows and views. As you create elements, they are combinations of views and subviews. This is similar to what we saw in the previous chapter where we subclassed a UIView with our custom class to create the custom control.

While debugging, you can inspect the variables, the code, and so on, and investigate any code issues. However, if a particular view is presented in an unexpected order other than and gets covered, it will not be seen. You could spend a lot of time trying to debug the code before you discover that your text or image was covered by another one. When you use the hierarchy view, you can see all the views exploded and you can also rotate the view to display all of them. Apple introduced this feature in Xcode 6 and it offers options to display the views along with their attributes. These attributes can be inspected in the inspectors.

When you start an application, the navigation viewer changes to the debug view where you can see some gauges. These gauges provide you with information about features such as CPU usage, memory usage, and so on. This also displays all the threads running with the functions:

Debug gauges
The CPU report displays information about the process that is being run. In the preceding screenshot, the Memory report is displayed and you can see that 17.6 MB of memory is in use by the application, 0.43 percent of the total available memory. The Usage Comparison report shows the memory in use by other processes. This is clearly running in the simulator on a Mac with 4 GB of RAM. When you are testing and optimizing, you must use a device.
Similarly, there are gauges for CPU usage, disk usage, and network usage. Therefore, I you added functionality for other features such as iCloud, and so on, then the appropriate gauges for these would also be displayed.