Chapter 32: Managing Programs and Processes
IN THIS CHAPTER
Starting and using Task Manager
What to do when your system freezes up
Viewing running processes
Monitoring performance and resource use
You are no doubt familiar with the terms application and program. These two terms describe program code that, whether one component or several components, serve a specific function. For example, a word processor is an application. Some applications, however, comprise multiple processes running at the same time. In addition, a process can comprise multiple threads of execution, each performing a specific task. Although you typically concern yourself with programs, you sometimes need to think about the processes that make up a program, particularly if one of those processes fails. That's where Task Manager comes into play.
Task Manager is a program included with Windows 8.1 for viewing and managing running programs and processes. You can use it to seek out performance bottlenecks, close hung programs and processes without restarting the system, and more.
Getting to Know Task Manager
Task Manager is a program that lets you view and manage running programs and processes, as well as view performance data for your computer and network. In Windows 8.1, Task Manager has changed from releases prior to Windows 8. If you're familiar with Task Manager in Windows 7, for example, you're in for quite a change with the new (and, in our opinion, improved) Task Manager.
You can start Task Manager in several ways:
- Press Ctrl+Alt+Del and click Start Task Manager.
- Right-click the clock or an empty spot on the taskbar and choose Start Task Manager.
- Display the Charms Bar, click Search, and type task. Click Task Manager on the Apps screen.
Figure 32.1 shows the new Task Manager and a number of apps and programs running. Task Manager behaves much like any program window. It has a button on the Windows taskbar when open. You can drag the program window around by its title bar and size it by dragging any corner or edge. You can also configure it so it stays on the top of the stack of open windows so you can always see it. You can change that by right-clicking a blank area on the window or on the bottom of the window and choosing Always On Top.
Figure 32.1
Task Manager in its normal view.

Viewing more and less detail
With Windows 8.1 Task Manager, you have the choice of showing a list of just the running applications, as shown in Figure 32.1, or a display with multiple tabs filled with system and application data (as shown in Figure 32.2). The former view shows fewer details while the latter shows more details. When showing less detail, you have fewer options for controlling and viewing application information, but you can still stop an app or application.
Figure 32.2
Task Manager in its detailed view.

To switch between detail views, click the More Details button on the bottom of Task Manager. When viewing the More Details view, you can click the Fewer Details button to display the less details view.
Choosing Task Manager views
While viewing Task Manager in the More Details view, you can view and use Task Manager in several ways. On the Options menu in the menu bar, you have the following options:
- Always On Top: Choosing this option ensures that Task Manager is always on the top of the stack when it's open, so no other program windows can cover it.
- Minimize On Use: If selected, this option minimizes Task Manager whenever you choose the Switch To option to switch to another running program.
- Hide When Minimized: Normally when you minimize Task Manager, only its taskbar button remains visible. Choosing this option also hides the taskbar button when you minimize Task Manager.
- Show Full Account Name: When viewing information on the Users tab, you show the full user account name in the User column.
- Show History for All Processes: This option activates when you select the App History tab. It shows your resource usage history for the past month.
Whenever Task Manager is open, you'll see a small greenish blue square in the notification area unless Task Manager is configured to show notifications only. Pointing to that icon displays the current CPU (central processing unit) usage, as shown in Figure 32.3. When Task Manager is minimized, you can double-click that little square to bring Task Manager back onto the desktop.
Figure 32.3
The Task Manager notification icon.
If you prefer to have Task Manager show only notifications and not appear in the tray, click the Show Hidden Icons button on the tray and choose Customize. In the notification area Icons applet, find Task Manager in the Icons list, choose Only Show Notifications from the drop-down list, and click OK.
On the View menu in Task Manager, you have the following choices, as shown in Figure 32.4:
- Refresh Now: Causes Task Manager to refresh all its data immediately, regardless of the Update Speed setting.
- Update Speed: Task Manager needs to use some computer resources to keep itself up to date with what's happening in the system at the moment. The Update Speed option lets you choose how often Task Manager updates itself, as follows:
- High: Updates Task Manager twice per second.
- Normal: Updates Task Manager every two seconds.
- Low: Updates Task Manager every four seconds.
- Paused: Updates Task Manager only when you choose View ⇒ Refresh Now.
- Group by Type: Shows apps, Windows process, and background processes in groups.
- Expand All: Expands the lists of apps and processes to show any open documents, open websites (if you're running Internet Explorer or another browser), and subprocesses.
- Collapse All: Collapses the list of running apps and processes.
- Status Values: Displays on the Processes tab only and shows the status of suspended processes.
Figure 32.4
Task Manager's View menu.

Not Responding? Task Manager to the Rescue
One of Task Manager's most useful roles is that of dealing with problems that cause programs, or your whole computer, to hang (freeze up, so that the mouse and keyboard don't work normally). Even when you can't get the mouse or keyboard to work, pressing Ctrl+Alt+Del and choosing Start Task Manager may get Task Manager open for you.
Closing frozen programs
Once Task Manager is open, select the Details tab, as shown in Figure 32.5. If a particular program is hung, its Status column usually reads Not Responding rather than Running. To close the hung program, click its name in the Name column, and then click the End Task button, which appears at the bottom right of the window. Task Manager tries to close the program normally, so that if you were working on a document at the time, you may be able to save any changes. (So, don't expect the program to close immediately.)
Figure 32.5
Task Manager's Details tab.

If the program won't close, you'll see a warning that moving ahead will close the program and leave unsaved work behind. To forge ahead, click End Process. The program may try to restart itself, depending on how it's designed.
Most likely, a process of reporting the problem and finding a solution will start after you end a program in this way. If you choose to allow Windows to send information about the program error, Windows sends information to a database of problems and searches that database for known problems and their solutions. You won't always get a solution to the problem, but you may receive information about an incompatible device driver or other issue by allowing Windows to report the problem.
If you don't have time to wait through that whole reporting process, you can cancel out of each dialog box by clicking its Cancel button.
Switching and starting tasks
If the system is hung in such a way that you can't use the taskbar normally, and you want to work with open program windows individually, Task Manager provides some ways to accomplish that.
To bring a running program to the top of the stack of windows on the screen and make it the active window, click its name in the list of running tasks on Task Manager's Fewer Details screen, and then click the Switch To button. If you were working on a document in that program, you can save your work, and then exit the program normally (assuming that program is running normally).
If you need to bring up a diagnostic program or debugger, or simply need to start some other program, and you know the startup command for that program, right-click and choose Run New Task. The Create New Task dialog box, shown in Figure 32.6, opens. Type the startup command for the program (or the complete path to the program, if necessary), and click OK. You can also access this dialog box when in the More Details view. Choose File ⇒ Run New Task.
Figure 32.6
The Create New Task dialog box.

Restarting a hung computer
If your computer is so locked up that you can't get to Task Manager, or stop the offending program, you can try other things. If pressing Ctrl+Alt+Del works, you are taken to a Windows 8.1 screen with four options: Lock, Switch User, Sign Out, and Task Manager. You also have the Shut Down option at the lower right of the screen. Logging off or restarting will likely be your best bet. If at all possible, Windows attempts to give you a chance to save any unsaved work.
If the program that's hung is also the one that contains the unsaved work, there may be no way to save that work. You may have to restart without saving. For this reason, you should save your work often.
Monitoring Performance with Task Manager
In addition to helping you deal with hung programs, Task Manager lets you see which processes in your system are using computer resources. On the Performance tab, as shown in Figure 32.7, you can see these key resources. The Performance tab in Task Manager provides both graphical and numeric summaries of CPU, memory, disk, and network hardware resource usage. To watch resource usage, leave Task Manager open and always on top as you run programs and use your computer in the usual ways. If you have multiple processors or a multi-core processor, each may be represented in a separate pane in the CPU history, as shown at the top of the figure.
The Performance charts are useful for identifying major performance bottlenecks. For example, if the CPU charts run high, your CPU is working very hard. An errant application can consume inordinate amounts of CPU capacity. Also, reducing the number of running programs reduces CPU load.
A common performance bottleneck is limited physical memory. Running lots of programs when memory is limited forces the system to use lots of virtual memory, which in turn slows down performance because of the added overhead of swapping pages in and out. Increasing the amount of virtual memory (as discussed in Chapter 36) can help, but the best solution is to add more RAM (physical memory) to the system.
Figure 32.7
The Performance tab shows performance data.

Some of the resources you may see include the following:
- CPU: Shows information about your computer's central processing unit. Data includes utilization, speed, processes, threads, handles, and up time. The bar graph shows a 60-second view of the CPU usage. Refer back to Figure 32.7 for an example of the CPU data.
- Memory: Provides data about the RAM on your computer, including the amount of RAM in use, how much is available on your computer, the committed memory (RAM plus virtual memory), cached memory, the Windows page pool, and the non-page pool (shown in Figure 32.8).
Figure 32.8
The Performance tab shows memory data.

- Disk: Provides data about your installed hard disks, including disk transfer rate, active time in percentage, average response time, disk read speed, and disk write speed (shown in Figure 32.9).
Figure 32.9
The Performance tab shows disk data.

- Bluetooth: Provides performance data about your Bluetooth devices.
- Wi-Fi: Displays data about wireless network devices installed on your computer. You can see send and receive data (see Figure 32.10).
Figure 32.10
The Performance tab shows Wi-Fi data.

Exactly how fast your computer runs at any given moment depends on the resources available to it at that moment. For example, if you have half a dozen programs running, all doing intensive tasks, they're eating up CPU resources. If you start another program, that program may run slower than usual, because the other running programs are consuming CPU resources.
Likewise, everything you open stores something in RAM. If RAM is nearly full, and you start another program that needs more memory than what's currently left in RAM, Windows has to start sloughing some of what's currently in RAM off to the hard disk (called virtual memory) to make room. It takes time to do that, so everything slows down.
Managing Processes with Task Manager
Whereas applications usually run in windows and are listed on the Processes tab in Task Manager, processes have no program window. We say that processes run in the background because they don't show anything in particular on the screen.
Your running applications are actually one or more processes. To see all currently running processes, select the Processes tab in Task Manager. Each process is shown under the Windows Process category heading, as in the example shown in Figure 32.11.
The Processes tab shows its information in columns. To help you differentiate between data values (that is, for data points that are low, medium, or high), Windows 8.1 uses a “heat map” paradigm. This type of display lets you look across columns and rows and data that represent different types of data (CPU, memory, disk, and network usages) and get a quick view of the data and see any hot spots in the values. For example, if memory usage for a process or application is high compared to other running processes or applications, the heat map shows a brighter orange color. Lower values are in lighter shades, such as light tan or light yellow. Microsoft designed these heat maps to allow users to visualize and digest the information quickly.
Figure 32.11
The Processes tab in Task Manager.

You can sort items by clicking any column heading. For example, you can click the Memory column to sort processes by the amount of memory each one takes up, in ascending order (smallest to largest) or descending order (largest to smallest). Seeing those in largest-to-smallest order lets you know which processes are using up the most memory.
Here's what each column shows:
- CPU: The percent of CPU resources that the process is currently using
- Memory: The amount of memory the process is currently using
- Disks: The amount of disk resources the process is currently using
- Network: The amount of network resources the process is currently using
Memory usage is probably the main cause of slow-running computers. The more stuff you cram into RAM, the more Windows has to use the paging file, and hence the slower everything goes. You can see which processes are hogging up the most RAM just by clicking the Memory column heading until the largest numbers are at the top of the list.
Showing other columns
Windows 8.1 Task Manager provides additional columns of data that you can view on the Process tab. To see these columns, right-click on the column area. A menu appears with the names of the available columns, including the following ones that are not shown by default:
- Type: Displays the same information at the group type, such as App, Background Process, or Windows Process
- Publisher: Name of the company that produces the application
- PID: Process ID number, which is a unique number created by Windows for each process that is running.
- Process Name: Shows the executable name of the process
- Command Line: Shows the path to the source file of the process
Figure 32.12 shows what Task Manager looks like when you turn on all the columns. The information shown in the default columns (CPU, Memory, Disks, and Network) appears on the far right of Task Manager, and in this example the window is too wide to fit in this screen shot.
Figure 32.12
The Processes tab with additional columns showing.

You can resize columns by dragging the separator line between the columns.
Common processes
You can end any running process by right-clicking its name and choosing End Task (or by clicking its name and clicking the End Task button). But doing so isn't a good idea unless you know exactly what service you're terminating. If a process represents a running program with unsaved work, ending the process will close the program without saving the work.
Some processes are required for normal operation of the computer. For example, Desktop Window Manager and Runtime Broker are important parts of Windows 8.1 so you definitely don't want to mess with those.
If you're unsure about a process, you can search for it by name on Google, Bing, or any other search engine. Just be sure to check out multiple sources and read carefully. Virtually every resource you find will tell you that perfectly legitimate and necessary processes such as dwm.exe and explorer.exe could be a Trojan, spyware, or other malicious item. But could is not synonymous with is. So, read carefully and don't assume the worst.
Choosing columns on the Details tab
The Details tab on Task Manager provides additional ways to analyze performance issues with running processes. The columns that display by default are Name, User Name, CPU, Memory, Status, and Description.
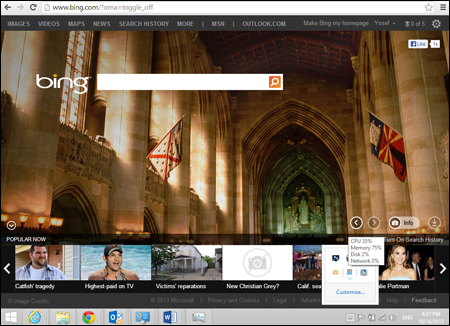
You can choose to display other columns here in case you need to capture different types of data about a particular problem you're having with a program or Windows in general. To choose other columns to view, right-click the column area and choose Select Columns. The Select Columns dialog box appears (as shown in Figure 32.13). Each column shows some detail of the process, mostly related to resource consumption. A programmer might use this information to fine-tune a program she's writing. Beyond that, it's hard to think of anything terribly practical to be gained from this information. But here's a quick summary of what the other, optional columns show:
- Base Priority: The priority assigned to the process. When the CPU is busy, low-priority processes have to wait for normal and high-priority processes to be completed. To change a process's priority, right-click its name and choose Set Priority.
- Command Line: The command, with parameters, that was used to initiate the process.
- CPU Time: Total number of seconds of CPU time this process has used since starting. The number will be doubled for dual-processor systems, quadrupled for systems with four processors.
- CPU: The amount of processor time, as a percent of the whole, this process has used since first started (the CPU column).
- Cycle: Current percent of CPU cycle time consumption time by the process.
- Data Execution Prevention (DEP): Specifies whether DEP is enabled or disabled for the specified process. DEP is a set of hardware and software technologies that help prevent malicious code from running by marking some areas of memory as non-executable.
- Description: A description of the process.
- Elevated: Specifies whether the process is being elevated or not.
- GDI Objects: The number of Graphics Device Interface (GDI) objects used by this process, since starting, to display content on the screen.
- Handles: The number of objects to which the process currently has handles.
- I/O Other: Non-disk input/output calls made by the object since it started. Excludes file, network, and device operations.
- I/O Other Bytes: The number of bytes transferred to devices since the process started. Excludes file, network, and device operations.
- I/O Reads: The number of file, network, and device Read input/output operations since the process started.
- I/O Read Bytes: The number of bytes transferred by Read file, network, and device input/output operations.
- I/O Writes: The number of file, network, and device Write input/output operations since the process started.
- I/O Write Bytes: The number of bytes transferred by Write file, network, and device input/output operations.
- Image Path Name: The path to the executable specified in the Image Name column.
- Working Set Delta (Memory): The amount of memory used by the process (also called the process's working set) since starting.
- Peak Working Set (Memory): The largest amount of physical memory used by the process since it started.
- Working Set Delta (Memory): The change in memory usage since the last Task Manager update.
- Memory (Private Working Set): The amount of memory allocated to the process's private data.
- Memory (Shared Working Set): The amount of memory allocated to the process's shared data.
- Commit Size: The amount of virtual memory currently committed to the process.
- Operating System Context: Specifies the operating system context in which the process is operating.
- Paged Pool: The amount of system-allocated virtual memory that's been committed to the process by the operating system.
- NP Pool: The amount of physical RAM used by the process since starting.
- Page Faults: The number of times the process has read data from virtual memory since starting.
- PF Delta: The change in the number of page faults since the last Task Manager update.
- PID: A number assigned to the process at startup. The operating system accesses all processes by their numbers, not their names.
- Platform: Specifies whether the process is running on a 32-bit or 64-bit platform.
- Session ID: The Terminal Session ID that owns the process. Always zero unless Terminal Services are in use on the network.
- Status: Shows if the process is running or suspended.
- Threads: The number of threads running in a process.
- UAC Virtualization: Specifies whether User Account Control (UAC) is virtualized for the specified process. When enabled, data is written to a user area rather than to a system area.
- User Name: The user, user account, or service that started the process.
- User Objects: The number of objects from Window Manager used by the object, including program windows, cursors, icons, and other objects.
Figure 32.13
Picking additional columns for the Details tab.
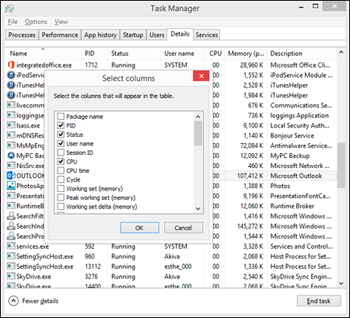
App History tab
The new Windows 8.1 Task Manager includes the App History tab shown in Figure 32.14. This tab lists all the apps that you've used on this computer since a given time. By default, you can see history since the time you installed Windows 8.1. In actuality, you may want to click the Delete Usage History link periodically to remove all old app history. This will limit the amount of data Windows keeps stored in a log file somewhere on your hard drive.
Figure 32.14
The App History tab in Task Manager.
The columns available on the App History tab include the following:
- Name: The name of the app that has been used
- CPU Time: The amount of CPU time consumed by an app
- Network: The amount of network data utilized by an app
- Metered Network: The amount of metered network resources consumed by an app
- Tile Updates: The amount of resources used for updating Windows 8.1 app tile information
- Non-Metered Network: The amount of network data consumed by an app that is not considered metered data
- Downloads: The amount of data an app downloads from the Internet or other network resource
- Uploads: The amount of data an app uploads to a network resource
To launch an app or see related apps under a category of apps (look for an arrow to the left of a name), double-click the app name.
Startup tab
The Startup tab shows a list of the apps that start when you start Windows 8.1. Figure 32.15 shows an example of the Startup tab and the application that will start at boot up time. In this example, only one application will start when Windows starts.
Figure 32.15
The Startup tab of Task Manager.
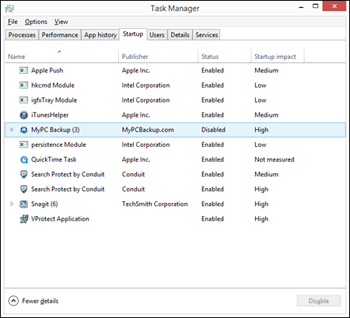
The columns on this tab include the following:
- Name: The name of the app that will start at boot time
- Publisher: The company that distributes the app
- Status: Lists either Enabled or Disabled depending on whether the app will (Enabled) or will not (Disabled) start at boot time
- Startup Impact: Shows a relative rating of the impact the app will have during boot time
- Startup Type: Shows the type of app that starts, such as one that is hidden (such as running from a Registry key), or one that launches from the interface
- Disk I/O at Startup: Displays the amount of memory used at startup by the app
- CPU at Startup: Displays the amount of CPU resources used at startup by the app
- Running Now: Lists only those apps currently running under Windows
- Disabled Time: Lists the amount of time the app is disabled
- Command Line: Shows the hard drive path of the listed app
If you don't want the app to start at boot time, select it and then click the Disable button.
Users tab
The Users tab in Task Manager displays information about your user accounts. The Users tab (shown in Figure 32.16) shows the names of people currently logged in to the computer. Most users will see only themselves, even if other users are logged in.
Figure 32.16
The Users tab of Task Manager.
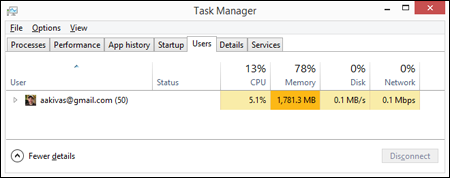
If your system is running slowly because users are not logging out of their accounts, you can send a message to those users asking them to log off when done using the computer. Click a username and click Disconnect to disconnect that user. Any unsaved data will be lost. In general, this is a bad idea, so try to get the user to log off normally before taking this action.
To see the apps and processes that a user uses, double-click the username. Figure 32.16, for example, shows the apps listed under the aakivas user.
The Users tab includes the following columns:
- ID: A unique integer for each user signed on to the computer
- Session: The type of session, including console or remote
- Client name: The name of a computer (“client”) connected to your computer
- Users: The name of the user logged into the computer
- Status: Whether an app is suspended or disabled
- CPU: The amount of CPU a user is using
- Memory: The amount of RAM a user is using
- Disk: The amount of disk resources a user is using
- Network: The amount of network resources a user is using
Services tab
The Services tab provides a view of the services running under Windows. This tab is discussed in more detail in Chapter 11.
Wrap-Up
A new Task Manager is available in Windows 8.1. Task Manager is a handy tool for terminating hung programs (programs that are not responding) and for monitoring computer resource usage. Task Manager also provides detailed information that's of interest only to programmers and network administrators. The following are the main things to remember about Task Manager:
- To open Task Manager, press Ctrl+Alt+Del and click Start Task Manager, or right-click the time and choose Start Task Manager.
- The Processes tab shows the names of all running applications. To end a program that's not responding, right-click its name and choose End Task.
- To see which process an application relates to, right-click the application name and choose Go to Details.
- The Processes tab shows all running processes, including application programs, background programs such as antivirus software, and operating system processes.
- The Performance tab presents a bird's-eye view of overall CPU and memory usage.
- The Users tab shows which users are currently logged in.