
Chapter Three
Colley’s Method
In 2001, Dr. Wesley Colley, an astrophysicist by training, wrote a paper about his new method for ranking sports teams [22]. This side project of his became so successful that, like one of Massey’s models, it too is now incorporated in the BCS method of ranking NCAA college football teams. His method, which we call the Colley Rating Method, is a modification of one of the simplest and oldest rating systems, the rating system that uses winning percentage. Winning percentage rates team i with the value ri according to the rule

Wesley Colley
![]()
where wi and ti are the number of wins and total number of games played by team i, respectively. The winning percentage method is the prevailing rating method for recreational leagues and tournaments worldwide. In fact, it is also used by most professional leagues. Though simple and easy to use, this rating system does have a few obvious flaws. First, ties in the ratings often occur in sports such as football where most teams play the same number of games against the same set of teams. Second, the strength of opponents is not factored into the analysis in any way. Defeating the weakest opponent in the league earns a team the same advance in the ratings that defeating the strongest team does. This is arguably unfair. Third, there are times when winning percentage ratings give unusual results. For instance, at the beginning of the season all teams have preseason ratings of ![]() and, in addition, as the season progresses a winless team has a rating of 0. To possibly remedy some of these flaws, Wesley Colley proposed a method, which we call the Colley method, for ranking sports teams.
and, in addition, as the season progresses a winless team has a rating of 0. To possibly remedy some of these flaws, Wesley Colley proposed a method, which we call the Colley method, for ranking sports teams.
The Main Idea behind the Colley Method
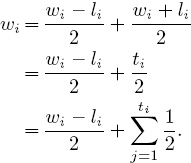
The Colley method begins with a slight modification to the traditional winning percentage formula so that
![]()
In this section we show that the main advantage of this modification is the consideration of strength of schedule, i.e., the strength of a team’s opponents.
Colley’s adjustment to the winning percentage formula comes from Laplace’s “rule of succession” [29] used to find a marker on a craps table. Though this modification to the traditional winning percentage formula appears quite modest, it has several advantages over the traditional formula. Instead of the nonsensical preseason ratings of ![]() , each team now begins the season with equal ratings of
, each team now begins the season with equal ratings of ![]() . Further, when team i loses to an opponent in week one of the season, Colley’s rating produces ri =
. Further, when team i loses to an opponent in week one of the season, Colley’s rating produces ri = ![]() , which he argues is more reasonable than ri = 0.
, which he argues is more reasonable than ri = 0.
The next advantage to using Laplace’s rule (3.1) rather than standard winning percentage is tied to the notion of strength of schedule. The idea here is that a team ought to receive a greater reward for beating strong opponents as opposed to weak opponents. In effect, the rating of team i should be connected to the ratings of its opponents. Colley argues that Laplace’s rule contains, though hidden away, the strength of team i’s schedule. Notice in Equation (3.1) that all teams start with ri = 1/2, and as the season progresses the ratings deviate above or below this starting point. In fact, one team’s gain (in the form of a win) is another’s loss. As a result these ratings are interdependent. Such interdependence is not apparent from (3.1) and can only be uncovered with a careful dissection. First we decompose the number of games won by a team.
Because all teams start with rj = 1/2 at the beginning of the season, the summation ![]() is initially equal to
is initially equal to ![]() , where Oi is the set of opponents for team i. As the season progresses, the summation
, where Oi is the set of opponents for team i. As the season progresses, the summation ![]() is not exactly equal to
is not exactly equal to ![]() but can be well-approximated by the cumulative ratings of a team’s opponents. (Recall that the ratings always hover about 1/2.) As a result,
but can be well-approximated by the cumulative ratings of a team’s opponents. (Recall that the ratings always hover about 1/2.) As a result,
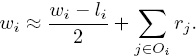
Assuming equality and inserting this into (3.1) produces

Of course, as we have seen with the rating systems in previous chapters, the goal is to find the unknown ri’s. Equation (3.2) shows that, in this case, the unknown ri depends on other unknowns, the rj’s. And this also reveals how Colley’s method incorporates strength of opponents into a team’s ratings. With a little more algebra and the help of matrix notation, we find that the dependency of ri on the other rj’s is not a problem. The ri’s can be computed easily. In fact, Colley Equation (3.2) can be written compactly as a linear system Cr = b, where rn×1 is the unknown Colley rating vector, bn×1 is the right-hand side vector defined as bi = 1 + ![]() (wi − li) and Cn×n is the Colley coefficient matrix defined as
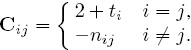
(wi − li) and Cn×n is the Colley coefficient matrix defined as
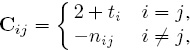
where nij is the number of times teams i and j played each other. It can be proven that the Colley system Cr = b always has a unique solution since Cn×n is invertible.
The Running Example
It is time to test the Colley method on our small example using the data from Table 1.1. The Colley linear system Cr = b is below.
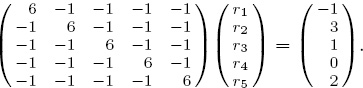
Note that C is a real symmetric positive definite matrix. These properties mean that C has a Cholesky decomposition [54] such that C = UTU, where U is an upper triangular matrix. As a result, if the Cholesky factorization is available, the Colley system Cr = b can be solved especially efficiently. However, for many sports applications, the systems are small enough to allow software packages such as MATLAB to quickly compute the rating vector r by standard numerical routines, e.g., Gaussian elimination, Krylov methods, etc. Applying the Colley rating method to our running example produces the ratings, and hence, rankings, displayed in Table 3.1.
Table 3.1 Colley rating results for the 5-team example
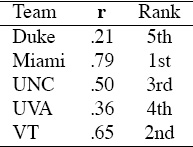
The most glaring attribute of the Colley method is that game scores are not considered in any way. Depending on your point-of-view, this is either a strength or a weakness of the model. Note that UNC and UVA are swapped when compared with the Massey rankings from page 13. This is an interesting consequence of avoiding game scores. The Massey method favored UVA over UNC due to the superior overall point differential of UVA, despite UNC’s better record. Colley argues that by ignoring game scores, his method is bias-free, a word he uses to refer to the method’s avoidance of the potential rating problem created when strong teams run up the score against weak teams. Methods, such as the Massey method, that use game scores can be subject to such bias.
Summary of the Colley Rating Method
Cn×n real symmetric positive definite matrix called the Colley matrix;
ti |
total number of games played by team i |
nij |
number of times teams i and j faced each other |
bn×1 |
right-hand side vector; bi = 1 + |
wi |
total number of wins accumulated by team i |
li |
total number of losses accumulated by team i |
rn×1 |
general rating vector produced by the Colley system |
n |
number of teams in league = order of C |
Colley’s Algorithm
Solve the system Cr = b to obtain the Colley rating vector r.
Listed below are some properties of the Colley method.
• The results of the Colley method are bias-free, meaning that they are generated using only win-loss information and not point score data. Thus, the Colley ratings are unaffected by the existence of teams that purposefully run up the score against weak opponents. Furthermore, some sports or leagues are more prone to large point differentials than others. For example, the differential in a typical NBA game is generally smaller than that in an NCAA basketball game. Consequently, the suitability of the Colley method may depend on the league, sport, or application in question.
• The Colley ratings follow a conservation property. Each team begins the season with an initial rating of 1/2, and as the season progresses a team bounces back and forth above and below this center point depending on its game outcomes. Yet overall, the average ![]() of all ratings ri (i.e.,
of all ratings ri (i.e., ![]() = eTr/n) remains at 1/2. Thus, there is an overall conservation of the total rating. When one team’s rating improves, another team’s must suffer.
= eTr/n) remains at 1/2. Thus, there is an overall conservation of the total rating. When one team’s rating improves, another team’s must suffer.
• The Colley method is also well-suited to non-sports applications in which, in an analogous fashion, the equivalent of point differential data is unavailable or undesirable.
Connection between Massey and Colley Methods
While seemingly quite different in philosophy, there is a striking connection between the Massey and the Colley methods. The methods are related by the formula C = 2I + M. As a result, it is easy to Colleyize the Massey method or vice versa. For example, the original Massey method of Mr = p can be Colleyized as
(2I + M)r = p (which is also Cr = p.)
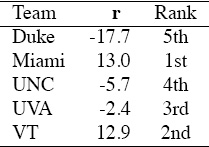
The Colleyized Massey method uses a right-hand side of p, which contains point score information rather than a right-hand side of b, which uses only win-loss information. Further, the addition of 2I to the coefficient matrix adds the Laplace trick and also makes the system nonsingular so that Massey’s “replace an equation” method for removing the singularity is not necessary. The Colleyized Massey method Cr = p is no longer bias-free because point scores have now been incorporated by the use of p. The Colleyized Massey method applied to the running example produces the rating vector r shown in Table 3.2, which produces the same rank ordering as the standard Massey method with numerical values that are slightly different from those in the table on page 11.
Table 3.2 Colleyized Massey rating results for the 5-team example
In a similar fashion, the Colley method can be Masseyized so that the Masseyized Colley method solves the linear system Mr = b.
ASIDE: Movie Rankings: Colley and Massey Meet Netflix
Netflix is a movie rental company that operates online through its virtual location, www.netflix.com. For a monthly subscription fee, Netflix members can choose a certain number of movies to rent each month. These are mailed directly to users and, once viewed, are returned by mail to Netflix. Periodically, Netflix asks users to rate the movies they have rented. This user-movie information is collected and analyzed to help the company make future recommendations to their users. In 2007, Netflix offered a $1 million prize to the individual or group that could improve their current recommendation system by 10%. A small sample of the data that was released for the competition appears below.
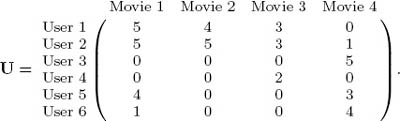
U is a user-by-movie matrix containing ratings. Valid ratings are integers 1 through 5, with 5 being the best score. A 0 means the user did not rate the movie. To apply the ideas of sports ranking to such a matrix we must think in terms of pair-wise matchups between movies. For instance, in order to apply the Colley method to rank movies, we create the movie-movie graph of Figure 3.1 from the rating matrix U. Notice that there are two links between movies 1 and 2. One link has weight 1, because user 1 rated movie 1 one point higher than movie 2. The other link has weight 0 because user 2 also rated both movies, but with the same value. The graph of Figure 3.1 has a link between two movies each time a user rated both movies, one at the head of the link and the tail of the link.
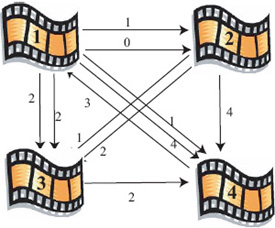
Figure 3.1 Movie-movie graph associated with the Massey method
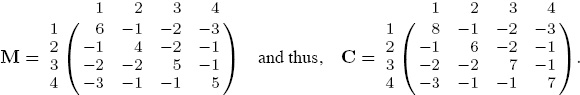
As stated on page 24, the Colley system Cr = b can be built with the Massey matrix by using the identity C = 2I + M. The Massey matrix associated with Figure 3.1 is

The Colley and Massey right-hand side vectors b and p, respectively, are
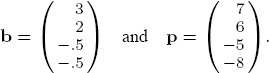
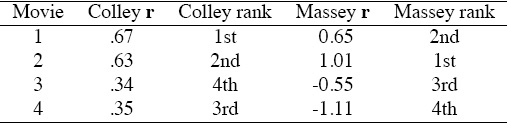
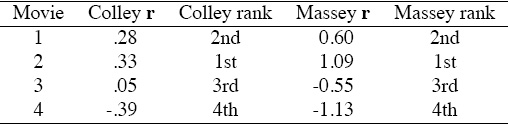
Table 3.3 shows the Colley and Massey ratings of these four movies.
Table 3.3 Colley and Massey rating and ranking vectors for four-movie example
Ties are an issue in this Netflix dataset. Because valid movie ratings are integers from 1 to 5, it will often happen that two users rated the two movies with the same score. If we think such matchups tell us very little about which movie dominated the other, we can simply remove ties from the dataset. In this case, the “no ties” M and C matrices are below.
These produce the “no ties” ratings and rankings given in Table 3.4. Notice that the Colley ranking of these four movies changes according to the handling of ties. This makes the point that ties must be handled carefully, an issue that we take up later in Chapter 11.
Table 3.4 Colley and Massey “no ties” rating and ranking vectors for four-movie example
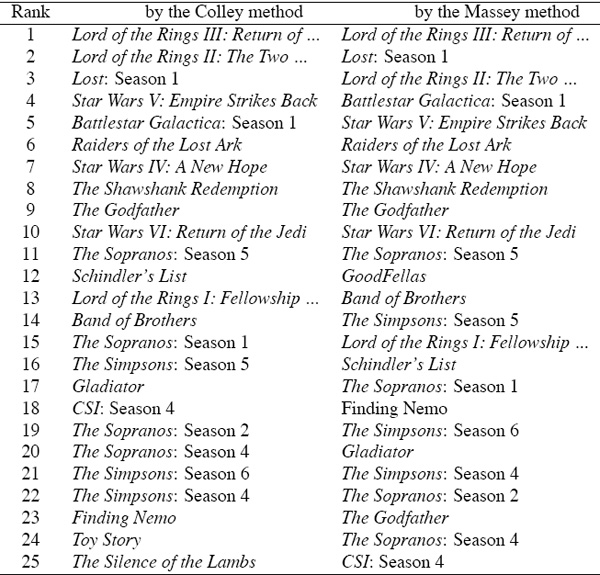
We ran both the Colley and Massey methods on a sample of data from the Netflix Prize competition. This data sample contains all 17,770 movies in the Netflix database (as of 2007), but only a subset of the users. The 13,141 “superusers,” users ranking a thousand or more movies, were selected.1 The fifteen top rated movies according to each method are listed in Table 3.5. Netflix data comes with time stamps marking when a user rated the movie, so improvements are possible by incorporating the time weighting ideas introduced later in Chapter 12.
Table 3.5 Top-25 movies ranked by the Colley and Massey methods
By The Numbers —
$2,782, 275,172 = highest gross amount ever earned by a movie (as of 2011).
— Avatar (released 2009).
$1, 843, 201, 268 = second highest amount (as of 2011).
— Titanic (released 1997).
— en.wikipedia.org
1We thank David Gleich for providing us with this dataset.