
Chapter 25
Showing Actual versus Potential Utilization
Utilization rollup dashboard.
Dashboard designer: Vanessa Edwards
Organization: Creative Performance Inc. (www.creativelyperform.com)

Scenario
Big Picture
You are the principal, chief operating officer, chief financial officer, or director of client services for a marketing agency (advertising, integrated, digital, design, etc.), trying to understand your agency's current performance in billable hours and fee income.
Fee income (also known as labor income) is the main source of revenue for most agencies and is directly linked to billable hours. Understanding where time is being spent across the agency is critical to managing staffing and to overall agency profitability. As direct labor cost is often the largest expense agencies have, to manage profitability effectively, you must be able to monitor labor costs in relation to your fee income and fee targets.
Specifics
You need to:
- Understand how time entry is spent across the agency including:
- billable time on client projects,
- nonbillable time generating new business,
- nonbillable time spent on internal agency projects, and
- nonbillable time spent on internal agency administration.
- See how each department is performing in relation to its target utilization.
- See if a department costs you more than its potential fee income and what you could be making in additional fee income if that department hit its target utilization or a variation of that target.
- See the breakdown of nonbillable time in order to identify the potential cause of low utilization.
Related Scenarios
- You work in a law firm and need to compare billable hours and potential billable hours across departments and by individual attorneys and support staff. (Indeed, this would work for virtually any organization that bills on an hourly basis; e.g., software development, auto repairs, etc.)
- You work at a restaurant and need to track employee hours as well as monitor how resources (ovens, air conditioning) and food are utilized/underutilized.
How People Use the Dashboard
Key Performance Indicators
The numbers at the top of the dashboard represent the agency's current fees as well as the additional potential fees that could be made if the agency met its target. (See Figure 25.1.)

Figure 25.1 Key metrics appear at the top of the dashboard along with a bullet chart.
The numbers at the top of the dashboard represent the agency's current fees as well as the additional potential fees that could be made if the agency met its target. In addition, the numbers show how overstaffed an agency is based on its current workload as well as the amount of gross billable dollars or opportunity cost an agency is spending both on itself and on generating new business.
- Fees = Total amount of billable work that could be converted into labor income
- Potential = Additional labor income that could be generated if billable targets are met
- New Biz + Opportunity = Gross rates of billable employees spent generating new business
- Internal Projects = Gross rate of billable employees spent on internal agency projects
- FTE [Full-Time Equivalent] Overstaffed = How overstaffed (or “heavy”) your team is
The utilization bullet chart is a visual quick reference that immediately informs the viewer how well the organization is doing toward achieving its utilization goals. The blue line represents current agency utilization, which is the total percentage of billable time logged across the agency, while the green vertical line represents the agency's utilization potential (or a variation of that potential, depending on the drop-down selection in Figure 25.5). The difference between these lines is the agency's utilization gap and corresponds to the $3.4M potential key performance indicator (KPI; the number in green at the top of the dashboard).
You might be wondering why the green bar isn't set to 100 percent. That is because no agency is going to be able to bill its workforce at 100 percent utilization, as it is simply impossible for every hour worked to be billable to a client.1
Target versus Billable versus Nonbillable Percentages
Figure 25.2 shows how each department is performing against utilization targets. It displays both the billable (blue) and nonbillable (gray) percentage of time for each department. Behind the stacked bars are wider, lightly colored target bars, which make it easy to see which blue bars are above or below target, and by how much. The red dots quickly identify the departments that are below their utilization targets. In the figure, you see that the Creative Department is above target while the next three departments are below target. Note that Operations, Executive/Admin, and New Biz do not have targets because they are considered “overhead departments” and often don't log all their time.
This utilization calculation is based on a 40-hour workweek, represented by the dotted vertical line, so it is possible for the billable and nonbillable percentages to be greater than 100 percent. We can see at a glance which departments are averaging more or less than a 40-hour workweek.

Figure 25.2 Comparing billable percentages with a target and showing overall hours.
Nonbillable versus Billable Hours
Figure 25.3 shows the actual number of nonbillable versus billable hours for each department. The common baseline makes it easy to see which departments are performing the most and the least number of billable hours.

Figure 25.3 Nonbillable bars go to the left; billable hours go to the right, creating a common baseline for comparison.
Cost, Fees, Potential
Figure 25.4 allows us to quickly see if the cost of labor is greater than or less than billable fees. Labor cost is represented by the lightly shaded bars, and the current utilization in fees is represented by the blue bars. The half-filled red dot shows which departments are producing fees that fall short of costs. The dashboard designer elected to use a half-filled dot to signify that costs were not being covered versus a full dot, which typically shouts “There's a problem here” but doesn't specify the exact nature of the problem.

Figure 25.4 Comparing costs, fees, and potential fees.
The green bars represent this additional potential fee income that a department could be making. You can easily see the ratio of cost to revenue that you could have if the department's targets were met.
With the “Show Potential at” drop-down box in Figure 25.5, you can also see the ratio of labor cost to the total fees you could be producing if the department hit its utilization target or a variation of that target.

Figure 25.5 Drop-down menu allows you to see additional “what-if” revenue at different target rates.
Details
Figure 25.6 shows where all of the nonbillable time across the agency is being spent. Although this dashboard cannot tell you why this time is being spent here, it can point leadership teams in the right direction when they are trying to understand why billable targets are not being met. Maybe leadership has approved too many internal projects or the agency is working on too many new business proposals with a low win rate. It is also possible that the agency just has too many employees for the current amount of billable work. Below each of the reports, you can see the actual labor cost (i.e., what employees are being paid to perform this nonbillable work).

Figure 25.6 Details about each department allow leadership to see why goals are not being met.
Utilization Trend
Utilization trend allows the dashboard user to compare actual versus potential billable percentage for the current year or to compare performance this year with the previous year. The default is to see how billable percentage is tracking against the target over time. (See Figure 25.7.)

Figure 25.7 Comparing actual billable percentage versus goal over time.
Here we can see that the organization did much better in the second half of the year with respect to hitting its target. Note that in this example, we are showing a full year's worth of data. If we only had six weeks of data, the dashboard would show a weekly rather than a monthly view.
This Year versus Last Year
A question that often comes up when looking at any trend data is whether you are performing better this year than you did last year. The utilization trend chart contains a drop-down menu that allows you to switch between the current view and one that compares billable percentages for this year with the previous year. (See Figure 25.8.)

Figure 25.8 Comparing this year with last year.
Here we can see that billable percentage for the current year (the dark blue line) is up 22 percent overall for the entire year and performed better in every month except for March. We can also see that the peaks and valleys for 2015 parallel those for 2014, suggesting that metrics are cyclical, which should help predict trends for future years.
How Are Individual Departments Performing over Time?
By default, the numbers along the top of the dashboard and the utilization trend show results for the entire organization. You can also focus on individual departments, as shown in Figure 25.9.

Figure 25.9 Clicking a department will filter the KPIs and the utilization trend chart by the selected department.
Why This Works
Problem Areas
The dashboard shows 50 different measures, but the KPI dots make it easy to focus on the areas that are performing poorly. (See Figure 25.10.)

Figure 25.10 KPI dots make it easy to see which areas are performing poorly.
Here we can immediately see that: (1) potential fees compared to actual fees is exceedingly high; (2) the organization is grossly overstaffed; (3) three departments are below target; and (4) three departments are not covering costs.
Big Picture and Color Legend
The numbers at the top of the screen in Figure 25.11 show the organization's performance along five key performance indicators and serve as a color legend.

Figure 25.11 Numbers at the top of the screen show key metrics and define color usage throughout the dashboard.
Sparing and Consistent Use of Color
The designer strove to keep the dashboard as uncluttered as possible and managed to avoid having a color legend altogether by using the color in chart titles. (See Figure 25.12.)

Figure 25.12 No need for a color legend as the colors are defined in the title.
Bars Allow Easy Comparison
There's a lot of information encoded in Figure 25.13. Notice that we stack the blue and gray bars to see, overall, which departments are above or below the 100 percent mark, with account management being the highest at 105 percent and operations being the lowest at 4 percent.

Figure 25.13 Lots of bars, intelligently arranged.
The designer placed the blue bars along the baseline so we can easily sort and compare this metric. Even if we removed the numeric labels, it would be easy to see that the blue bar for Creative is roughly twice as long as the blue bar for Technology.
It's important to note that while the comparison of blue bars is easy (because of the common baseline), a comparison of the gray bars is not. Fortunately, comparing the blue bars is of much greater importance, hence its positioning along the baseline.
Behind the stacked bars are wider, lightly colored target bars, making it easy to see which blue bars are above or below target and by how much.
By arranging the bars intelligently and using color and a reference line, we can answer four questions in one compact chart:
- Which department is working the most hours? (Account Management at 105 percent.)
- Which department has the highest percentage of billable hours? (Creative with 53 percent.)
- Which department is comfortably above target? (Creative.)
- Which departments are considerably below target? (Project Management, which is at around 50 percent of target, and Technology, which is about one-third of the way to hitting its target).
If you need to know the exact numbers, you can hover over a mark, as shown in Figure 25.14.

Figure 25.14 People really are good at comparing the length of bars using a common baseline, but you can provide details on demand with a pop-up.
You may not even need the hover functionality as people are very good at comparing the length of bars.
Trends and Year-over-Year Comparison
The utilization trends allow a quick toggle between showing actual versus target for this year and the actuals for this year when compared to the previous year. Both Figures 25.8 and 25.9 help users see if the organization is doing better or worse over time.
What's Being Left on the Table
The stacked bar chart and what-if drop-down menu really drive home just how much money is being left on the table when the organization isn't hitting its targets. (See Figure 25.15.)
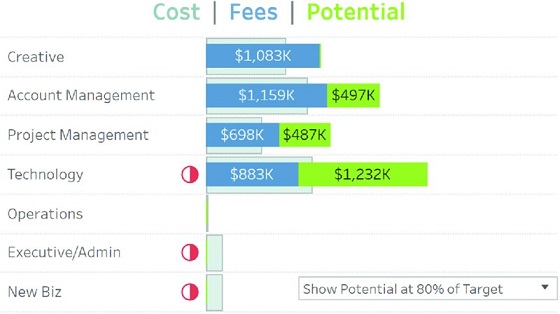
Figure 25.15 Even at only 80 percent of the target, the organization is leaving a lot of fees on the table.
The overarching goal of the dashboard is to change people's behavior. The green bars are a loud wake-up call that says “Look what you could be doing if you got your act together!”
Author Commentary
Steve: If we needed a case study to prove the utility of browsing through different scenarios on the book, this is it. This dashboard came into being after reviewing a half dozen dashboards already slated for the book, and we picked pieces from several of them to use here. For example, we borrowed the stacked bars from Chapter 20: Complaints Dashboard; the large numeric KPIs are from Chapter 2: Course Metrics Dashboard; the KPI dots are from the dashboard in Chapter 6: Ranking by Now, Comparing with Then; and the actuals versus year-over-year comparisons are from Chapter 10: Showing Year-to-Date and Year-over-Year at the Same Time.
I'm looking forward to seeing a new iteration of the dashboard that provides a way to compare one's performance with an industry average.
Jeff: As Steve mentioned, this dashboard represents how we hope people will use this book. As with most of the dashboards in this book, there were many iterations, and it was fun to see the progression. Notice the use of color throughout the dashboard. There are only three colors (blue, green, and gray), and they are used carefully and consistently.