14
Optimization through Modeling and Simulation
Optimization is to leverage key learnings in designing effective, efficient, and economic systems.
14.1 Principle
Mathematical model is the best way to describe a physical process so that the mass and energy efficiency of the process could be quantitatively predicted. Before a model could be used for this purpose, it has to be verified, calibrated, and validated. Models could be as simple as a black box at macro-scale or as detailed as some models of quantum chemistry or physics on micro-scale. In most SEE design, models at the elementary reaction level should be adequate. Fortunately, lots of commercial software are available. For example, ASM3biop is versatile‐activated sludge simulation developed by the International Water Association (IWA) with an extension by the Swiss Federal Institute of Aquatic Science and Technology (EAWAG). It allows the holistic analysis of wastewater treatment plant (WWTP) through the modeling and dynamic simulation of the activated sludge process, sludge treatment, and biological phosphorous elimination. Alternatively, simulation model could be built by using Matlab and Simulink. The major benefit of mathematical model and simulation is that it could be used to optimize the process without expensive laboratory and pilot testing if model is the true presentation of a process or a system. Principle 11 generalizes the criteria for effective application of model and simulation.
14.2 Introduction
To illustrate Principle 11 of optimization through modeling and simulation, the Fenton treatment of leachate is used as an example. Modern engineered sanitary landfill receives municipal solid wastes (MSWs) containing domestic, nonhazardous commercial and industrial wasted solids. There are four major different fates for precipitation that fell in landfill: evaporation, transexpiration, runoff, and leaching through layers of MSW. When rainfall percolates through MSW, liquid reacts with the MSW through hydrolysis. Organic and inorganic dissolve into the liquid. Once MSW is hydrolyzed, biochemical reactions take place through acidogenesis, acetogenesis, and methanogenesis with the help of anaerobic bacteria. The intermediate products dissolve into the liquid in the form of excess liquid called leachate. When the landfills are properly designed and operated, leachate is collected to be treated onsite or discharged to a WWTP. Leachate quality can be best explained in terms of fundamental chemical and biochemical reactions during leachate formation. Two major challenges facing leachate treatment are nonbiodegradability and toxicity. These two characteristics have significant impacts on designing effective leachate treatment train to achieve discharge requirements by different environmental laws.
14.2.1 History of Landfill Leachate Quality
Table 14.1 summarizes the current understanding of leachate quality which is critical in the selection of treatment processes during design process.
Table 14.1 History of landfill leachate quality.
| Year | Authors | Leachate quality topics |
| 1973 | Farquhar and Rover | Eight phases of MSW decomposition and their products |
| 1977 | Chian and Dewall | Fulvic and humic end products in leachate |
| 1980 | Cameron and Koch | Leachate toxicity |
| 1982 | Zehnder | Identification of hydrolic, acidogenic, acetogenic, and methanogenic bacteria |
| 1982 | Bookfer and Ham | Cellulosic material decomposition |
| 1983 | Harmsen | Acids during leachate decomposition |
| 1983 | Ehrig | Water balance for estimation of leachate quantity and toxicity of ammonia |
| 1986 | Pohland and Harper | Quantification of hydrolic, acidogenic, acetogenic, and methanogenic phases in MSW decomposition |
| 1989 | Weis | Quantification of C, H, and S content, Cu complexation capacity and phenolic end products |
| 1989 | Belevi and Baccini | Long‐term leachate quality |
| 1990 | Barlaz, Ham, and Schaefer | Methane production from leachate |
| 1991 | Bolton and Evans | Cd speciation |
| 1993 | Gounavis et al. | Colloidal particles in Zn, Pb, and Cr migration |
| 1993 | Assmuth and Strandberg | Xenobiotic pollutants |
| 1994 | Christensen | Attenuation of leachate pollutants |
| 1995 | Robinson | Adsorbable organic halogen (AOX) |
| 1995 | Reardon | Anaerobic corrosion of iron |
| 1995 | Flyhammer et al. | Heavy metals in leachate |
| 1996 | Clement et al. | Different leachate toxicities |
| 1997 | Gibbson | Halogenated aliphatic compounds in leachate |
| 1997 | Krug and Hum | BTEX in the US leachate |
| 1999 | KruBozhurt et al. | Reoxygeneration of post closure and heavy metal release |
| 2001 | Christophersen | BTEX in Danish leachate |
14.2.2 Leachate Characteristics
An anaerobic degradation scheme for organic material in a sanitary landfill is shown in Figure 14.1. In young landfills containing large amounts of biodegradable organic matter (OM), rapid anaerobic fermentation takes place, resulting in volatile fatty acids (VFA) as the main fermentation products. Acid fermentation is enhanced by high moisture or water content in the solid waste. This early phase of a landfill’s lifetime is referred to as the acidogenic phase and leads to the release of large quantities of free VFA, as much as 95% of the organic content. As a landfill matures, the methanogenic phase occurs. Methanogenic microorganisms develop in the waste, and the VFA are converted to biogas (CH4, CO2). The organic fraction in the leachate becomes dominated by refractory (nonbiodegradable) compounds such as humic substances (Figure 14.1).
Figure 14.1 Anaerobic degradation of organic compounds of leachate.
Landfills undergo at least five stages of waste degradation, accompanied by the formation of various compounds and emissions: (i) for aerobic, water and carbon dioxide are the main products, with carbon dioxide released as gas or absorbed into water to form carbonic acid; (ii) for acidogenic, carbon dioxide, hydrogen, ammonia, and organic acids; (iii) for acetogenic, acetic acid and derivatives, carbon dioxide, and hydrogen; (iv) for methanogenic, typical landfill gas has approximately 60% methane and 40% carbon dioxide; and (v) for aerobic, carbon dioxide and water. The acidogenic phase occurs when the landfill containing large amounts of biodegradable OM is a few years old, resulting in the so‐called young leachate with high values of chemical oxygen demand (COD) and biologic oxygen demand (BOD) levels, while the ratio BOD/COD is higher than 0.7 and pH is at low value due to the high concentrations of VFA. Acidic fermentation is enhanced by a high moisture or water content in the solid waste. The methanogenic phase is specific to landfills older than 10 years, and the leachate generated is referred to as old. Methanogenic microorganisms developed in the waste degrade VFA, which are converted to biogas (CH4, CO2), while pH >7 and the ratio BOD/COD is stabilized on levels. Refractory (nonbiodegradable) compounds such as humic substances become the dominant organic fraction in the leachate.
There are many factors affecting the quality of leachates, such as landfill age, precipitation, seasonal weather variation, waste type, and composition. In particular, the composition of landfill leachates varies greatly depending on the age of the landfill (Silva et al., 2004). The characteristics of the landfill leachate can usually be represented by the basic parameters COD, BOD, the ratio of BOD/COD, pH, suspended solids (SS), ammonium nitrogen (NH–N), total Kjeldahl nitrogen (TKN), and heavy metals. Table 14.2 presents typical physicochemical characteristics of leachate. The leachate is usually slightly alkaline pH (>7), dark in color, low in BOD5 (151 mg/l), and high in COD (2183 mg/l) with a BOD5/COD ratio of 0.07, consistent with typical characteristics of stabilized leachate.
Table 14.2 Physicochemical characteristics of a typical leachate sample.
| Parameter | Average | Standard deviation |
| pH (S.U.) | 7.51 | 0.09 |
| DO (mg/l) | 2.6 | |
| Conductivity (mS/cm) | 28.6 | 1.4 |
| TDS (mg/l) | 19 066 | 757 |
| BOD5 (mg/l) | 151 | 50 |
| COD (mg/l) | 2 183 | 46.8 |
| BOD5/COD | 0.07 | — |
| TOC (mg/l) | 778 | 73 |
| Alkalinity (mg/l as CaCO3) | 2 345 | 35 |
Using the EDS analysis of a transmission electronic microscope, the elements of raw leachate are presented in Table 14.3. The energy‐dispersive spectroscopy (EDS) analysis for the elemental composition of leachate sample (Table 14.3) showed highest concentration for the elemental carbon (35 ± 11% (w/w)) that included inorganic as well as organic carbon. It shows that carbon, oxygen, sodium, and chlorine occupy 35.3, 21.5, 27.4, and 12.4% of major weight of leachate sample, respectively.
Table 14.3 Elemental composition by weight % in raw leachate as measured by the EDS analysis.
| Element | Raw leachate |
| C | 35.3 ± 11.9 |
| O | 21.5 ± 8.7 |
| Na | 27.4 ± 12.1 |
| Si | 0.3 ± 0.3 |
| S | 0.7 ± 1.3 |
| Cl | 12.4 ± 10.9 |
| K | 2.0 ± 2.1 |
| Ca | 0.3 ± 0.4 |
14.3 Challenges and Opportunities
In addition to toxicity and recalcitrant nature, leachate is also a significant source of new and emerging pollutants reported from WWTP discharge. Emerging compounds identified in untreated leachates samples were detected at nanogram or microgram per liter levels in both surface and groundwater:
- Chlorinated alkylphosphates.
- Carcinogenic flame retardant (TCPP).
- Neurotoxin plasticizer (NBBS).
- Insect repellent (DEET).
- PFCs.
- Pharmaceuticals.
- Personal care products such as NSAIDs (ibuprofen and naproxen).
- Polycyclic musk compounds.
Since leachate has gone through an extended period of anaerobic degradation, the organic residuals as listed earlier could be very difficult to be degraded further. However, the current practice all over the United States is transporting leachate to local WWTPs if the leachate flow rate is less than 5% of that of a WWTP. Due to the nonbiodegradable and toxic nature, even 5% of the total wastewater flow rate could consume a significant amount of energy. More importantly, the emerging toxic pollutants may go through WWTP without degradation. For example, a pilot study of advanced treatment of wastewater effluent was conducted to reclaim the treated effluent to replenish the Biscayne aquifer at the South Dade WWTP. However, the nonbiodegradable toxic organic compounds from leachate could not be removed to meet the stringent discharge standards for the Everglades National Park. The unit cost of the reclaimed wastewater reached as high as $6/gal. As a result, the $10 million dollar pilot project plus $70 million engineering design fee was suspended indefinitely.
In China, leachate treatment is associated with the amount of domestic solid waste (DSW) going to landfill. Currently, landfill and incineration share an equal market in the ultimate disposal of DSW. Table 14.4 estimates the potential market of new leachate treatment facilities and the market size for retrofitting 70% of existing leachate treatment systems in the 13th Five‐Year Plan.
Table 14.4 Market sizes of leachate treatment in China.
| Total new leachate facility | Retrofitting leachate facility | |
| Volume in 13th Five‐Year Plan (1000 tons) | 170 | 180 |
| Unit cost ($/tons) | 14 000 | 7 000 |
| Total market size (billion USD) | 2.38 | 1.26 |
| Grand total (billion USD) | 3.46 |
Since the major difficulty in treating leachate is its nonbiodegradability and toxicity, Singh and Tang (2013) reported that the Fenton process (FP) could simultaneously achieve both objectives. Therefore, modeling, simulation, and optimization of the FP are illustrated as an example.
14.4 Modeling of the Fenton Process
Fenton oxidation (FO) uses hydrogen peroxide (H2O2) as an oxidizing agent and a reduced form of iron (Fe2+) as a catalyst to generate hydroxyl radicals (•OH) in acidic condition as shown in Equations (14.1)–(14.4), and the •OH effectively mineralizes or transforms refractory OM into more biodegradable OM that can be subsequently treated using biological processes (Bae et al., 1997):
where ki is the initiation rate constant of hydroxyl radical generation and kt1,t2 is the termination rate constants of hydroxyl radicals quenching reaction by Fe2+ and H2O2, respectively. RH is an unsaturated organic compound.
One of the effective ways to oxidize leachate is using the FP to reduce COD and increase BOD, which represents the biodegradability of leachate. To effectively apply the FP, accurately describing the process by a mathematical model can help experiments to be designed and carried out more efficiently. Tang (2004) developed a mathematical model for the FO of unsaturated organic pollutants such as chlorophenols and demonstrated the theoretical optimal ratio of H2O2/Fe2+ that can be expressed as follows:

Such an optimal ratio provides a theoretical framework for FO to produce a maximum amount of hydroxyl radical. Since hydroxyl radical is a powerful oxidative agent (2.80 V/SHE) and a highly reactive chemical species able to attack organic pollutants with second‐order rate constants ranging from 107 to 1010 l/mol/s (Tang, 2004), its high reactivity together with its low selectivity makes the hydroxyl radical a very powerful oxidation species for the mineralization of persistent organic pollutants. In addition to Fenton process, other processes such as chemical, photochemical, sonochemical, and electrochemical processes can be used to produce hydroxyl radicals (•OH). No matter which advanced oxidation process (AOP), the generation of hydroxyl radicals is the key parameter to control and optimize to improve the efficiency of the process and to elucidate the degradation mechanisms.
To accurately describe the FP, quantification of hydroxyl radical concentration is crucial. However, the very short lifetime of •OH (about 10−9 s) makes its detection and quantification difficult, so indirect detection methods such as UV‐Vis spectrophotometry (Zhao et al., 2015), luminescence (Tsai et al., 2001), fluorescence (Xiang et al., 2011), and other electrochemical and HPLC methods (Si et al., 2014) have been reported after hydroxyl radical has been scavenged. The hydroxyl radical concentration was then inferred from the product concentration instead of measuring radical concentration directly. Although electron paramagnetic resonance (EPR) could not directly measure short‐lived species such as hydroxyl radical, this technique could detect longer‐lived radical adducts generated by using spin trap agents at concentration as low as 10−14 M (Haywood, 2013). For this purpose, 5,5‐dimethyl‐1‐pyrroline N‐oxide (DMPO) is the most commonly used compound, especially because its reaction with the hydroxyl radical leads to the formation of relatively stable oxygen‐centered aminoxyl radicals detectable by EPR (Buettner, 1993).
The Fenton reaction includes chemical Fenton, photo‐Fenton, electro‐Fenton, and photoelectron‐Fenton. Under conditions used in AOPs, steady‐state hydroxyl radical concentration could be as high as 10−6 M. As a result, the stability of DMPO and its hydroxyl radical spin adduct (DMPO–OH) in the presence of high concentration of iron and hydrogen peroxide becomes a critical issue in the accurate quantification of hydroxyl radical concentration because of the formation of by‐products (paramagnetic or not) affecting the reliability of DMPO–OH (and thus •OH) detection (Makino et al., 1990; Buettner, 1993; Li et al., 2007).
14.4.1 Kinetic Model of DMPO–OH EPR Signal
Hydroxyl radicals generated from the Fenton reaction (Reaction 14.1) could also react with Fe2+ and H2O2 as described in termination Reactions (14.2) and (14.3). However, when DMPO is in excess, all the hydroxyl radicals generated by H2O2 and Fe2+ would quickly attack the electron‐rich carbon of the DMPO in Reaction (14.4) to form the classic paramagnetic compound 2‐hydroxy‐5,5‐dimethyl‐1‐pyrrolidinyloxy (DMPO–OH; see Scheme 1, compound 2), thus limiting side Reactions (14.2) and (14.3):
where kD is the formation rate constant of paramagnetic DMPO–OH compound.
The stability of DMPO under attack from a hydroxyl radical depends upon the relative amount of DMPO and Fenton reagent concentrations. In the presence of high concentration of Fe3+ under acidic conditions, it was previously reported that DMPO–OH could lead to the formation of two diamagnetic intermediates (Makino et al., 1992): 1‐hydroxy‐5,5‐dimethyl‐1‐pyrrolid‐2‐one (HDMPN, Scheme 1, compound 3) and its tautomer 2‐hydroxy‐5,5‐dimethyl‐1‐pyrroline‐N‐oxide (HDMPO, Scheme 1, compound 4), as described in Reaction (14.7):
where kI is the formation rate constants for diamagnetic tautomers HDMPN and HDMPO.
Moreover, if there is an excess of hydroxyl radicals in the system, these EPR‐silent compounds quickly react with •OH to form the stable paramagnetic radicals 5,5‐dimethyl‐2‐oxopyrroline‐N‐oxyl (DMPOX, Scheme 1, compound 5) and 2‐dihydroxy‐5,5‐dimethyl‐1‐pyrrolidinyloxy (HDMPO–OH, Scheme 1, compound 6) (Reactions 14.8 and 14.9):
where kH and kX are the formation rate constants for the paramagnetic products HDMPO–OH and DMPOX, respectively.
Therefore, if DMPO is not present in extra‐excess, additional EPR signals might appear, thus preventing a reliable detection/quantification of hydroxyl radicals. The critical question to elucidate is therefore at which concentration DMPO could be considered to be in excess. For this purpose, a kinetic model was developed based on the previous elementary reactions. With the aid of this model, experiments were designed to answer this critical question by monitoring DMPO–OH and additional signals using an EPR and UV‐Vis spectrophotometer. When the ratio of H2O2 and Fe2+ was kept at an optimal 10 (Tang, 2004), the conditions under which DMPO is in excess, i.e. trapping all the hydroxyl radicals in the system, without further Reactions (14.8) and (14.9), can be found starting from Reaction (14.10):

At a steady‐state concentration of hydroxyl radical, Equation 14.10 should equal zero to derive the steady‐state hydroxyl radical concentration. The final form of hydroxyl radical steady‐state concentration can then be expressed as follows:
To accurately quantify DMPO–OH concentration, the analytical conditions must be found and defined so that a stable quartet EPR signal can be monitored over the analytical time without further degradation to HDMPN. In terms of elementary reactions, the rate of Reactions (14.8) and (14.9) should approach zero as follows:
Therefore, the steady‐state hydroxyl radical concentration can be simplified as follows:

Moreover, the reaction rate of DMPO–OH can be expressed as follows:

The generation of a constant quartet EPR signal relies upon two conditions: the first is that the rate of reaction (14.7) approaches zero. Therefore,
The second condition is to make sure the change rate of d[DMPO–OH]/dt is not a function of [DMPO]. The only possible way to satisfy this condition is for the term kD[DMPO] to be significantly greater than kt1[Fe2+] + kt2[H2O2] so that the latter can be negligible. Mathematically, the following conditions must be satisfied:
This equation can be divided by kD[H2O2] at both sides, and the suitable analytical conditions become
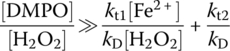
The sign of significantly greater means that the right‐hand ratio of reaction (14.18) should be negligible compared with the left‐hand ratio. In other words, the left‐hand ratio should be at minimum two to three orders smaller than the right‐hand ratio for Equations (14.17) and (14.18) to truly hold. Therefore, at the initial H2O2 and Fe2+ concentrations of 1 and 0.1 mM (ratio of 10), respectively, the required ratio of initial DMPO to H2O2 concentrations, [DMPO] : [H2O2], should be at minimum 1.68–16.8. As a result, the system should generate a stable quartet EPR signal without any additional noise. Fontmorin et al. (2016) designed their experiments based upon these theoretical analyses, and results were used to determine the optimal [DMPO] : [H2O2] ratio more accurately. In this study, H2O2 : Fe2+ ratio was kept constant; however, the aforementioned model would help to predict an optimal concentration of DMPO for any other concentration of the Fenton reagent since initial conditions are included in Equation (14.18).
Fontmorin et al. (2016) showed the impact of the Fenton reagent concentration with H2O2 and Fe2+ concentrations varying from 1 to 100 mM and from 0.1 to 10 mM, respectively, with [DMPO] : [H2O2] ratio varying from 1 to 100. A typical spectrum of DMPO–OH is presented in Figure 14.2a: it is composed of a characteristic 1 : 2 : 2 : 1 quartet with hyperfine couplings aN = aβH = 1.50 mT (computer simulation, Figure 14.2b).

Figure 14.2 (a) Typical DMPO–OH signal obtained with 1 mM H2O2, 0.1 mM Fe2+, and 0.1 M DMPO and (b) simulation of DMPO–OH (aN = aβH = 1.50 mT).
(Source: Fontmorin et al. (2016). Reproduced with permission of Elsevier.)
The amplitude of the DMPO–OH signal was followed over time at different concentrations of Fenton’s reagent, and results are presented in Figure 14.3.

Figure 14.3 Time courses of DMPO–OH peak amplitude for various concentrations in the Fenton reagent and constant 0.1 M DMPO concentration.
(Source: Fontmorin et al. (2016). Reproduced with permission of Elsevier.)
As depicted, the concentration of Fenton’s reagents had a significant impact on both the intensity and stability of DMPO–OH signal. Indeed, when H2O2 and Fe2+ concentrations were 1 and 0.1 mM, respectively (i.e. [DMPO] : [H2O2] = 100 > 16.8), the peak amplitude of DMPO–OH signal was statistically stable because no clear downward trend appears over the time of experiment (60 min). The variations from one point to another could be attributed to the instability of the reaction (no control of pH after the initial adjustment). Nevertheless, the general trend of the system together with the nature of the EPR background (DMPO–OH quartet, data not shown) suggested an appropriate concentration in DMPO compared with the concentration of Fenton reagent for the detection of radicals, as predicted by the theoretical model. The increase in Fenton reagent concentration to 10 mM H2O2 and 1 mM Fe2+ (i.e. [DMPO] : [H2O2] = 10 > 1.68) led to a different behavior. The higher intensity measured during the very early minutes suggested the generation of higher concentration of hydroxyl radicals, as expected after the increase of the Fenton reagent. However, an important decrease in the DMPO–OH peak amplitude was then observed during the first 20 min, followed by a slower decrease until the end of the experiment. The fast decrease measured during the early stage of the reaction was unlikely to have been related to the lifetime of DMPO–OH, generally reported around 30 min. Even though the typical DMPO–OH quartet was the only signal detected in EPR spectra without the apparition of any additional line, the fast decrease of the signal intensity suggested the possible quenching or degradation of the spin adduct. According to the kinetic model developed, this observation would also suggest that the left‐hand ratio of Equation (14.18) should be more than two orders greater than the right‐hand ratio to provide a stable quartet signal. To confirm the possible quenching of DMPO–OH, H2O2 and Fe2+ concentrations were increased again to 100 and 10 mM, respectively ([DMPO] : [H2O2] = 1). In this case, the quenching effect of DMPO–OH was very obvious, with a lower signal amplitude from the beginning of the reaction and becoming hardly detectable after 10 min, thus clearly suggesting the oxidation of the spin adduct due to the excess of hydroxyl radicals. Moreover, the EPR revealed the appearance of additional lines consisting a 1 : 1 : 1 triplet. The triplet’s intensity increased along with the decrease of DMPO–OH quartet (Figure 14.4a). After a 35‐min reaction, the peak amplitude of the triplet reached its maximum, whereas DMPO–OH had completely disappeared. The corresponding EPR spectrum is presented in Figure 14.4b (aN = 1.51 mT, simulation depicted in Figure 14.4c).

Figure 14.4 (a) Time courses of quartet (DMPO–OH) and additional triplet signals amplitudes during the Fenton reaction with 0.1 M H2O2, 10 mM Fe2+, and 0.1 M DMPO, (b) triplet observed after 35‐min reaction in these conditions, and (c) computer simulation of triplet in (b) (aN = 1.51 mT).
(Source: Fontmorin et al. (2016). Reproduced with permission of Elsevier.)
The triplet observed remained stable until the 60‐min reaction, although its amplitude slightly decreased. It should be noted that the appearance of background EPR signals in case of an excessively high initial concentration of Fe2+ as described (Bosnjakovic and Schlick, 2006). However, the signals reported and already attributed to HDMPO–OH and DMPOX are different than the triplet observed by Fontmorin et al. (2016), thus implying the generation of a different by‐product. To understand the mechanisms leading to the decrease of DMPO–OH in the aforementioned two systems and to the formation of the triplet in the last system, similar analyses were performed by UV‐Vis spectrophotometry. The contribution of each reagent (H2O2, Fe2+ and DMPO) was first analyzed, and, as shown in Figure 14.5a, the peak measured in visible part (λmax = 520 nm) only appeared in the presence of both the Fenton reagent and DMPO. Time series of UV‐Vis absorbance were then followed for the last two Fenton systems described previously, and the corresponding results are presented in Figure 14.5b and c. With 10 mM H2O2 and 1 mM Fe2+, EPR and UV‐Vis signals are following opposite trends. Indeed, the DMPO–OH EPR signal intensity decreased during the first 20 min, whereas the UV‐Vis signal increased during the same period of time (Figure 14.5b). This result suggests the generation of EPR‐silent by‐products (diamagnetic) related to the quenching of DMPO–OH, which can most likely be explained by the reaction of DMPO–OH with the generated Fe3+ to form the tautomers HDMPN and HDMPO (Bosnjakovic and Schlick, 2006). This result also confirms that a [DMPO] : [H2O2] ratio of 1.68 is not high enough to provide a stable EPR signal. It implies that under these conditions, Reactions (14.8) and (14.9) barely took place in the system, while reaction (14.7) is not negligible. Increasing the concentration of Fenton reagent to 100 mM H2O2 and 10 mM Fe2+ led to the increase of the absorbance in the visible range over the first 20 min (Figure 14.5c). It can reasonably be assumed that the higher concentration in Fe2+, and therefore in the generated Fe3+, enhanced the production of the two tautomers.
Figure 14.5 (a) UV‐Vis spectra of DMPO, DMPO and ferrous sulfate, Fenton reagent, and DMPO, (b) UV‐Vis spectra during Fenton reaction with 10 mM H2O2, 1 mM Fe2+, and 0.1 M DMPO, and (c) UV‐Vis spectra during Fenton reaction with 100 mM H2O2, 10 mM Fe2+, and 0.1 M DMPO (diluted 10 times).
(Source: Fontmorin et al. (2016). Reproduced with permission of Elsevier.)
In the presence of excessive hydroxyl radicals, the oxidation of HDMPN and HDMPO can lead to the formation of HDMPO–OH and DMPOX (Scheme 1). Since DMPOX generates a 1 : 1 : 1 triplet (aN = 0.72 mT) of 1 : 2 : 1 triplet (aγH = 0.41 mT, 2H) and that HDMPO–OH generates a 1 : 1 : 1 triplet (aN = 1.53 mT) of 1 : 3 : 3 : 1 quartet (aγH = 0.12 mT, 3H) (Bosnjakovic and Schlick, 2006), the presence of HDMPO–OH and DMPOX should be excluded. The computer simulation of the triplet (aN = 1.51 mT, Figure 14.4b) suggests the absence of the contribution of hydrogen nuclei in β and γ positions. The possibility of degradation of DMPO–OH spin adduct via C–N bond cleavage and the opening of the pyrroline ring have also been suggested and assigned to a similar triplet signal. However, neither a structure nor a mechanism was proposed. Such a degradation pathway was also discussed in a thermodynamic study stating that this mechanism may play a crucial role in the stability of spin adducts. The detailed mechanism related to the DMPO–OH ring opening remains unclear; moreover, the degradation product that could be assigned to the triplet observed (Scheme 1, compound 7) because of the absence of hydrogen nuclei in α and β positions is thermodynamically highly unstable and is thus unlikely to generate a stable signal over time. In the case of 2,5,5‐trimethyl‐1‐pyrroline‐N‐oxide (M3PO) tautomers, the appearance of the EPR triplet signal could be explained by the dimerization reaction occurring between HDMPN and HDMPO, thus leading to the formation of a stable diamagnetic dimer, as described in the proposed mechanism presented in Scheme 2. In the presence of excessive hydroxyl radicals compared with the initial concentration of DMPO, the dimer could be further oxidized to generate the corresponding paramagnetic compound 8 associated with the additional triplet. Indeed, as shown in Scheme 2, the paramagnetic dimerization product does not present hydrogen nuclei in β position, and the contribution of hydrogen in γ position is highly unlikely due to steric effect after dimerization (Figure 14.6).

Figure 14.6 Reaction schemes of the products formed during Fenton oxidation of DMPO.
(Source: Fontmorin et al. (2016). Reproduced with permission of Elsevier.)
According to these experimental results, the theoretical model proposed can be adjusted as follows: to ensure a reliable detection of hydroxyl radicals, the left‐hand ratio of Equation (14.18) should be three orders higher than the right‐hand ratio. In other words, the [DMPO] : [H2O2] ratio should be at least 16.8. The observed reactions described earlier suggest that the DMPO concentration should therefore be carefully selected according to Fenton’s reagent concentration and expected magnitude of hydroxyl radical concentration as demonstrated in the previous theoretical kinetic analysis. The condition illustrated by Equation (14.18) could be applied to any concentration of the Fenton reagent during EPR quantification hydroxyl radical concentration as standard calibration procedure. Therefore, the impact of DMPO concentration on EPR signals was validated at a constant ratio of H2O2/Fe2+ but different the Fenton reagent concentrations. Initial concentration of H2O2 and Fe2+ was chosen at 5 and 0.5 mM, respectively. DMPO concentration varied from 5 to 100 mM, corresponding to the ratio of [DMPO] to [H2O2] varying from 1 to 20. The time series signals of DMPO–OH are presented in Figure 14.7a. As observed, DMPO concentration had a significant impact on DMPO–OH signal intensity. Using DMPO 100 mM, which is 20 times the initial H2O2 concentration, the signal intensity remained statistically stable until 25 min (apart from the instability of the system itself). The peak‐to‐peak amplitude then decreased slowly until the end of the experiment, which is consistent with the lifetime of DMPO–OH. As shown in Figure 14.7b, the corresponding EPR background after 10 min only composted of the DMPO–OH quartet, showing that no other paramagnetic by‐product was formed and that the adduct was not further oxidized. Decreasing DMPO concentration from 100 to 50 mM ([DMPO] : [H2O2] = 10) also led to a decrease in DMPO–OH signal intensity, even though the 1 : 2 : 2 : 1 quartet was the only signal detected (Figure 14.7c).

Figure 14.7 (a) Impact of DMPO concentration on DMPO–OH peak area during the time for Fenton reaction with 5 mM H2O2 and 0.5 mM Fe2+, (b) EPR signal obtained with 0.1 M DMPO after 9‐min reaction, (c) EPR signal obtained with 50 mM DMPO after 9‐min reaction, and (d) EPR signal obtained with 5 mM DMPO after 9‐min reaction.
(Source: Fontmorin et al. (2016). Reproduced with permission of Elsevier.)
Therefore, under these conditions, it can be assumed that DMPO–OH is partially degraded to HDMPN and HDMPO and that hydroxyl radicals are not in excess to generate the paramagnetic dimer. Finally, when DMPO concentration was lowered to 5 mM (DMPO] : [H2O2] = 1), the EPR background evolved into a combination of quartet and triplet (Figure 14.7d). These results are consistent with both the theoretical model and the results presented in Figure 14.7. It confirms that in order to achieve a reliable detection of hydroxyl radicals, the concentration ratio between DMPO and Fenton reagent should be carefully chosen, which is true for any concentration of Fenton reagent. Indeed, it should be noted that with the most concentrated system, increasing DMPO concentration from 0.1 to 0.5 M led to a significant decrease in the triplet and an increase in the quartet. The influence of DMPO concentration on the stability of EPR signal shows that the “excess concentration” in DMPO should be carefully adopted to each system, even in the absence of additional lines. The absence of additional lines does not necessarily imply a reliable detection of hydroxyl radicals, since EPR‐silent compounds might be formed. Therefore, three conclusions can be drawn: (i) the [DMPO] : [H2O2] : [Fe2+] ratio holds the key in terms of the oxidation kinetics of DMPO–OH, and at a fixed ratio, the kinetics are the same; (ii) the stability of DMPO–OH depends upon Fe3+ and •OH concentrations wherein the higher these concentrations, the shorter the lifetime of DMPO–OH; and (iii) to ensure a reliable detection of hydroxyl radicals, DMPO concentration should be set so that [DMPO] : [H2O2] > 16.8.
14.5 Simulation
Fenton oxidation (FO) of organic compounds has been simulated using computer models. Duesterberg and Waite (2006) reported kinetic model simulation using the kinetic modeling software package Presto‐Kinetics (Telgmann and Wulkow, 2005). Although the system simulated has an extremely low concentration of Fenton reagents and organic compounds, the simulation results of optimal H2O2/Fe2+ ratio range from 4 to 40. Their system contains concentrations of 400 nM Fe2+, 400 nM to 400 μM H2O2, and 100 nM to 4 μM HCOOH. When [HCOOH]0 is less than Fe2+, the lowest time required to reach 90% degradation occurs when H2O2/Fe2+ is between 2.5 and 5. Tang and Huang (1997) came to a similar conclusion when examining the oxidation of a variety of chlorinated aliphatic compounds by Fenton’s reagent, presenting experimental evidence for an optimal H2O2/Fe2+ ratio between 5 and 11. When [HCOOH]0 > [Fe2+]0, simulations predict the formic acid oxidation rate continually increases with increasing [H2O2]0, although as the H2O2/Fe2+ ratio rises, the rate of this increase diminishes. Kinetic simulations thus offer potential operating information for both ratios of starting concentrations, indicating either an optimum H2O2 concentration or an upper limit above which additional H2O2 provides little further benefit to improve the oxidation rate. At low initial organic concentrations (relative to the Fenton reagents), the availability of hydroxyl radicals for attack on the substrate is subject to competing reactions with Fe2+ and H2O2, both of which eventually lead to the chain‐terminating oxidation of Fe2+ to Fe3+. In the presence of oxygen, time required to achieve 90% oxidation of HCOOH at pH 3 is plotted against (H2O2)0/(HCOOH)0 and (H2O2)0/(Fe2+)0 in Figure 14.8a and b, respectively. Figure 14.8a shows that the shortest time to achieve 90% oxidation of HCOOH at pH 3 occurs at the (H2O2)0/(Fe2+)0 ratio between 5 and 11, which further confirms that theoretical (H2O2)0/(Fe2+)0 ratio should be at 11 (Tang, 2004).
![Time vs. [H2O2]0:[Fe(II)]0 displaying four curves with discrete markers.](http://images-20200215.ebookreading.net/5/3/3/9781119028376/9781119028376__sustainable-environmental-engineering__9781119028376__images__c14f008a.gif)
![Time vs. [H2O2]0:[HCOOH]0 displaying four curves with discrete markers.](http://images-20200215.ebookreading.net/5/3/3/9781119028376/9781119028376__sustainable-environmental-engineering__9781119028376__images__c14f008b.gif)
Figure 14.8 Results of kinetic simulations showing the time required to reach 90% oxidation of HCOOH at pH 3 and in the presence of oxygen. Initial conditions (Fe(II))0 = 400 nM and (HCOOH)0 = 100 nM, 400 nM, 1 μM, and 4 μM.
(Source: Duesterberg and Waite (2006). Reproduced with permission of American Chemical Society.)
At pH 4, the shortest time required to reach 90% oxidation of HCOOH in the presence of oxygen is 1.51 h at theoretical (H2O2)0/(Fe2+)0 ratio of 11 as shown in Figure 14.9.
Figure 14.9 Results of kinetic simulations showing the time required to reach 90% oxidation of HCOOH at pH 4 and in the presence of oxygen.
(Source: Duesterberg and Waite (2006). Reproduced with permission of American Chemical Society.)
The optimal (H2O2)0/(Fe2+)0 ratio of 11 is based upon the assumption that organic substrates are directly hydroxylated without chain‐promoting or chain‐terminating reactions that require different kinetic models to be simulated. Duesterberg and Waite (2006) presented the elegant simulation results in Figure 14.10. In FO of formic acid as a chain‐propagating organic and acetone as a chain‐terminating organic, the time required to oxidize 90% against the (H2O2)0/(Fe2+)0 ratio is completely different. In oxidation of formic acid, the chain‐propagating organic would facilitate the second‐stage generation of hydroxyl radical by H2O2/Fe3+; as a result, the time required to achieve 90% oxidation of formic acid decreases with increasing the (H2O2)0/(Fe2+)0 ratio. For a chain‐terminating organic, there is an optimal (H2O2)0/(Fe2+)0 ratio of 4. When the (H2O2)0/(Fe2+)0 ratio increases from 4 to 40, the time required increased from 2 to 13.38 h before the time leveled off with the (H2O2)0/(Fe2+)0 ratio.
![Time vs. [H2O2]0:[Fe(II)]0 in oxidizing 90% of a chain-propagating organic, formic acid, and a chain-terminating organic acetone displaying two solid curves with hexagon and square markers.](http://images-20200215.ebookreading.net/5/3/3/9781119028376/9781119028376__sustainable-environmental-engineering__9781119028376__images__c14f010.gif)
Figure 14.10 Time required to oxidize 90% of a chain‐propagating organic, formic acid, and a chain‐terminating organic acetone.
(Source: Duesterberg and Waite (2006). Reproduced with permission of American Chemical Society.)
14.6 Optimization
14.6.1 Fenton Oxidation of Landfill Leachate
FO of leachate is a multistep process. At first, leachate pH is lowered to the range of 2.5–4.0 because in this pH range •OH is more efficiently generated in addition to keeping Fe2+ and Fe3+ ions soluble (Kochany and Lipczynska‐Kochany, 2009). Sulfuric acid is generally used to lower the pH and added at the start of reaction or continuously controlled the pH at the desired level (Zhang et al., 2006). Afterward, Fe2+ salt (ferrous sulfate) is added to the leachate and mixed at 80–400 rpm followed by gradual addition of H2O2 while continuing the rapid mixing for 30 s to 60 min. H2O2 is commonly added in single step (Lopez et al., 2004; Mohajeri et al., 2010). The effect of multistep H2O2 addition on leachate oxidation has also been reported (Rivas et al., 2003; Goi et al., 2010). At the end of this stage, pH is increased to the neutral pH range using sodium hydroxide or lime solution. Under neutral pH conditions, the Fe3+ forms ferric‐hydroxo complexes, and a slow mixing (20–100 rpm) of solution for 10–30 min flocculates ferric‐hydroxo complexes that subsequently precipitate for approximately 30 min to several days (Kim and Huh, 1997; Cotman and Gotvajn, 2010). The analysis of supernatant provides the treatment efficiency of the process.
FO has great potential in removing OM that contributes to the COD and color of landfill leachate. A statistical analysis of the data of leachate treatment efficiency and the optimum operating conditions as obtained from peer‐reviewed publications on FO landfill leachate is presented in Table 14.5 by Singh and Tang (2013). Raw and pretreated leachates have been subjected to FO. Biological treatment and coagulation are the most common pretreatment processes used with FO. Biological treatment processes effectively remove low MW OM, whereas FO removes high MW refractory OM (Gulsen and Turan, 2004). FO has been generally used as a polishing step with coagulation treatment due to its effectiveness in removing similar types of OM (Goi et al., 2010).
Table 14.5 Statistical analysis of leachate treatment efficiencies and optimum operating conditions observed in peer‐reviewed literature.
Source: Singh and Tang (2013). Reproduced with permission of Elsevier.
| Type of leachate used for Fenton oxidation | Parameter | Treatment efficiencies | Optimum operating conditions | ||||||||
| Initial COD (mg/l) | COD removal efficiency (%) | Color removal efficiency (%) | Increase in BOD/COD (%) | pH | Reaction time (min) | Temperature (°C) | H2O2/Fe2+ (mg/l)/(mg/l) | H2O2/COD0 (mg/l)/(mg/l) | Fe2+/COD0 (mg/l)/(mg/l) | ||
| Each leachate | #a | 37 | 37 | 3 | 5 | 35 | 33 | 24 | 37 | 37 | 37 |
| Average | 4 085 | 67 | 89 | 940 | 3.4 | 241 | 27 | 5.4 | 9.1 | 2.2 | |
| Max | 34 920 | 95 | 95 | 2275 | 6.0 | 2880 | 50 | 60.7 | 73.1 | 14.9 | |
| Min | 93 | 31 | 79 | 58 | 2.5 | 10 | 20 | 0.5 | 0.0 | 0.01 | |
| Std Devb | 6 943 | 14 | 9 | 915 | 0.9 | 582 | 8.4 | 10.8 | 17.0 | 3.3 | |
| Median | 1 500 | 68 | 95 | 920 | 3.0 | 60 | 25 | 1.8 | 1.2 | 0.9 | |
| Raw leachate | #a | 25 | 25 | 1 | 4 | 25 | 24 | 18 | 25 | 25 | 25 |
| Average | 4 180 | 65 | 79 | 845 | 3.2 | 234 | 28 | 5.0 | 11.6 | 2.4 | |
| Max | 34 920 | 86 | 79 | 2275 | 4.5 | 2880 | 50 | 30.4 | 73.1 | 12.0 | |
| Min | 93 | 31 | 79 | 58 | 2.5 | 10 | 20 | 0.8 | 0.1 | 0.0 | |
| Std Devb | 7 181 | 14 | — | 1030 | 0.6 | 631 | 9.1 | 6.2 | 19.5 | 2.9 | |
| Median | 1 800 | 66 | 79 | 525 | 3.0 | 60 | 25 | 2.4 | 2.4 | 1.3 | |
| Biologically treated leachate | #a | 8 | 8 | 2 | — | 6 | 6 | 4 | 8 | 8 | 8 |
| Average | 922 | 73 | 95 | — | 4.2 | 132 | 24 | 1.1 | 4.3 | 2.5 | |
| Max | 1 500 | 95 | 95 | — | 6.0 | 331 | 25 | 2.0 | 30.1 | 14.9 | |
| Min | 220 | 56 | 95 | — | 2.5 | 30 | 20 | 0.5 | 0.0 | 0.1 | |
| Std Devb | 492 | 12 | 0 | — | 1.6 | 121 | 2.5 | 0.5 | 10.4 | 5.0 | |
| Median | 1 050 | 71 | 95 | — | 4.2 | 110 | 25 | 0.9 | 0.8 | 0.9 | |
| Coagulation‐treated leachate | #a | 4 | 4 | — | 1 | 40 | 3 | 2 | 4 | 4 | 4 |
| Average | 9 823 | 68 | — | 1307 | 3.4 | 515 | 20 | 16.8 | 2.9 | 0.5 | |
| Max | 22 400 | 80 | — | — | 4.5 | 1440 | 20 | 60.7 | 9.6 | 1.4 | |
| Min | 900 | 47 | — | — | 2.7 | 45 | 20 | 0.8 | 0.1 | 0.0 | |
| Std Devb | 9 736 | 15 | — | — | 0.8 | 801 | 0 | 29.3 | 4.5 | 0.6 | |
| Median | 7 995 | 73 | — | 1,307 | 3.2 | 60 | 20 | 2.8 | 1.1 | 0.2 | |
Note:
—, no data.
a Number of studies.
b Standard deviation.
Raw and biological‐ and coagulation‐treated leachate showed a median COD removal of 66, 71, and 73%, respectively. Reduced COD0 values of pretreated leachates lead to an increased percentage of COD removal as compared with raw leachate (Kang and Hwang, 2000); however, the percentage of COD removal does not necessarily translate to the amount of COD removed. Zhang et al. (2006) observed increased amounts of COD removal at higher COD0, but the percentage of COD removal efficiency decreased under the same Fenton‐operating conditions. An average of 89% color removal was observed. FO greatly improved biodegradability of leachates, which can be represented by the ratio of BOD5 and COD (BOD/COD). An increase from less than 0.01 to a range of 0.15–0.70 with a median increase of 0.50 was observed for BOD/COD values, which shows FO suitability as a pretreatment process for the biological treatment of landfill leachate.
FO may also help reduce the toxicity of leachate. Goi et al. (2010) observed a twofold toxicity reduction for Daphnia magna, and Cotman and Gotvajn (2010) observed 24 and 32% reduction for heterotrophic and nitrifying microorganisms, respectively; however, the removal was not significant enough, and leachate remained extremely toxic. Although •OH has a strong oxidizing capacity, the generated •OH during FO cannot oxidize ammonia‐N that largely contributes to the toxicity of leachate (Gotvajn et al., 2011). Therefore, FO cannot be used as a primary method to remove the toxicity of leachate. Addition of Fe2+ salt and chemicals used for pH adjustment also increases the total dissolved solids (TDS) of treated leachate (Deng and Englehardt, 2006).
14.6.2 Optimization Fenton Oxidation of Leachate
Landfills are designed to dispose high quantities of waste at economical cost with potentially fewer environmental effects; however, improper landfill management may pose serious environmental threats through the discharge of high‐strength leachate. Although modern landfill engineering and operating practices minimize leachate generation, proper leachate discharge remains one of the great challenges for landfill operators due to its complicated and changing characteristics over time. Multiple factors influencing leachate characteristics include waste age, climatic conditions, waste composition, landfill design, and operating practice; however, selecting leachate treatment method, which is often a combination of multiple processes, is mostly associated with the state of landfill stabilization.
Leachate treatability is evaluated as a function of landfill age or by the ratio of biochemical oxygen demand (BOD5) to COD with values close to 1, representing young leachate and values of 0.1 or less described as stabilized leachate (Diamadopoulos et al., 1997). Young leachate generally contains low molecular weight and more biodegradable OM, so it is subjected to standard biological treatment processes. Once waste decomposition reaches the stable methanogenic phase, landfill leachate OM is dominated by biologically refractory OM (such as humic and fulvic‐like OM), reducing the effectiveness of biological treatment processes and necessitating other physicochemical processes.
The most common physicochemical processes used for landfill leachate treatment are coagulation and flocculation (Amokrane et al., 1997; Tatsi et al., 2003), activated carbon (AC) adsorption (Maranon et al., 2009; Singh et al., 2012a), chemical oxidation (Rivas et al., 2004; Tizaoui et al., 2007), and membrane‐based technologies (Trebouet et al., 2001; Tabet et al., 2002). These physicochemical processes are often used as pretreatment or posttreatment steps prior to biological processes. Although FO reactions were discovered more than 100 years ago, their application for oxidizing toxic OM in leachate was first reported only in the early 1990s (Huang et al., 1993). Landfill leachate treatment using FO should be carried out under optimal operating conditions such as pH, reaction time, reaction temperature, and reagent dose for a specific leachate to achieve the most cost‐effective treatment. Optimal conditions were generally determined based on OM or COD removal efficiencies from leachate (Deng and Englehardt, 2006); however, a wide range of optimum conditions have been reported in literature primarily due to variation in leachate characteristics and experimental conditions.
Singh and Tang (2013) developed a database for analysis of the optimum FO parameters such as pH, reaction time, reaction temperature, and reagent doses as determined by previous studies along with the experimental conditions such as initial BOD, COD (COD0), and color and COD removal efficiencies. The reagent weight ratios (H2O2/Fe2+), reagent doses (H2O2/COD0 and Fe2+/COD0), COD loading factor (LCOD = COD0/H2O2), and oxidation efficiencies (η = CODox/H2O2) were calculated for each study. The mean, maximum, minimum, standard deviation, and median for each parameter were calculated. A relationship between dimensionless parameters η and LCOD was developed using the optimum operating conditions obtained by previous researchers and can be used to predict η under optimum operating conditions for landfill leachate treatment. The relationship between η and LCOD was cross‐validated using the leave‐one‐out cross‐validation technique, in which one observation is left out at a time, while regression is carried out. The uncertainty in the relationship was evaluated by applying Monte Carlo simulation using Crystal Ball (v11.1) software. During the uncertainty analysis, the mean (ηmean) and standard deviation (σ) of η at a 95% confidence interval for a range of LCOD were determined. The LCOD range of 0.01–34 was used as observed in previous peer‐reviewed studies. The validation and uncertainty analysis procedures were adopted from Tang and Wang (2010).
14.6.3 Optimum Operating Conditions
14.6.3.1 pH
Obtaining an optimum pH is the first most important task in FO process, and typically it varies in a narrow range of 2.5–4.0. The pH below the optimum range affects the oxidation process by producing fewer •OH, scavenging •OH by H+, and reducing Fe2+ regeneration (Tang and Huang, 1997). The pH above the optimum range affects the oxidation reaction by reducing the production of •OH radicals, self‐decomposition of H2O2, formation of ferric‐hydroxo complexes, scavenging of •OH radicals by alkalinity (CO32− and HCO3−), and reduction in oxidation potential of •OH radicals (Buxton et al., 1988).
A statistical analysis of optimum pH conditions determined from the previous studies showed a range of 2.5–6.0 with a median of 3.0 (Table 14.5). An optimum pH range of 2.5–4.5 was observed for raw and coagulation‐treated leachate with a median of 3.0, whereas biologically treated leachate ranged from 2.5 to 6.0 with a median of 3.5. The probable reason for a higher optimum pH of biologically treated leachate is the variability in OM characteristics as compared with raw and coagulation‐treated leachate. Lau et al. (2001) and Li et al. (2010) observed that coagulation dominates the FP as compared with oxidation while using Fenton reagents for biologically treated leachate possibly due to the presence of a higher relative concentration of negatively charged OM as compared with raw and coagulation‐treated leachate.
Figure 14.11 shows the effect of optimum pH conditions on COD removal efficiencies for FO of raw and pretreated leachates. At each optimum pH condition in the range of 2.5–6.0, a wide variability in COD removal efficiency was observed, so one conclusive pH condition is difficult to determine; however, a pH range of 2.5–4.0 showed maximum COD removal efficiencies and varied in the range of 31–95%. The variability in optimum pH conditions among different studies is most likely caused by the differences in experimental conditions and the type of OM present in leachate.

Figure 14.11 Effect of ratio of optimum (a) H2O2 and Fe2+ dose, (b) H2O2 and initial COD, and (c) Fe2+ and initial COD on COD removal efficiency during landfill leachate treatment using Fenton oxidation as determined by previous studies.
(Source: Singh and Tang (2013). Reproduced with permission of Elsevier.)
14.6.3.2 Reaction Time
Oxidation of OM using Fenton reagents is a two‐stage process. In the first stage, OM rapidly (~10 min) is quickly oxidized due to the rapid generation of •OH by H2O2 and Fe2+. In the second stage, Fe3+ slowly regenerates Fe2+, which subsequently generates •OH by reacting with hydrogen peroxide. Therefore, the FP can be operated for minutes to days. A reaction time of 10 min to 2 days with a median of 60 min has been previously studied for leachate treatment as shown in Table 14.5. The large variation in reaction time is generally caused by the second‐stage reactions. Zhang et al. (2006) concluded that most of the OM in the leachate rapidly degrades within 30 min while observing the reaction for 300 min, whereas Goi et al. (2010) observed the reactions for 24 h to achieve maximum OM removal.
14.6.3.3 Effect of Reaction Time on Fenton Oxidation
The kinetics of OM removal from landfill leachate using FO was evaluated by conducting a Fenton experiment on leachate COD0 679 mg/l and LCOD 0.75 at initially adjusted pH of 2.0, 3.5, and 6.0 by Singh et al. (2013). The percentage of COD removal obtained during the FO is shown in Figure 14.12 with a fit to the exponential rise to maximum. Fenton reaction kinetics showed a two‐stage reaction at each pH conditions, and a COD removal of 26–46% was observed within 1 min of reaction that later stabilized. For an initial 1 min (first stage) of FO reaction, the catalyst Fe2+ helped in rapidly generating •OH from H2O2, and •OH rapidly oxidized OM present in leachate. However, after 1 min of reaction (second stage), the COD removal was not as fast, and only 5–9% of additional COD removal was observed. At this stage, the concentration of •OH reached a steady state due to limited availability of Fe2+. Although Fe2+ are regenerated during the Fenton reaction by Fe3+, the regeneration reaction rate of Fe2+ (10−3 to 10−2/Ms) is approximately four times slower than Fe2+ consumption (76/Ms) (Umar et al., 2010). Similar OM removal kinetics have been reported by Zhang et al. (2006). In addition, they observed the first stage of FO reaction for approximately 60 min when the pH was consistently maintained at 3.5. Singh et al. (2013) did not maintain the initially adjusted pH during the oxidation reaction, and a change in pH was reported for an initial 1 min of reaction that later stabilized in the range of 2.3–2.7. The change in pH during the initial 1 min of reaction might have led to shorter FO duration as compared with 60 min as observed by Zhang et al. (2006). The OM removal results also show that the most of the OM removal by oxidation occurred when pH was changing. Very few previously published studies have reported a change in pH during FO of leachate even when pH was not maintained at an initially adjusted level (Wang et al., 2009; Cortez et al., 2011).

Figure 14.12 Effect of reaction time on OM removal from landfill leachate using the Fenton oxidation treatment.
(Source: Singh et al. (2013). Reproduced with permission of Elsevier.)
The kinetics of OM removal by OH• can be expressed by pseudo‐first‐order kinetics as shown in Equations (14.19) and (14.20):
where
- C is the concentration of OM represented by COD
- kobs is the pseudo‐first‐order rate constant
- C0 and Ct are the concentration of OM at time 0 and t, respectively
- K is a constant dependent on kobs and amount of OM present in samples
The COD removal kinetic parameters at initially adjusted pH 2.0, 3.5, and 6.0 are shown in Table 14.6. The experimental results show a strong correlation with pseudo‐first‐order kinetics with a coefficient of determination (r2) of 0.99. Zhang et al. (2006) also described a similar observation while studying FO in a continuously stirred tank reactor. Among the three pH conditions evaluated, the greatest rate constant was for pH 3.5, which also complemented what have observed a pH range of 3.0–4.0 as the most common optimum pH condition for the Fenton treatment of leachate (Singh and Tang, 2013).
Table 14.6 Pseudo‐first‐order rate constants at different initially adjusted pH levels.
| Initial pH | k | kobs (min−1) | r2 |
| 2.0 | 48.02 | 2.132 | 0.995 |
| 3.5 | 50.44 | 2.691 | 0.996 |
| 6.0 | 42.49 | 1.967 | 0.997 |
COD removal of 50, 53, and 43% was obtained when pH was adjusted at the start of experiment to 2.0, 3.5, and 6.0, respectively. Although COD removal efficiency was observed to be dependent on the initially adjusted pH in the range of 2–6, the reaction is rather independent of pH when pH falls below 3. In the range of pH 3–4, the reaction rate increases until the reaction reaches a steady state due to the formation of ferrous hydroxides (Fe(OH)2), which react 10 times faster than Fe2+ (Pignatello et al., 2006). Based on the results of kinetic experiments and total COD removal, further experiments were conducted at an initially adjusted pH 3.5.
The increase in reaction time did not always translate into higher COD removal. Gotvajn et al. (2011) obtained 86% COD removal for COD0 of 3064 mg/l within 10 min of reaction time, whereas Kim and Huh (1997) observed 67% COD removal efficiency for COD0 of 2000 mg/l in 2 days. The characteristics of raw and pretreated leachates also did not show any conclusive impact on change in the reaction time of the FP for maximum OM removal; however, a reaction time of 10–30 min showed COD removal efficiencies in the range of 60–95%.
14.6.3.4 Temperature
FO of leachate has been investigated within a temperature range of 20–40 °C with a median temperature of 25 °C as shown in Table 14.5. Although temperature does not significantly impact the FP for OM removal, Zhang et al. (2006) observed a 10% increase in COD removal efficiencies for initial COD0 of 3000 mg/l when the reaction temperature was increased from 13 to 37°C. Zhang et al. (2006) also observed a positive effect on the amount of COD removed when temperature was increased from 17 to 37°C. Deng and Englehardt (2006) observed that temperatures greater than 50°C reduce the OM removal efficiency due to floc destabilization and insufficient H2O2 decomposition.
14.6.3.5 Fenton Reagent Dose
14.6.3.5.1 H2O2 and Fe2+ Ratio
The ratio of H2O2 and Fe2+ is another important parameter that impacts the FO process. If either of the reagents is not added in their optimal ratio, the OM removal efficiency decreases due to scavenging of •OH by either H2O2 or Fe2+. Table 14.5 shows the optimum relative ratio of H2O2 and Fe2+ in the range of 0.5–60.7 (w/w) (molar ratio 0.8–101.2) with a median of 1.2 (w/w) (molar ratio: 2.7). The biologically treated leachate showed a lower optimal ratio of H2O2 to Fe2+ doses (median: 1.6 w/w) as compared with raw (median: 3.0 w/w) and coagulation‐treated (median: 4.6 w/w) leachate. The variability in optimum relative doses might be the result of variation in leachate characteristics. Theoretically, the optimal H2O2/Fe2+ should be the ratio of rate constants for the reactions between •OH with Fe2+ and •OH with H2O2 for unsaturated organic matters. The rate constant (kt1) for the consumption of Fe2+ by •OH radicals is approximately an order higher than the rate constant (kt2) for consumption of H2O2 by •OH; therefore, it is not surprising that most reported H2O2/Fe2+ ratios in previous studies are greater than 1 (M/M) (0.6 w/w).
For a range of 0.5–60.7 (w/w) of optimum relative concentrations of H2O2 and Fe2+, the COD removal efficiencies varied from 31 to 95%. An optimal H2O2/Fe2+ in the range of 0.6–10.0 (w/w) was observed in 36 out of 41 (88%) studies, and 28 out of these 36 (78%) studies showed a COD removal efficiency in the range of 60–80%. Maximum variability (31–95%) in COD removal percentage was observed at relative concentration of 2–2.5 (w/w). The biologically treated leachate used fewer relative doses of H2O2/Fe2+ while showing comparable COD removal efficiency of 65–95% for raw and coagulation‐treated leachate. The variability in COD removal efficiencies between studies might be caused by the variation in initial concentration and type of OM present in leachate and the differences in methods of determining optimum conditions. Cotman and Gotvajn (2010) observed a declining COD removal percentage from 85 to 45% when initial COD concentration was increased from 1400 to 5000 mg/l while maintaining the relative dose of 6.1 (w/w).
14.6.3.5.2 H2O2 and COD Ratio
The effectiveness of the FP also depends on the absolute concentrations of both reagents. Although H2O2 is the main responsible reagent in oxidation of OM, overdosed H2O2 scavenges •OH as shown in Equation (14.20) and reduces the oxidation efficiency. The excess H2O2 may also self‐decompose and cause sludge floatation due to oxygen off‐gassing. Optimum H2O2 concentrations (Table 14.5) showed a median H2O2 dose of 1.2 mg H2O2/mg COD0. Raw and biological and coagulation‐treated leachate showed a median optimum dose of H2O2/COD0 as 2.4, 0.8, and 1.1, respectively. Raw leachate required a higher optimum dose of H2O2/COD0 as compared with the pretreated leachates possibly due to the nonproductive decomposition of H2O2 or higher COD0 in raw leachate. Optimum H2O2/COD0 doses varied to an order of three with a COD removal efficiency ranging from 31 to 95%. A ratio of H2O2/COD0 of less than 10 was used in 34 of 42 (81%) studies for the COD0 ranging from 93 to 177 000 mg/l. High H2O2/COD0 doses did not necessarily show greater COD removal efficiency. Trujillo et al. used optimum H2O2/COD0 dose of 1.0 for COD0 of 177 000 mg/l and observed 75% COD removal, whereas Cotman and Gotvajn (2010) and Gotvajn et al. (2011) used H2O2/COD0 in the range of 20–73 for COD0 in the range of 1400–5000 mg/l and observed COD removal percentage in the range of 45–95%. Maximum variability in COD removal efficiency of 31–85% was observed at H2O2/COD0 in the range of 0.7–1.2; however, the variability in optimal H2O2/COD0 doses among these studies is possibly due to changes in leachate characteristics, variation in methods for determining optimal dosages, or failure to maintain the optimum conditions during leachate treatment.
14.6.3.5.3 Fe2+ and COD Ratio
Initial OM oxidation rate is a function of the Fe2+ concentration, so increasing the concentration of Fe2+ increases the rate of OM oxidation. If Fe2+ is overdosed, the excess Fe2+ starts competing with OM for •OH and decreases the OM oxidation efficiency. The coagulation process also starts dominating at higher Fe2+ doses (Neyens and Baeyens, 2003), in addition to producing extra sludge and increasing TDS of effluent. Optimum Fe2+ dose in the range of 0.01–14.9 mg Fe2+/mg COD0 with a median of 0.8 Fe2+/COD0 as shown in Table 14.5. Raw leachate (median 1.3) required higher optimum Fe2+/COD0 (w/w) as compared with biologically (median 0.5) and coagulation (median 0.2)‐pretreated leachates. Optimum Fe2+ doses varied to an order of three with a COD removal efficiency ranging from 31 to 95%. Fe2+/COD0 doses in the range of 0.15–5.0 (w/w) were used in 31 out of 42 (74%) studies showing COD removal efficiency in the range of 31–85% for COD0 in the range of 93–177 000 mg/l. Similar to doses of H2O2/COD0, high doses of Fe2+/COD0 did not necessarily show significant improvement in COD removal efficiencies. Cotman and Gotvajn (2010) and Gotvajn et al. (2011) used Fe2+/COD0 in the range of 3.3–14.9 for COD0 in the range of 1400–5000 mg/l and observed COD removal in the range of 45–95%, whereas Trujillo et al. used 0.18 as optimum Fe2+/COD0 dose for COD0 of 177 000 mg/l and observed 75% COD removal efficiency.
14.6.3.6 Generalized Fenton Dosing for Landfill Leachate Treatment
Although studies on FO of landfill leachate in the past were generally focused on determining the optimum Fenton operating conditions, these studies report a large variability in terms of COD removal efficiencies under optimum conditions, so a generalized relationship between the reagent dose and COD removal efficiency was not obtained. Theoretically, 1 mg/l H2O2 can oxidize 0.47 mg/l COD, and theoretical η can be defined as Equation (14.21) (Kang and Hwang, 2000):
where η is the oxidation efficiency.
However, this relationship does not always hold true for landfill leachate. When COD0 is considerably higher than H2O2, the observed η may be greater than 100%, but when concentration of H2O2 and COD0 is comparable, η gradually decreases due to the remaining refractory OM that cannot be oxidized or to the scavenging of generated OH• by leachate alkalinity (Kang and Hwang, 2000). Therefore, the selection of an optimum H2O2 dose is very much dependent upon the COD0, and, to determine the η in landfill leachate, it is important to consider the H2O2 dose with respect to COD0.
The impact of LCOD (COD0/H2O2) on η was evaluated from the data obtained from previous studies published in peer‐reviewed literature. LCOD and the oxidation efficiency, η, were linearly correlated, and as LCOD increased from 0.01 to 34, η increased from 0.01 to 24. The linear relationship obtained between LCOD and η as shown in Equation (14.21) had a coefficient of determination (r2) of 0.99:
More importantly, the relationship (Equation 14.22) between LCOD and η holds for FO of raw and biological and coagulation‐treated leachates. Ideally, the slope of Equation (14.22) should be 1; however, due to the presence of •OH scavengers in landfill leachate, the slope of Equation (14.22) was less than 1.
14.6.3.7 Total COD Removal Under Different LCOD
The effectiveness of FO and FP treatment for total COD removal from landfill leachate can be seen for leachate of three different COD0 1092, 546, and 273 mg/l under Fenton operating conditions: LCOD in the range of 0.25–1.0, reagent dose ratio (H2O2/Fe2+) of 1.8 (w/w), and initially adjusted pH 3.5. Figure 14.13 shows that COD removal increased with a decrease in LCOD for all three leachates. Lower LCOD corresponds to higher amount of H2O2 used in the reaction that provided more O2 to oxidize OM; therefore, increased COD removal was observed with the decrease in LCOD. FO in all three leachates showed COD removal in the range of 38–52% at LCOD 0.25, which was approximately twice as much as at LCOD 1.0. COD removal due to FO also showed dependence on COD0, and leachate with COD0 1092 and 273 mg/l showed a COD removal of 52 and 38%, respectively, at LCOD 0.25, i.e. higher OM oxidation was obtained with increased availability of OM. Zhang et al. (2006) also observed a similar trend of increased COD oxidation with the increase in H2O2 dose and at higher COD0.

Figure 14.13 Effect of LCOD on COD removal by FP and FO. The filled and unfilled symbols represent COD/COD0 after FP and FO treatment, respectively.
(Source: Singh et al. (2013). Reproduced with permission of Elsevier.)
FP includes oxidation as well as coagulation–flocculation processes. During FO, OM was mineralized or transformed from high molecular weight OM (such as humic and fulvic like) to smaller OM. The smaller OM remains in the solution removed by coagulation and flocculation processes under neutral pH conditions. FP treatment of all three leachate showed more than 70 and 43% of COD removal at LCOD of 0.25 and 1.0, respectively. The highest OM removal was observed for leachate with the highest COD0. Additionally, the COD/COD0 after FO and FP treatment of all three leachates was observed to be linearly dependent upon LCOD with a slope of 0.29 and 0.37, respectively, for LCOD in the range of 0.25–1.0. The slope <1 for FO and FP treatments shows that the decrease in LCOD does not proportionally remove OM from leachate because of the presence of OM that are harder to be oxidized by OH radicals, and the amount of H2O2 applied at lower LCOD is less efficiently utilized than those at higher LCOD. Although none of the previous studies selected the Fenton reagent doses based on LCOD, mathematical conversion of doses used by Zhang et al. (2006) into LCOD also showed a linear dependence of COD removal on LCOD.
The effect of COD removal by FO, FP, and coagulation–flocculation during the Fenton treatment of three leachates with COD0 1092, 575, and 373 mg/l, respectively, was also evaluated for LCOD in the range of 0.25–1.0. As shown in Figure 14.14 by the average COD removal for all three leachates by each process, FO was a more dominant process than coagulation–flocculation at lower LCOD of 0.25, and an average of 46% COD was removed by FO, whereas 25% COD was removed by the coagulation–flocculation process. The possible reason for greater oxidation efficiency at low LCOD was the increased availability of •OH within the system. To maintain the constant H2O2/Fe2+ ratio, a lower amount of Fe2+ was used at higher LCOD as compared with Fe2+ used at lower LCOD, which caused less OM removal by coagulation processes at higher LCOD. The LCOD 1.0 showed a COD reduction of 15%, which was 10% less COD removal than at LCOD 0.25. Kang and Hwang (2000) also observed increased OM removal at higher Fe2+ doses in the coagulation process.

Figure 14.14 Effect of LCOD on COD removal by FO, coagulation, and FP. The bar and error bar represents average and standard deviation of COD removal of three leachates with COD0 1092, 575, and 373 mg/l at each LCOD.
(Source: Singh et al. (2013). Reproduced with permission of Elsevier.)
14.6.3.8 Effect of LCOD on COD Removal Efficiency
Leachate with the highest COD0 (1092 mg/l) showed ηFO in the range of 0.15–0.26 for LCOD variation in the range of 0.25–1.0, in addition to showing relatively greater ηFO among the three leachates at each LCOD (Figure 14.15). For all three initial COD0 concentrations of leachate, ηFO increases from 0.11 ± 0.03, 0.15 ± 0.05, 0.20 ± 0.02, to 0.22 ± 0.02 at LCOD 0.25, 0.50, 0.75, and 1.0, respectively. The higher COD0, which corresponds to a relatively greater amount of OM present to be oxidized and higher LCOD, which corresponds to a lower amount of available O2 or •OH for oxidation of OM, leads to the increased possibility of •OH radical reaction with OM. As a result, ηFO increases with LCOD. The average ηFO for all three initial COD0 concentrations of leachate also showed a linear relationship with the increase in LCOD in the range of 0.25–1.0, which implies that the parameter LCOD derived from the COD0 and applied H2O2 dose can help in predicting the OM oxidation efficiency for any leachate.
Figure 14.15 Effect of LCOD on ηFO, ηFP, and  as obtained by model equation (14.25) for LCOD in the range of 0.25–1.0 for three landfill leachates with COD0 1092, 546, and 273 mg/l, respectively. The filled and unfilled symbols represent ηFP and ηFO, respectively.
(Source: Singh et al. (2013). Reproduced with permission of Elsevier.)
The COD removal efficiency due to FP (ηFP) also showed greatest utilization of available O2 at higher COD0 and at COD0 1092 mg/l; the ηFP varied in the range of 0.20–0.49 for LCOD ranging from 0.25 to 1.0. Similar to the FO, the FP also showed an increase in ηFP with the increase in LCOD. At LCOD 0.25, 0.50, 0.75, and 1.0, the average ηFP increases from 0.17 ± 0.02, 0.30 ± 0.03, 0.36 ± 0.03, to 0.47 ± 0.01, respectively. As discussed earlier, the higher the LCOD, the greater the possibility of OM reacting with •OH radicals, leading to the completely mineralization of OM or its transformation into smaller OM. These smaller OM may coagulate during the coagulation–flocculation process, thereby showing increased ηFP with the increase in LCOD. Additionally, ηFP was observed to be linearly increasing with LCOD ranging from 0.25 to 1.0 with a slope of 0.38, so the application of LCOD for selecting Fenton oxidant H2O2 dose can be useful in predicting the treatment efficiency of landfill leachate.
LCOD and ηFP were plotted against the relationship between LCOD and ![]() (Equation 14.25) as obtained by Singh and Tang (2013) for LCOD in the range of 0.25–1.0. For LCOD in the range of 0.25–0.75,
(Equation 14.25) as obtained by Singh and Tang (2013) for LCOD in the range of 0.25–1.0. For LCOD in the range of 0.25–0.75, ![]() was lower as compared with ηFP obtained by experimental data; however, for LCOD in the range of 0.75–1.0, the
was lower as compared with ηFP obtained by experimental data; however, for LCOD in the range of 0.75–1.0, the ![]() was higher than the ηFP. The experiments were conducted at pH 3.5 and the H2O2/Fe2+ dose ratio of 1.8, which is the median of previous studies as reported by Singh and Tang (2013) without determining the optimum Fenton conditions of each leachate. Figure 14.15 shows that the line of ηFP versus LCOD intercepts the line of
was higher than the ηFP. The experiments were conducted at pH 3.5 and the H2O2/Fe2+ dose ratio of 1.8, which is the median of previous studies as reported by Singh and Tang (2013) without determining the optimum Fenton conditions of each leachate. Figure 14.15 shows that the line of ηFP versus LCOD intercepts the line of ![]() versus LCOD at LCOD 0.75. This suggests that ηFP is the same as the
versus LCOD at LCOD 0.75. This suggests that ηFP is the same as the ![]() obtained at the optimum conditions by previous studies at LCOD 0.75. Therefore, LCOD 0.75 could be used as an optimum dose for all three different initial COD0 of leachate. As a result, it could be concluded that the universal relationship between
obtained at the optimum conditions by previous studies at LCOD 0.75. Therefore, LCOD 0.75 could be used as an optimum dose for all three different initial COD0 of leachate. As a result, it could be concluded that the universal relationship between ![]() and LCOD under optimum conditions could be applied in determining the optimum Fenton oxidant dose without performing multiple experiments according to its initial COD0 and the desired
and LCOD under optimum conditions could be applied in determining the optimum Fenton oxidant dose without performing multiple experiments according to its initial COD0 and the desired ![]() .
.
14.6.3.9 Effect of LCOD on Biodegradability
Lopez et al. (2004) found the effectiveness of the Fenton reagent process for pretreating landfill leachate in order to improve its biodegradability (defined as BOD5/COD) to be ≥0.5, a value compatible with subsequent aerobic biological treatment. In their study, the leachate analyzed had a low concentration of heavy metals, a pH value of 8.2, a BOD5/COD ratio of 0.2, and high contents of NH4–N (5210 mg/l) and alkalinity (2174 mg/l) and therefore was classified as “old” and nonbiodegradable. To maximize the effectiveness of the FP (i.e. minimize scavenging effects), it was necessary to determine the optimal operational H2O2/Fe2+ mass ratio using a constant concentration of H2O2 of 6300 mg/l. This ratio was determined to be 12 (6300/500). Maintaining this mass ratio, the leachate was treated with increasing amounts of both reagents in order to determine the maximum amount of COD removed, which was determined to be 60% removal for dosages of 10 000 mg/l of H2O2 and 830 mg/l of Fe2+. Also maintaining the mass ratio of 12, experiments were conducted in order to determine the achievement of a BOD5/COD ratio of ≥0.5, which was achieved with dosages of 3300 mg/l of H2O2 and 275 mg/l of Fe2+ as indicated in Figure 14.16. Lopez et al. (2004) concluded that their results were encouraging and should be tested on a larger scale as the results indicated a technologically simple and cost‐effective method for improving the biodegradability of leachate.
Figure 14.16 Optimal dosage of H2O2 for BOD5/COD ratio of >0.5.
(Source: Data from Lopez et al. (2004).)
A common approach to landfill leachate treatment is to transfer leachate to a wastewater treatment facility where it is subjected to low‐cost biological treatment after mixing with municipal sewage (Renou et al., 2008). However, the low biodegradability of stabilized leachate as compared with municipal sewage affects the treatment performance of WWTPs that are often built for the treatment of municipal wastewater (Diamadopoulos et al., 1997). Therefore, a single or combination of physicochemical processes that help improve leachate biodegradability is often used as a pretreatment step in biological processes (Lin and Chang, 2000). The most common physicochemical processes that help reduce refractory OM from landfill leachate treatment are coagulation (Comstock et al., 2010), anion exchange (Singh et al., 2012a), AC adsorption (Maranon et al., 2009; Singh et al., 2012b), and chemical oxidation (Rivas et al., 2004; Tizaoui et al., 2007).
In the past decade, the applicability of AOPs for removing OM and improving the biodegradability of leachate has attracted significant interest from various researchers (Umar et al., 2010). Singh et al., 2013 evaluated the biodegradability of leachate by analyzing the BOD5 of raw and treated leachate samples. Figure 14.17 showed that a twofold increase in BOD5 at each LCOD in the range of 0.25–1.0 during Fenton oxidation (FO), with the maximum increase of 2.4 times at LCOD of 0.25. When LCOD range varied from 0.5 to 1.0 of 0.50–1.0 BOD5/BOD5,0 was increased from 1.9 to 2.4. The smaller LCOD corresponds to a higher amount of available O2 or •OH for oxidation, so more OM may be transformed into biodegradable form as compared with the higher LCOD. OM that were resistant to reaction with •OH did not transform into biodegradable form, so the application of a higher amount of H2O2 at lower LCOD would not provide additional benefit in terms of improving the biodegradability of leachate. FP showed smaller BOD5/BOD5,0 as compared with FO at each LCOD and varied in the range of 1.4–2.1. The increase in BOD5 after FO was greater than after FP because after FO, the larger OM that are transformed into smaller OM coagulate with each other at an increased pH. Although most of the coagulated OM was precipitated during the precipitation process, the coagulated OM that are still present in the sample are harder to biologically degrade, thus showing less BOD5 by FP than FO.
Figure 14.17 Effect of LCOD on BOD5/ after FO and FP treatment of leachates. The bar diagrams are generated using average BOD5 values of three leachates with COD0 1092, 546, and 273 mg/l.
(Source: Singh et al. (2013). Reproduced with permission of Elsevier.)
14.6.3.10 Effect of LCOD on Cost of Fenton Process Treatment for Landfill Leachate
The amounts of H2O2, FeSO4⋅7H2O, acid (H2SO4), and base (NaOH) used for pH adjustment for oxidation of leachate can be used to estimate the required amount of each chemical in leachate treatment. The unit price for each chemical was collected from the commercial grade chemical suppliers, and the cost associated with each chemical and total cost was calculated using Equations (14.23) and (14.24):
where total and chemical cost was in $/m3 of leachate to be treated, unit chemical cost in $/m3 of chemical to be used for leachate treatment, and chemical consumption in m3 of chemical to be used /m3 of leachate to be treated.
The average commercial grade cost of H2O2 (35% w/w), FeSO4⋅7H2O, H2SO4 (98%), and NaOH (97%) was found to be $510, 75, 200, and 325/ton, respectively. The cost of H2O2 (35% w/w) was found to be the major cost‐contributing chemical in FP. The chemical consumption cost at each LCOD for the three leachates was calculated as shown in Figure 14.18. Leachate with the highest COD0 and lowest LCOD (COD0 1092 mg/l at LCOD of 0.25) was observed to be the most expensive treatment case with a total chemical cost of $17.11/m3, whereas leachate with low COD0 (273 mg/l) and the highest LCOD (1.0) required a chemical cost of $1.30/m3. Additionally, the total chemical cost for all three leachates exponentially decreased with an increase in LCOD. The LCOD 0.25 required an average of $10.3/m3 of leachate, whereas at LCOD 1.0, the estimated chemical cost was $2.9/m3. The high cost at low LCOD was primarily due to the amount of H2O2 used for the Fenton reaction and relatively high usage of H2SO4 and NaOH for pH adjustment as compared with the Fenton treatment of LCOD in the range of 0.50–1.0.

Figure 14.18 Chemical cost associated with the treatment of three leachates using FP and average ηFP for LCOD in the range of 0.25–1.0.
(Source: Singh et al. (2013). Reproduced with permission of Elsevier.)
The average cost associated with treatment of three leachates using FP was also evaluated with respect to ηFP. For LCOD smaller than approximately 0.47, the ηFP decreased, while the treatment cost exponentially increased. However, for LCOD greater than 0.47, the treatment cost associated with chemical usage decreased and ηFP increased. Therefore, LCOD less than 0.47 would not be cost effective due to decrease in ηFP and increase in treatment cost. The total chemical cost was also calculated in terms of per m3 of leachate treated per mg/l COD removed. The average cost for all three initial leachate CODo varied in the range of 8.2 × 10⁻³–2.0 × 10⁻² ($/m3 of leachate/mg/l COD removed) for LCOD in the range of 0.25–1.0. Although not enough information has been published on the cost analysis of leachate treatment using FP, Rivas et al. (2004) observed a comparable treatment cost of $0.008/m3 of leachate/mg/l of COD removed for H2O2 at a cost of $300/ton.
Dimensionless parameter LCOD could be used to predict the optimal Fenton oxidant doses without performing multiple experiments. To establish a universal dimensionless equation between the optimal efficiency of Fenton and the LCOD, Singh et al. (2013) conducted Fenton treatment of three leachates for LCOD in the range of 0.25–1.0. The kinetics of FO showed that the oxidation process reached stable stage within 1 min at the start of reaction and showed a maximum COD removal of 46% at pH 3.5, depicting FO as a very quick efficient process for OM removal from landfill leachate. The lower the LCOD, the greater the COD removal observed, and a maximum of 52 and 70% COD removal was observed at LCOD 0.25, by FO and FP, respectively. However, the usability of Fenton oxidation was greater at LCOD 1.0 than at LCOD 0.25 as observed by higher ηFO and ηFP. The comparison of experimental results with the model equation ![]() as developed by Singh and Tang (2013) showed LCOD 0.75 as an optimum LCOD for any leachate. Therefore, the selection of Fenton oxidant dose in terms of LCOD and comparison of experimental results with the equation
as developed by Singh and Tang (2013) showed LCOD 0.75 as an optimum LCOD for any leachate. Therefore, the selection of Fenton oxidant dose in terms of LCOD and comparison of experimental results with the equation ![]() may eliminate the practice of performing multiple experiments to determine optimum Fenton operating conditions. Leachate biodegradability with respect to LCOD showed an increase in BOD5 in the range of 1.9–2.4 after FO for LCOD in the range of 0.25–1.0. Additionally, FO showed greater biodegradability improvement than FP. The evaluation of leachate treatment cost (chemical) showed an exponential increase with the decrease in LCOD, and LCOD greater than 0.47 showed cost‐effective treatments by decreasing cost and increasing COD removal efficiencies.
may eliminate the practice of performing multiple experiments to determine optimum Fenton operating conditions. Leachate biodegradability with respect to LCOD showed an increase in BOD5 in the range of 1.9–2.4 after FO for LCOD in the range of 0.25–1.0. Additionally, FO showed greater biodegradability improvement than FP. The evaluation of leachate treatment cost (chemical) showed an exponential increase with the decrease in LCOD, and LCOD greater than 0.47 showed cost‐effective treatments by decreasing cost and increasing COD removal efficiencies.
14.7 Validation and Uncertainty
The validation and uncertainty analysis of the relationship between η and LCOD determined the mean (ηmean) and the standard deviation (σ) for a confidence interval of 95%. For a level of confidence of 95%, η lies between ηmean and is two times the σ that is ηmean ± 2σ (Tang and Wang, 2010). The impact of LCOD on ηmean and ηmean ± 2σ is shown in Figure 14.19. The uncertainty analysis showed a smaller window of error between ηmean + 2σ and ηmean − 2σ, and the predicted η was approximately the same as observed η from previous studies. Therefore, Equation (14.22) may be used to determine η for any type of landfill leachate at the LCOD in the range of 0.01–34, while optimal operating conditions for other parameters are maintained. Maximum OM removal by FO is obtained under optimum conditions of pH, H2O2/Fe2+, reaction time, temperature, and reagent doses (H2O2/COD0 and Fe2+/COD0). Conventionally these optimum conditions are determined by multiple laboratory or pilot‐scale experiments.
Figure 14.19 Effect of COD loading factor on COD removal efficiency observed by previous studies and COD removal efficiency at 95% confidence interval.
(Source: Singh and Tang (2013). Reproduced with permission of Elsevier.)
FO of raw and biological and coagulation‐treated leachate showed an average COD removal of 67% for an average COD0 of 4024 mg/l, but the medians of COD0 and COD removal efficiency were 1500 mg/l and 70%, respectively. The pretreated leachates showed a higher average of COD removal efficiencies (>70%) compared with that of raw leachates (65%). The optimal operating conditions generally varied in a range such that pH varied from 2.5 to 4.0 and H2O2/Fe2+ ratio from 0.6 to 10.0 (w/w) with COD removal efficiencies ranging from 31 to 95%. Biologically treated leachate showed a relatively lower optimum ratio of H2O2/Fe2+ doses (median: 1.6 w/w) as compared with raw (median: 3.0 w/w) and coagulation‐treated (median: 4.6 w/w) leachate. Median H2O2 and Fe2+ doses were 1.2 H2O2/COD0 and 0.8 Fe2+/COD0, respectively. Additionally, raw leachate required higher optimum doses of H2O2 and Fe2+ as compared with the pretreated leachates. LCOD and η showed a strong linear relationship such that when LCOD increased from 0.01 to 34, η increased as ![]() . This linear relationship between LCOD and η holds for FO of raw and biological‐ and coagulation‐treated leachates. As a result, the relationship can be used as a universal equation to predict Fenton η for LCOD in the given range.
. This linear relationship between LCOD and η holds for FO of raw and biological‐ and coagulation‐treated leachates. As a result, the relationship can be used as a universal equation to predict Fenton η for LCOD in the given range.
The effectiveness of the FP depends on the selection of optimum Fenton operating conditions such as pH, reaction time, reaction temperature, H2O2 and Fe2+ doses, and their ratio, so previous studies on landfill leachate treatment were primarily focused on determining optimum Fenton operating conditions for specific leachates that required the conducting of multiple experiments. More often than not, previously published literature does not provide a good rationale in selecting Fenton doses used to determine optimum dose, so a wide range of Fenton optimum conditions have been reported by previous studies that do not provide confirmed universal operating conditions for landfill leachate treatment (Deng and Englehardt, 2006). Singh and Tang (2013) statistically analyzed Fenton optimum operating conditions for landfill leachate treatment reported by previous researchers and developed a linear relationship (Equation 14.25) between dimensionless parameter COD removal efficiencies (![]() ) and COD loading factor (LCOD):
) and COD loading factor (LCOD):
where ![]() and LCODare defined as
and LCODare defined as ![]() and
and ![]() , respectively. The “available O2” is the amount of reactive O2 equivalent to the added H2O2. Theoretically, 1 mg/l of H2O2 has 0.47 mg/l of available O2 for oxidation.
, respectively. The “available O2” is the amount of reactive O2 equivalent to the added H2O2. Theoretically, 1 mg/l of H2O2 has 0.47 mg/l of available O2 for oxidation.
During Fenton treatment of landfill leachate, H2O2 is the main responsible reagent that generates •OH to oxidize OM, and the concentration of catalyst Fe2+ can always be determined according to the optimal H2O2/Fe2+. Therefore, selecting the dose of H2O2 is the most critical parameter in the Fenton treatment. Singh et al., (2013) concluded that the dimensionless parameter LCOD could be a major factor in determining OM removal efficiency (η) by the Fenton treatment. As a result, LCOD allows the selection of a dose of H2O2 based on the COD0 of leachate by Equation (14.25) in determining optimum Fenton reagent doses.
14.8 Exercise
14.8.1 Questions
- List at least four factors that influence leachate generation rate.
- Why is leachate control necessary?
- List at least four conditions that will influence leachate chemical characteristics.
- Please explain why leachate is toxic.
- What does it imply when the theoretical molar ratio of H2O2/Fe2+ should be 11?
- Should leachate be treated with wastewater in WWTP?
- Why is equation
 considered as an universal equation? What are the limits of this equation?
 - What type of organic compound would be oxidized the most at this ratio at pH 3.5?
14.8.2 Calculations
- If H2O2 and Fe2+ were dosed at 1 and 0.1 mM, what would be the steady‐state concentration of hydroxyl radical at pH 3.5? If a leachate has the same water quality as listed in Table 14.2 and has COD of 1500 mg/l, what treatment efficiency would you expect at pH 3.5?
- In Miami‐Dade Southern WWWTP, there are two treatment systems of leachate. One treats 1.2 MGD that is discharged to WWTP of 75 MGD WWTP, while 0.32 MGD leachate was treated and sent to the 35 MGD WWTP. If the leachate quality is the same as those listed in Table 14.2, please design a leachate treatment process of 1.52 MGD to meet the following standards:
- BOD5 less than 20 mg/l, TSS less than 20 mg/l, total N less than 5, and total P less than 0.4 mg/l for deep well injection.
- BOD5 less than 10 mg/l, TSS less than 10 mg/l, total N less than 2, and total P less than 0.02 mg/l for water reuse, what are the additional unit processes should be added to the above treatment train?
- For water reuse, UV disinfection is usually used to reduce the production of disinfection by‐products (DBPs). What are the major barriers if the treated leachate is going to be disinfected with UV? What are the technologies you would recommend to improve the system so that UV disinfection would be effective?
14.8.3 Projects
14.8.3.1 Xiongan Project
- One of the major challenges is to remediate contaminated water bodies within Xiongan district. 85% of Baiyangding that has 366 km2 and 143 lakes locate within Xiongan district. However, major effluent of 250 000 m3/day from Baoding WWTP was discharged to the Baiyangding. Since the Baoding WWTP has only secondary treatment, the discharge concentrations of N and P are 20 and 2 mg/l, respectively. Please propose a WRRF to reach discharge standards of N less than 2 and P less than 0.02 mg/l.
- It is proposed to build another WWTP of 160 000 m3/day. What would be the best treatment train in WRRF so that discharge concentration of BOD5, TSS, and total N and P could be less than 10, 10, 2, and 0.02 mg/l and energy neutral? Please design this WRRF.
- In Xiongan district, leachate from open dumping contaminates surface water and groundwater. Use the ASM3biop models to predict the performance of WWTPs using activated sludge process. Please assess the performance improvement of the following technologies:
- Without leachate.
- With leachate of 5% flow rates.
- If UV disinfection is used to eliminate virus and bacteria of treated wastewater, what effect of leachate would most likely to have on the UV disinfection process?
- How would you eliminate or minimize the leachate effect?
- Develop two remediation alternatives of leachate for Xiongan for 5, 10, 20, and 50 years. Please conduct a life cycle cost and benefit analysis of each leachate treatment alternative and recommend one as the best SEE design.
14.8.3.2 Community Project
- Miami‐Dade Water and Sewer Department is assessing different alternatives of leachate treatment. If the leachate has typical water quality as follows and has an average flow rate of 2 MGD, estimate the following (Table 14.7):
- Unit energy consumption reduced due to leachate is diverted away from the WWTP.
- Electricity consumption reduced due to decreasing loading of COD to WWTP.
- Amount of sludge that could have been produced in WWTP.
- Please contact your local solid waste management authority agency and obtain the following information:
- Amount of leachate generated each day in local landfills.
- How is it treated?
- Design SEE alternatives to improve the leachate treatment system.
- Use computer models such as ASM3biop to evaluate retrofitting strategies of existing WWTP to energy positive.
Table 14.7 Physicochemical characteristics of leachate.
Parameter
Average
Standard deviation
pH (S.U.)
7.51
0.09
DO (mg/l)
2.6
Conductivity (mS/cm)
28.6
1.4
TDS (mg/l)
19 066
757
BOD5 (mg/l)
151
50
COD (mg/l)
2 183
46.8
BOD5/COD
0.07
—
TOC (mg/l)
778
73
Alkalinity (mg/l as CaCO3)
2 345
35
References
- Amokrane, A., Comel, C., and Veron, J. (1997). Landfill leachates pre‐treatment by coagulation‐flocculation. Water Research 31 (11): 2775–2782.
- Bae, W., Jones, P.G., and Inouye, M. (1997). CspA, the major cold‐shock protein of Escherichia coli, negatively regulates its own gene expression. Journal of Bacteriology 179: 7081–7088.
- Bosnjakovic, A., and Schlick, S. (2006). Spin trapping by 5,5‐dimethylpyrroline‐ N–oxide in Fenton media in the presence of nafion perfluorinated membranes: limitations and potential. The Journal of Physical Chemistry B 110: 10720–10728.
- Buettner, G.R. (1993). The spin trapping of superoxide and hydroxyl free radicals with DMPO (5,5‐dimethylpyrroline‐N‐oxide): more about iron. Free Radical Research 19: s79–s87.
- Buxton, G.V., Greenstock, C.L., Helman, W.P., and Ross, A.B.(1988). Critical review of rate constants for reactions of hydrated electrons, hydrogen atoms and hydroxyl radicals in aqueous solution. Journal of Physical and Chemical Reference Data 17: 513–886.
- Comstock, S.E.H., Boyer, T.H., Graf, K.C., and Townsend, T.G. (2010). Effect of landfill characteristics on leachate organic matter properties and coagulation treatability. Chemosphere 81: 976–983.
- Cortez, S., Teixeira, P., Oliveira, R., and Mota, M. (2011). Evaluation of Fenton and ozone‐based advanced oxidation processes as mature landfill leachate pre‐treatments. Journal of Environmental Management 92: 749–755.
- Cotman, M. and Gotvajn, A.Z. (2010). Comparison of different physico‐chemical methods for the removal of toxicants from landfill leachate. Journal of Hazardous Materials 178: 298–305.
- Deng, Y. and Englehardt, J.D. (2006). Treatment of landfill leachate by the Fenton process. Water Research 40: 3683–3694.
- Diamadopoulos, E., Samaras, P., Dabou, X., and Sakellaropoulos, G.P. (1997). Combined treatment of landfill leachate and domestic sewage in a sequencing batch reactor. Water Science and Technology 36: 61–68.
- Duesterberg, C.K. and Waite, T.D. (2006). Process optimization of Fenton oxidation using kinetic modeling. Environmental Science and Technology 40: 4189–4195.
- Fontmorin, J.M., Burgos‐Castillo, R.C., Tang, W.Z., and Sillanpää, M. (2016). Stability of 5,5‐dimethyl‐1‐pyrroline‐N‐oxide as a radical spin trap agent for quantification of hydroxyl radical concentration in processes based on Fenton reaction. Water Research 99: 24–32.
- Goi, N., Morishita, K., Taniguchi, A. et al. (2010). Evaluation of percutaneous permeation of flurbiprofen and ketoprofen after application of transdermal patches using a lateral sectioning approach in hairless rats. Pharmaceutical Development and Technology 15: 658–665.
- Gotvajn, A.Z., Končan, J.Z., and Cotman, M. (2011). Fenton's oxidative treatment of municipal landfill leachate as an alternative to biological process. Desalination 275: 269–275.
- Gulsen, H., Turan, M. (2004). Treatment of Sanitary Landfill Leachate Using a Combined Anaerobic Fluidized Bed Reactor and Fenton's Oxidation. Environmental Engineering Science 21 (5): 627–636.
- Haywood, R. (2013). Spin‐trapping: theory and applications. In: Encyclopedia of Biophysics, pp. 2447–2453. Berlin/Heidelberg: Springer.
- Huang, C.P., Dong, C., and Tang, W.Z. (1993). Advanced chemical oxidation: its present role and potential future in hazardous waste treatment. Waste Management 13: 361–377.
- Lau, I.W.C., Wang, P., and Fang, H.H.P. (2001). Organic removal of anaerobically treated leachate by Fenton coagulation. Journal of Environmental Engineering 127 (7): 666–669.
- Kang, Y.W. and Hwang, K.Y. (2000). Effects of reaction conditions on the oxidation efficiency in the Fenton process. Water Research 34: 2786–2790.
- Kim, Y. and Huh, I.(1997). Enhancing biological treatability of landfill leachate by chemical oxidation. Environmental Engineering Science 14 (1): 73–79.
- Kochany, J. and Lipczynska‐Kochany, E. (2009). Utilization of landfill leachate parameters for pretreatment by Fenton reaction and struvite precipitation a comparative study. Journal of Hazardous Materials 166: 248–254.
- Li, J.P., Wu, Z.W., Jiang, Z.H., and He, J.H. (2010). Can global warming strengthen the East Asian summer monsoon?. Journal of Climate 23: 6696–6705.
- Li, L., Abe, Y., Kanagawa, K. et al. (2007). Iron‐chelating agents never suppress Fenton reaction but participate in quenching spin‐trapped radicals. Analytica Chimica Acta 599: 315–319.
- Lin, S.H. and Chang, C.C. (2000). Treatment of landfill leachate by combined electro‐fenton oxidation and sequencing batch reactor method. Water Research 34: 4243–4249.
- Lopez, A., Pagano, M., Volpe A., and Di Pinto, A.C. (2004). Fenton’s pre‐treatment of mature landfill leachate. Chemosphere 54 (7): 1005–1010.
- Makino, K., Hagi, A., Ide, H. et al. (1992). Mechanistic studies on the formation of aminoxyl radicals from 5,5‐dimethyl‐1‐pyrroline‐N‐oxide in Fenton systems. Characterization of key precursors giving rise to background ESR signals. Canadian Journal of Chemistry 70: 2818–2827.
- Makino, K., Hagiwara, T., Imaishi, H. et al. (1990). DMPO spin trapping in the presence of Fe ion. Free Radical Research Communications 9: 233–240.
- Maranon, E., Castrillon, L., Fernandez‐Nava, Y. et al. (2009). Tertiary treatment of landfill leachates by adsorption. Waste Management and Research 27: 527–533.
- Mohajeri, S., Aziz, H.A., Isa, M.H. et al. (2010). Statistical optimization of process parameters for landfill leachate treatment using electro‐Fenton technique. Journal of Hazardous Materials 176: 749–758.
- Neyens, E. and Baeyens, J. (2003). A review of thermal sludge pre‐treatment processes to improve dewaterability. Journal of Hazardous Materials 98 (1–3): 51–67.
- Pignatello, J.J., Oliveros, E., and MacKay, A. (2006). Advanced oxidation processes for organic contaminant destruction based on the Fenton reaction and related chemistry. Critical Reviews in Environment Science and Technology 36: 1–84.
- Renou, S., Givaudan, J.G., Poulain, S. et al. (2008). Landfill leachate treatment: review and opportunity. Journal of Hazardous Materials 150: 468–493.
- Rivas, F.J., Beltran, F., Carvalho, F. et al. (2004). Stabilized leachates: sequential coagulation‐flocculation plus chemical oxidation process. Journal of Hazardous Materials 116: 95–102.
- Rivas, F.J., Beltran, F., Gimeno, O., and Carvalho, F. (2003). Fenton‐like oxidation of landfill leachate. Journal of Environmental Science and Health, Part A 38: 371–379.
- Si, J.C., Lu, L., Gao, Z.F. et al. (2014). A sensitive electrochemical method based on Fenton‐induced DNA oxidation for detection of hydroxyl radical. Analytical Methods 6: 6536–6540.
- Silva, A.C., Dezotti, M., and Jr Sant’Anna, G.L. (2004). Treatment and detoxification of a sanitary landfill leachate. Chemosphere 55: 207–214.
- Singh, S.K. and Tang, W.Z. (2013). Statistical analysis of optimum Fenton oxidation conditions for landfill leachate treatment. Waste Management 33 (1): 81–88.
- Singh, S.K., Tang, W.Z., and Tachiev, G. (2013). Fenton treatment of landfill leachate under different COD loading factors. Waste management 33 (10): 2116–2122.
- Singh, S.K., Townsend, T.G., and Boyer, T.H. (2012a). Evaluation of coagulation (FeCl3) and anion exchange (MIEX) for stabilized landfill leachate treatment and high‐pressure membrane pretreatment. Separation and Purification Technology 96: 98–106.
- Singh, S.K., Townsend, T.G., Mazyck, D., and Boyer, T.H. (2012b). Equilibrium and intraparticle diffusion of stabilized landfill leachate onto micro‐ and meso‐porous activated carbon. Water Research 46: 491–499.
- Tabet, K., Moulin, P., Vilomet, J.D. et al. (2002). Purification of landfill leachate with membrane processes: preliminary studies for an industrial plant. Separation Science and Technology 37: 1041–1063.
- Tang, W.Z. (2004). Physicochemical treatment of hazardous wastes. Boca Raton, FL: Lewis Publishers.
- Tang, W.Z. and Huang, C.P. (1997). Stoichiometry of Fenton’s reagent in the oxidation of chlorinated aliphatic organic pollutants. Environmental Technology 18: 13−23.
- Tang, W.Z. and Wang, F. (2010). Quantitative structure activity relationship (QSAR) of chlorine effects on E(LUMO) of disinfection by‐product: chlorinated alkanes. Chemosphere 78: 914–921.
- Tatsi, A.A.A., Zouboulis, A.I., Matis, K.A., and Samaras, P (2003). Coagulation‐flocculation pretreatment of sanitary landfill leachates. Chemosphere 53: 737–744.
- Telgmann, R. and Wulkow, M. (2005). Presto‐Kinetics−Simulation of Kinetic Models. Rastede: Computing in Technology GmbH.
- Tizaoui, C., Bouselmi, L., Mansouri, L., and Ghrabi, A. (2007). Landfill leachate treatment with ozone and ozone/hydrogen peroxide systems. Journal of Hazardous Materials 140: 316–324.
- Trebouet, D., Schlumpf, J.P., Jaouen, P., and Quemeneur, F. (2001). Stabilized landfill leachate treatment by combined physicochemical–nanofiltration processes. Water Research 35 (12): 2935–2942.
- Tsai, C.H., Stern, A., Chiou, J.F. et al. (2001). Rapid and specific detection of hydroxyl radical using an ultra weak chemiluminescence analyzer and a low level chemiluminescence emitter: application to hydroxyl radical‐scavenging ability of aqueous extracts of food constituents. Journal of Agricultural and Food Chemistry 49: 2137–2141.
- Umar, M., Aziz, H.A., Yusoff, M.S. (2010). Trends in the use of Fenton, electro‐Fenton and photo‐Fenton for the treatment of landfill leachate. Waste Management 30: 2113–2121.
- Wang, X.J., Chen, S.L., Go, X.Y., and Wang, K.Y. (2009). Pilot study on the advanced treatment of landfill leachate using a combined coagulation, Fenton oxidation and biological aerated filter process. Waste Management 29: 1354–1358.
- Xiang, Q., Yu, J., and Wong, P.K. (2011). Quantitative characterization of hydroxyl radicals produced by various photocatalysts. Journal of Colloid and Interface Science 357: 163–167.
- Zhang, H., Choi, H.J., and Huang, C.P. (2006). Treatment of landfill leachate by Fenton’s reagent in a continuous stirred tank reactor. Journal of Hazardous Materials 136: 618–623.
- Zhao, H., Gao, J., Zhou, W. et al. (2015). Quantitative detection of hydroxyl radicals in Fenton system by UV‐vis spectrophotometry. Analytical Methods 7: 5447–5453.