10
Recovery
No material is wasted in a functioning ecosystem.
10.1 Principle 7
The degree of recovering water, energy, nutrient, and materials from wastewater (WW) reflects the sustainable level in EEIS design. In theory, almost all the wastewater (WW) could be recovered to reusable water because contaminants in WW is less than 0.1% by weight. However, not all the water could be recovered because water used in economy tend to dissipate within the economic system due to the second law of thermodynamics. In addition, energy resources are usually not recyclable. Energy would deteriorate to lower grade energy in addition to dissipation in the environments. Indeed, entropy would put a limit in designing recovery processes of EEIS. This irreversible energy degradation rate depends upon not only the ratio between the intensities of output and input flows but also the energy quality. Therefore, the ultimate decision whether to recover water, energy, nutrient, and materials from WW depends upon the life cycle cost and benefit analysis (LCCBA) of different alternatives. The prevention principle is illustrated in Box 10.1.
In nature, almost all the material, nutrients, and water are recycled. In modern society, however, the traditional environmental engineering design focuses on treatment and disposal. However, when the accumulation rate is significantly greater than the treatment capacity, waste would end in the environments without adequate treatment. If cost is not a limited factor, all materials could be recovered through environmental engineering infrastructure system as shown in Table 10.1.
Table 10.1 Recovery of materials and energy.
| Design | Problems | Mass | Energy |
| Air | Landfill CH4 | Bioreactor landfills | CH4 |
| Carbon dioxide from coal power plants | Carbon sequestration | Methanol | |
| Water | Nutrients | N and P | Struvite |
| Wastewater | Reclaimed water | CH4 or electricity | |
| Land | Soil erosion | Regenerative GI | Biomass |
| Ecological | Algae boom | Constructed wetlands | Blue algae for biodiesel |
To recover methane, landfills can be designed in such a way that they produce methane and is referred to as bioreactor landfill. WW contains nutrients such as N and P, energy as methane, and treated WW. For land, green infrastructure aims to maximize primary biomass production and reduce pollution of water bodies. Algae could be recovered from eutrophic lakes. For WW, most of the nitrogen are in soluble and colloidal organic forms. The amount removed by primary sedimentation is limited to about 15%, and activated sludge (AS) removes another 10%. Twenty‐five percentage of nitrogen removal equals about four percentage of the BOD applied. With a total reduction of only 25%, the effluent contains 26 mg/l nitrogen of the original 35 mg/l. Approximately 2 mg/l is organic nitrogen bound in the effluent suspended solids. The remaining 24 mg/l is in the form of ammonia, except when nitrification occurs during aeration. Figure 10.1 is a diagram tracing nitrogen through a hypothetical treatment plant. The nitrogen concentration in the influent WW is assigned a value of 100%. To recover energy, sludge is stabilized by anaerobic digestion, and the ammonia released from decomposition of the sludge solids is returned to the influent of the treatment plant in supernatant from the digester. Assuming 40% of the organic nitrogen in the sludge is converted to ammonia, 10% of the original 25% is recycled to the treatment plant and appears in the effluent, which then contains 85% of the influent nitrogen. Depending on variations in nitrogen content of the WW and methods of sludge processing, nitrogen removal in conventional biological treatment systems ranges from 20% up to 40%.

Figure 10.1 Diagram tracing wastewater nitrogen through a hypothetical treatment plant.
10.2 Phosphorus Removal from Wastewater
The common forms of phosphorus in WW are orthophosphate (PO43−), polyphosphates (polymers of phosphoric acid), and organically bound phosphates. Polyphosphates such as hexametaphosphate gradually hydrolyze in water to the soluble orthoform, and bacterial decomposition of organic compounds also releases orthophosphate. With the majority of compounds in WW being soluble, phosphorus is removed only sparingly by sedimentation. Secondary biological treatment removes phosphorus by biological uptake; however, relative to the quantities of nitrogen and carbon, the amount of phosphorus is greater than necessary for biological synthesis. As a result, conventional treatment process removes only about 20–40% of the influent phosphorus.
10.2.1 Phosphorus Removal in Conventional Treatment
Phosphorus enters the sewer in the form of soluble and organically bound phosphates. Biological activity in the sewer releases organically bound phosphates into solution that are not removed by sedimentation. The amount of organically bound phosphates released into a soluble form varies with the sewer age, WW temperature, and biological conditions. Table 10.2 shows typical N and P forms in raw, primary, and secondary WW treatment. The total phosphorus is reduced from 7 to 6 mg/l by sedimentation. Secondary biological treatment removes phosphorus by biological uptake; however, the amount of phosphorus is surplus relative to the quantity of nitrogen and carbon necessary for synthesis. In general, the amount of phosphorus in the excess biological floc produced in activated sludge treatment of a WW is equal to about 1% of the BOD applied. For this reason, the total phosphorus is further reduced from 6 mg/l to approximately 5 mg/l.
Table 10.2 Approximate nutrient composition of average domestic wastewater and effluents.
| Determinant | Raw | Primary | Secondary |
| Organic content (mg/l) | |||
| Suspended solids | 240 | 120 | 30 |
| Biochemical oxygen demand | 200 | 130 | 30 |
| Nitrogen content (mg/l as N) | |||
| Inorganic nitrogen | 22 | 22 | 24 |
| Organic nitrogen | 13 | 8 | 2 |
| Total nitrogen | 35 | 30 | 26 |
| Phosphorus content (mg/l as P) | |||
| Inorganic phosphorus | 4 | 4 | 4 |
| Organic phosphorus | 3 | 2 | 1 |
| Total phosphorus | 7 | 6 | 5 |
10.2.2 Chemical Phosphorus Removal
Chemical precipitation using aluminum or iron coagulants is effective in phosphate removal. Aluminum ions precipitate with phosphate ions as follows:

The molar ratio of Al to P is 1 : l and the mass ratio of commercial alum to phosphorus is 9.7 to l.0. Coagulation studies have shown that greater than this alum dosage be necessary to precipitate phosphorus from WW. One of the competing reactions, which accounts in part for the excess alum requirement, is the alum reaction with natural alkalinity as follows:

As a result, 75, 85, and 95% phosphorus reductions require alum to phosphorus mass ratios of about 13 to 1, 16 to 1, and 22 to 1, respectively. For example, to achieve 85% phosphorus removal from a WW containing l0 mg/l of P, the alum dosage needed is approximately 16 × 10 = 160 mg/l, which is substantially greater than the 9.7 × 10 = 97 mg/l stoichiometric quantity of alum according to Reaction (10.1).
Iron coagulants precipitate orthophosphate by combining with the ferric ion as shown in Reaction (10.3) at a molar ratio of l to 1:
Similar to aluminum, a greater amount of iron is required in actual coagulation than this chemical reaction predicts. One of the competing reactions with natural alkalinity is

If WW has sufficient natural alkalinity, ferric salts applied without coagulant aids result in phosphorus removal at Fe to P dosages of 1.8 to l.0 ratio or greater. This is equivalent to an application of approximately 150 mg/l of commercial ferric chloride for treatment of WW containing 10 mg/l of P. Since the reaction of ferric chloride with natural alkalinity is relatively slow, lime may be applied to raise the pH and supply the hydroxide ion for coagulation as follows:

Ferrous sulfate also forms a phosphate precipitate with an Fe to P molar ratio of 1 : 1, and the dosages for coagulation are similar to ferric salts. Commercially available iron salts are ferric chloride, ferric sulfate, ferrous sulfate, and waste pickle liquor from the steel industry. For the purpose of recycle and reuse, pickle liquors with either sulfuric or hydrochloric acid are the two common waste liquors from metal finishing with iron content from a low of 0.5% to a high of 15%. Chemical–biological treatment combines chemical precipitation of phosphorus with biological removal of organic matter. Alum or iron salts are added prior to primary clarification, directly to the biological process, or prior to final clarification. For all application points, the amount of chemical added is about the same to achieve a specific phosphorus removal. Addition of coagulants to the primary clarifier enhances both suspended solids and BOD removal, resulting in 75% solids and 50% BOD removal.
The current paradigm is shifting design by taking WW as resources. For example, Anaerobic processes can be used to generate methane for energy production, nutrients can be recovered through struvite precipitation, and reclaimed water can be used for irrigation. In terms of per capita, 13 and 2.1 g N and P will be produced, which will result in 36 and 5.8 g N and P/m3/capita/day, respectively. Although more than 80 and 50% of N and P are contributed to by human urine to the WW flow, urine itself only contributes 1% of the WW flow rate of 0.35 m3. Therefore, for successful recovery of N and P, it is critical to separate urine from feces. Nutrients could be then be subsequently recovered through struvite precipitation, which is the most effective and easiest way to recover N and P from WW.
Figure 10.2 Flow diagram for nitrification by suspended growth aeration following conventional biological treatment.
10.3 Phosphorus Recovery
Phosphorus can be recovered from either sewage sludge or sludge liquor of a wastewater treatment plant (WWTP). Since cost and benefit are the major concerns in decision making, LCA and LCCBA are good methods to assess the sustainability of different technologies in terms of process design, operational conditions, and the type of phosphorus product. Up to 90% of the phosphorus entering the WWTP becomes sewage sludge (Pinnekamp et al., 2013), so the recovery of phosphorus from the sewage sludge line offers a higher potential of phosphorus recovery in comparison with a recovery process from the effluent of the WWTP. Almost all processes developed for phosphorus recovery focus on this fraction of the phosphorus originally contained in the raw WW. Elimination of dissolved phosphate from WW and the transformation to sewage sludge take place partly through bacterial growth (38–45%). The phosphorus is used by the microorganisms in the AS as nutrient and included in the biomass. Tertiary WWTPs additionally remove around 30–52% of the phosphorus from WW into the solid sludge phase. There are two main concepts for phosphorus elimination: (i) Enhanced biological phosphorus removal (EBPR) through phosphorus‐accumulating bacteria. Under specific process conditions, these bacteria are able to store large amounts of phosphorus. Under anaerobic conditions and in the presence of easily degradable organic compounds, the bacteria can use stored phosphorus as an energy source. Under aerobic conditions, the bacteria fill up the phosphorus storage again. The difference between the phosphorus uptake and the phosphorus released is referred as the net elimination in the form of polyphosphates (Seviour et al., 2003; Oehmen et al., 2007; Pinnekamp et al., 2007). (ii) Chemical phosphorus elimination applies aluminum, iron, or calcium salts. The phosphorus is removed as precipitation product of inorganic phosphates such as strengite, variscite, or apatite, respectively. As a result, larger amounts of sewage sludge are produced by the EBPR than WWTPs.
10.3.1 Enhanced Phosphorus Uptake
Some bacteria have the ability to accumulate phosphorus in the form of polyphosphates in excess of the phosphorus requirements by their growth. Conventional AS biomass typically contains 1–2% phosphorus on a dry weight basis, whereas biomass in an enhanced phosphate removal process is capable of accumulating phosphorus in excess of 3%; in some cases phosphorus contents up to 18% have been obtained with artificial, tailored substrates (Appeldoorn et al., 1992). The highest phosphorus concentration found in the biomass with domestic sewage as a substrate is about 7%. The essential features of the process are an anaerobic phase followed by an aerobic phase. Microorganisms are responsible for the phenomenon, but chemical precipitation of phosphorus may be a significant factor (Bark et al., 1992). The most commonly implicated species are from the genus Acinetobacter, but other related species may be involved. Operation of the process with anaerobic–aerobic sequencing provides favorable conditions for enrichment of the sludge with bio‐P microorganisms. In the presence of short‐chain fatty acids under aerobic conditions, the bio‐P microorganisms are able to store polyphosphates as a phosphorus source for energy generation. The initial anaerobic phase is required to produce short‐chain acids. Phosphorus is released from the sludge during the anaerobic phase, but the released phosphorus is taken up later in the process. These acids are utilized by the bio‐P microorganisms with concomitant phosphorus removal in an aerobic reactor. The phosphorus‐rich sludge formed is settled and removed from the WW. AS that has aerobically accumulated phosphorus in an enhanced phosphorus uptake system will release phosphate when an oxygen deficiency occurs (Schön et al., 1993). Rasmussen et al. (1994) found that most of the release was accomplished in the short time of 4 h under anaerobic conditions. Designing clarifiers to minimize the residence time of the sludge biomass is essential for the proper operation of an enhanced phosphorus removal process.
10.3.2 Struvite Precipitation
Struvite crystallization is an important mineral phosphorus recycling product. If P is not recovered, struvite could also spontaneously precipitate within pipes, pumps, or centrifuges, and cause severe operational problems in sludge handling and treatment. Due to the degradation of the biomass, an important part of the phosphorus is remobilized as orthophosphate and therefore dissolved in the liquid phase of the sludge water typically with concentrations in the range of 80–300 mg/l and NH4–N/L in the concentration range of 600–800 mg (Lahav et al., 2013). If magnesium is present and the pH is high enough (optimum above pH 8), struvite (MgNH4PO4∙6H2O) precipitates according to the following reversible reaction:
The chemical balance is mainly influenced by stoichiometry (concentration) and matrix conditions (pH, temperature). A concentration of ortho‐PO4 above 50 mg/l and pH around 7.8–8.5 is the optimal conditions for struvite crystallization in the presence of sufficient magnesium and ammonia. The first step in crystallization is the nucleation, which forms the initial, smallest size crystals. The second step is the crystal growth, which is the mass transport of ions from the solution to the crystal surface and the incorporation of material into the crystal lattice. To produce fertilizer products, the kinetics of nucleation and growth are mainly determined by the supersaturation of the liquid phase in struvite, the pH, and the temperature. Oversaturation of struvite is defined as a state in which the solubility product is increased, which means that the product of the activities of phosphate, ammonium, and magnesium increases a certain value depending on temperature and ion strength. The pH influences the oversaturation indirectly by the concentrations of NH4+ and PO43− with an optimal pH leading to the highest oversaturation. The optimal pH lies in the range of pH 8–10.7. Britton et al. (2005) determined the conditional solubility pPS (product of magnesium, ammonium, and phosphate concentration) as a function of the pH: pPS = −0.203 pH2 + 4.09pH – 11.76. As a consequence of struvite crystallization, proton is released and the pH is required to be kept stable during the crystallization process. Crossing the limit of the metastable region will result in a sudden increase of crystallization rate. Furthermore, the degree of oversaturation influences the growth rate of different crystal sizes. For higher supersaturation, smaller crystals grow faster than large ones because of diffusion mechanisms.
Solubility product of struvite, Ks, is defined as follows:
Struvite would precipitate according to following reaction:

pH determines the species of ammonia between NH4+ and NH3 according to the following equilibrium reaction:
The equilibrium constant, Ka, is as follows:

Table 10.3 Composition of wastewater. Figure 10.3 Purification and mass balances of struvite recovery in two‐step process. Table 10.4
pH and ammonia lost to air. Table 10.5 The market prices of the chemicals in struvite precipitation. Table 10.6 Cost of NH4+–N.
Parameter
Concentration in water (mg/l)
NH4+
1400
Mg2+
21.4
PO43−
24
Ca2+
21.2
K+
2150
COD
3240
pH
7.9

pH
NH4+ (mg/l)
Ammonia lost to air (%)
7.9
1354
—
8.5
1205
11
9.0
1112
17.9
Chemical
Price ($/kg)
H3PO4 (75%)
0.40
MgCl2∙6H2O
0.31
MgO (85%)
0.44
NaOH (100%)
0.12
NH4+
0.23
Unit cost ($/kg NH4+–N)
Authors
7.5–8.0
Çelen and Türker (2001)
9.1–11.38
Siegrist (1996)
4.55–9.92
Andrade and Schuiling (1999)
14.9
Webb et al. (1995)
10.4 Capital and Operation Cost of Reclaiming Water for Reuse
The most valuable product to be recovered is the treated water due to huge volume of treated WW effluent. However, distribution infrastructure is required for irrigation or recharge of groundwater aquifer. To reduce pipeline for distribution of water reuse, clusters of WRRFs close to decentralized WWTPs are ideal to proximate reused water to its intended customers. In Miami‐Dade County, for example, 300 MGD of treated WW could be reclaimed for irrigation, cooling, and agricultural irrigation. If the reclamation rates are 20, 40, and 60%, the Miami‐Dade Water and Sewer Department (WASD) could increase its annual revenue to $65.7, 131, and 197 million/year, respectively, at a water price of $3/1000 gal. In reality, the actual charge for water is about $10/1000 gal due to the WW fee associated with water consumption. Miami‐Dade WASD reclaims less than 7%. Therefore, there is great potential for Miami‐Dade WASD to enhance its financial balance sheet through water reuse. The major barrier for Miami‐Dade WASD is the capital investment for reclaiming the treated WW and building the infrastructure to reuse the water. Not far from Miami, Tampa sets up an exemplary model for cities over the world to follow. In 1995, the US EPA awarded Tampa–St. Petersburg $29.9 million for water reuse. Tampa has 2.5 million people, consumes 60 MGD, and had its share of $19.2 million dollars to build its water reclaim plant. Now, Tampa is able to provide an estimated 16 MGD of drinking water supply to the region through exchange of reclaimed water downstream for upstream surface water. It offsets potable water demands with reclaimed water usage for irrigation and other purposes. The water reclaim plant also benefits greatly from minimum environmental flows and the natural ecosystem in the Tampa Bay area. With additional financial support from the South Florida Water Management District (SWFWMD), Tampa is developing the South Tampa Area Reuse (STAR) project to provide reclaimed water for residents in the South Tampa area. In about 10 years, maximum STAR demand will be about 9 MGD in the dry season. The STAR project will recover about 10 MGD.
Due to economy of scale, unit capital and O&M costs of reclaiming water facility decreases with flow. To facilitate SEE design of water reclaiming plants, regression equations were developed using MatLab. These correlation equations can be used to estimate treatment project capital and O&M costs that can be estimated at different flow rates according to a California study (WateReuse Foundation, 2009). The regression equations use capital or O&M costs at 0.5 MGD as the reference cost. Dimensionless cost ratios between the cost at a specific flow rate and the corresponding cost at 0.5 MGD are plotted against the flow rate ratios. Most equations show that the unit capital and O&M cost decrease with flow rate exponentially before 10 MGD. When flow rate is greater than 10 MGD, the economy‐of‐scale effect decreases to a linear relationship.
10.4.1 Building
Table 10.7 Admin/lab/shop building. a Based on an assumed $300/ft2 used for planning‐level estimates: Table 10.8 Unit capital cost and unit operation and maintenance cost of admin/lab/shop building at different flow rates. Table 10.9 Unit cost ratio of admin/lab/shop building at different flow ratios. Figure 10.4 Unit capital cost/unit capital cost0 versus Q/Q0 for admin/lab/shop building, unit capital cost0 = 1914.00$/kgal, Q0 = 0.5 MGD. Figure 10.5 Unit O&M cost/unit O&M cost0 versus Q/Q0 for admin/lab/shop building, unit O&M cost0 = 0.2384$/kgal, Q0 = 0.5 MGD.
Expense ($)
Cost per amount of flow (MGD)
0.5
1.0
2.0
5.0
10
15
20
Concrete
0
0
0
0
0
0
0
Excavation and backfill (10%)
0
0
0
0
0
0
0
Miscellaneous metals (4%)
0
0
0
0
0
0
0
Yard piping (7%)
0
0
0
0
0
0
0
Total concrete
0
0
0
0
0
0
0
Equipment
0
0
0
0
0
0
0
Tax and delivery (11%)
0
0
0
0
0
0
0
Installation (20%)
0
0
0
0
0
0
0
Manufacturer services (4%)
0
0
0
0
0
0
0
Total mechanical
0
0
0
0
0
0
0
Protective coating (7%)
0
0
0
0
0
0
0
Electricity (10%)
0
0
0
0
0
0
0
Instrumentation (10%)
0
0
0
0
0
0
0
Housinga
600 000
600 000
750 000
1 800 000
3 000 000
3 600 000
4 200 000
Subtotal
600 000
600 000
750 000
1 800 000
3 000 000
3 600 000
4 200 000
Contractor overhead and profit (15%)
90 000
90 000
112 500
270 000
450 000
540 000
630 000
Scope‐of‐project contingency (30%)
180 000
180 000
225 000
540 000
900 000
1 080 000
1 260 000
Total construction cost
870 000
870 000
1 087 500
2 610 000
4 350 000
5 220 000
6 090 000
Engineering design (10%)
87 000
87 000
108 750
261 000
435 000
522 000
609 000
Total capital cost
957 000
957 000
1 196 250
2 871 000
4 785 000
5 742 000
6 699 000
Cost per gal ($)
1.91
0.96
0.60
0.57
0.48
0.38
0.33
O&M (5% construction cost)
43 500
43 500
54 375
130 500
217 500
261 000
304 500
Q (MGD)
Unit capital cost ($/kgal)
Unit O&M costs ($/kgal)
0.5
1914.00
0.2384
1
957.00
0.1192
2
598.13
0.0745
5
574.20
0.0715
10
478.50
0.0596
15
382.80
0.0477
20
334.95
0.0417
Q/Q0
Unit capital cost/unit capital cost0
Unit O&M costs/unit O&M costs0
1
1.0000
1.0000
2
0.5000
0.5000
4
0.3125
0.3125
10
0.3000
0.3000
20
0.2500
0.2500
30
0.2000
0.2000
40
0.1750
0.1750


10.4.2 Headwork
Table 10.10 Headworks. a Concrete was sized for grit chambers only. b Equipment costs include both screens and Pista Grit. c For screens, the average cost of 6‐mm and 2‐mm screens is used. Table 10.11 Unit capital cost and unit operation and maintenance cost of headworks at different flow rates. Table 10.12 Unit cost ratio of headworks at different flow ratios. Figure 10.6 Unit capital cost/unit capital cost0 versus Q/Q0 for headworks, unit capital cost0 = 947.47$/kgal, Q0 = 0.5 MGD. Figure 10.7 Unit O&M cost/unit O&M cost0 versus Q/Q0 for headworks, unit O&M cost0 = 0.1180$/kgal, Q0 = 0.5 MGD.
Expense ($)
Cost per amount of flow (MGD)
0.5
1.0
2.0
5.0
10
15
20
Concretea
6 400
7 200
11 200
20 000
24 800
29 600
29 600
Excavation and backfill (10%)
640
720
1 120
2 000
2 480
2 960
2 960
Miscellaneous metals (4%)
256
288
448
800
992
1 184
1 184
Yard piping (7%)
448
504
784
1 400
1 736
2 072
2 072
Total concrete
7 744
8 712
13 552
24 200
30 008
35 816
35 816
Equipmentb,c
167 500
197 000
206 500
349 000
545 000
695 000
835 000
Tax and delivery (11%)
18 425
21 670
22 715
38 390
59 950
76 450
91 850
Installation (20%)
33 500
39 400
41 300
69 800
109 000
139 000
167 000
Manufacturer services (4%)
6 700
7 880
8 260
13 960
21 800
27 800
33 400
Total mechanical
226 125
265 950
278 775
471 150
735 750
938 250
1 127 250
Protective coating (7%)
16 371
19 226
20 463
34 675
53 603
68 185
81 415
Electricity (10%)
23 387
27 466
29 233
49 535
76 576
97 407
116 307
Instrumentation (10%)
23 387
27 466
29 233
49 535
76 576
97 407
116 307
Housing
0
0
0
0
0
0
0
Subtotal
297 014
348 821
371 255
629 095
972 513
1 237 064
1 477 094
Contractor overhead and profit (15%)
44 552
52 323
55 688
94 364
145 877
185 560
221 564
Scope‐of‐project contingency (30%)
89 104
104 646
111 377
188 728
291 754
371 119
443 128
Total construction cost
430 670
505 790
538 320
912 187
1 410 143
1 793 743
2 141 786
Engineering design (10%)
43 067
50 579
53 832
91 219
141 014
179 374
214 179
Total capital cost
473 737
556 369
592 152
1 003 406
1 551 158
1 973 117
2 355 965
Cost per gal ($)
0.95
0.56
0.30
0.20
0.16
0.13
0.12
O&M (5% construction cost)
21 533
25 290
26 916
45 609
70 507
89 687
107 089
Q (MGD)
Unit capital cost ($/kgal)
Unit O&M costs ($/kgal)
0.5
947.47
0.1180
1
556.37
0.0693
2
296.08
0.0369
5
200.68
0.0250
10
155.12
0.0193
15
131.54
0.0164
20
117.80
0.0147
Q/Q0
Unit capital cost/unit capital cost0
Unit O&M costs/unit O&M costs0
1
1.0000
1.0000
2
0.5872
0.5872
4
0.3125
0.3125
10
0.2118
0.2118
20
0.1637
0.1637
30
0.1388
0.1388
40
0.1243
0.1243


10.4.3 Oxidation
Table 10.13 Ox (CA Title 22). a Concrete cost is only for grit chambers. b Equipment costs include both screens and Pista Grit (Western Environmental Equipment Co. and Siemens Technologies). c For screens, the average cost of 6‐mm and 2‐mm screens was used. Table 10.14 Unit capital cost and unit operation and maintenance cost of Ox (CA Title 22) at different flow rates. Table 10.15 Unit cost ratio of Ox (CA Title 22) at different flow ratios. Figure 10.8 Unit capital cost/unit capital cost0 versus Q/Q0 for Ox (CA Title 22), unit capital cost0 = 6793.32$/kgal, Q0 = 0.5 MGD. Figure 10.9 Unit O&M cost/unit O&M cost0 versus Q/Q0 for Ox (CA Title 22), unit O&M cost0 = 0.8460$/kgal, Q0 = 0.5 MGD.
Expense ($)
Cost per amount of flow (MGD)
0.5
1.0
2.0
5.0
10
15
20
Concretea
774 400
1 024 000
1 861 600
3 640 000
7 156 000
11 017 600
16 400 800
Excavation and backfill (10%)
77 440
102 400
186 160
364 000
715 600
1 101 760
1 640 080
Miscellaneous metals (4%)
30 976
40 960
74 464
145 600
286 240
440 704
656 032
Yard piping (7%)
54 208
71 680
130 312
254 800
500 920
771 232
1 148 056
Total concrete
937 024
1 239 040
2 252 536
4 404 400
8 658 760
13 331 296
19 844 968
Equipmentb,c
548 000
598 000
676 000
900 000
1 800 000
2 580 000
3 360 000
Tax and delivery (11%)
60 280
65 780
74 360
99 000
198 000
283 800
369 600
Installation (20%)
109 600
119 600
135 200
180 000
360 000
516 000
672 000
Manufacturer services (4%)
21 920
23 920
27 040
36 000
72 000
103 200
134 400
Total mechanical
739 800
807 300
912 600
1 215 000
2 430 000
3 483 000
4 536 000
Protective coating (7%)
117 378
143 244
221 560
393 358
776 213
1 177 001
1 706 668
Electricity (10%)
167 682
204 634
316 514
561 940
1 108 876
1 681 430
2 438 097
Instrumentation (10%)
167 682
204 634
316 514
561 940
1 108 876
1 681 430
2 438 097
Housing
0
0
0
0
0
0
0
Subtotal
2 129 566
2 598 852
4 019 723
7 136 638
14 082 725
21 354 156
30 963 829
Contractor overhead and profit (15%)
319 435
389 828
602 958
1 070 496
2 112 409
3 203 123
4 644 574
Scope‐of‐project contingency (30%)
638 870
779 656
1 205 917
2 140 991
4 224 818
6 406 247
9 289 149
Total construction cost
3 087 871
3 768 335
5 828 598
10 348 125
20 419 952
30 963 526
44 897 553
Engineering design (10%)
308 787
376 834
582 860
1 034 813
2 041 995
3 096 353
4 489 755
Total capital cost
3 396 659
4 145 169
6 411 458
11 382 938
22 461 947
34 059 879
49 387 308
Cost per gal ($)
6.79
4.15
3.21
2.28
2.25
2.27
2.47
O&M (5% construction cost)
154 394
188 417
291 430
517 406
1 020 998
1 548 176
2 244 878
Q (MGD)
Unit capital cost ($/kgal)
Unit O&M costs ($/kgal)
0.5
6793.32
0.8460
1
4145.17
0.5162
2
3205.73
0.3992
5
2276.59
0.2835
10
2246.19
0.2797
15
2270.66
0.2828
20
2469.37
0.3075
Q/Q0
Unit capital cost/unit capital cost0
Unit O&M costs/unit O&M costs0
1
1.0000
1.0000
2
0.6102
0.6102
4
0.4719
0.4719
10
0.3351
0.3351
20
0.3306
0.3306
30
0.3342
0.3342
40
0.3635
0.3635


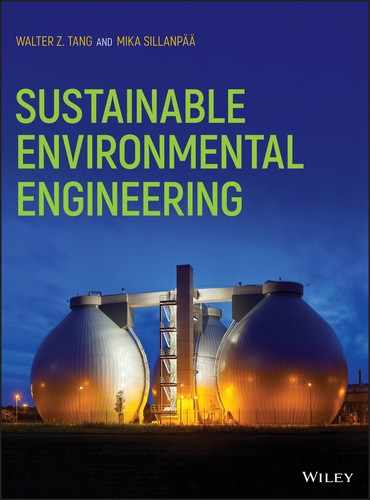
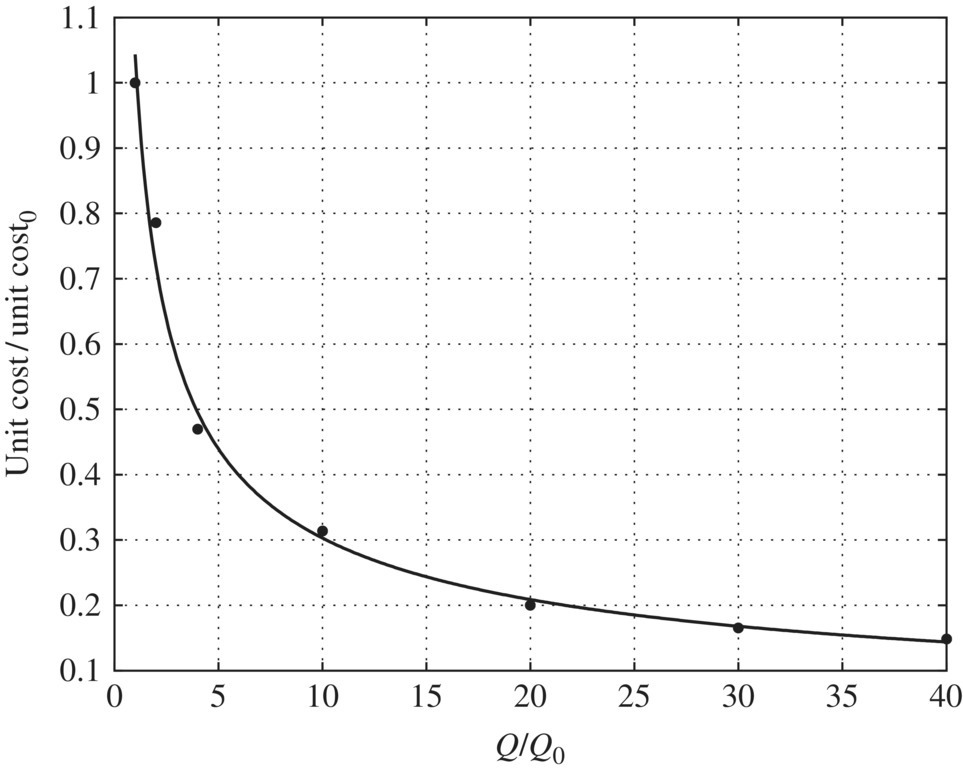
10.4.4 Aerobic SBR
Table 10.16 Aqua Aerobics SBR (CA Title 22). a Equipment costs provided by Aqua Aerobics. Table 10.17 Unit capital cost and unit operation and maintenance cost of Aqua Aerobics SBR (CA Title 22) at different flow rates. Table 10.18 Unit cost ratio of Aqua Aerobics SBR (CA Title 22) at different flow ratios. Figure 10.10 Unit capital cost/unit capital cost0 versus Q/Q0 for Aqua Aerobics SBR (CA Title 22), unit capital cost0 = 6930.80$/kgal, Q0 = 0.5 MGD. Figure 10.11 Unit O&M cost/unit O&M cost0 versus Q/Q0 for Aqua Aerobics SBR (CA Title 22), unit O&M cost0 = 0.8631$/kgal, Q0 = 0.5 MGD.
Expense ($)
Cost per amount of flow (MGD)
0.5
1.0
2.0
5.0
10
15
20
Concrete
856 000
1 524 800
1 680 000
2 872 800
3 537 600
4 330 400
5 434 400
Excavation and backfill (10%)
85 600
152 480
168 000
287 280
353 760
433 040
543 440
Miscellaneous metals (4%)
34 240
60 992
67 200
114 912
141 504
173 216
217 376
Yard piping (7%)
59 920
106 736
117 600
201 096
247 632
303 128
380 408
Total concrete
1 035 760
1 845 008
2 032 800
3 476 088
4 280 496
5 239 784
6 575 624
Equipmenta
500 000
625 000
875 000
1 400 000
1 900 000
2 400 000
2 650 000
Tax and delivery (11%)
55 000
68 750
96 250
154 000
209 000
264 000
291 500
Installation (20%)
100 000
125 000
175 000
280 000
380 000
480 000
530 000
Manufacturer services (4%)
20 000
25 000
35 000
56 000
76 000
96 000
106 000
Total mechanical
675 000
843 750
1 181 250
1 890 000
2 565 000
3 240 000
3 577 500
Protective coating (7%)
119 753
188 213
224 984
375 626
479 185
593 585
710 719
Electricity (10%)
171 076
268 876
321 405
536 609
684 550
847 978
1 015 312
Instrumentation (10%)
171 076
268 876
321 405
536 609
684 550
847 978
1 015 312
Housing
0
0
0
0
0
0
0
Subtotal
2 172 665
3 414 723
4 081 844
6 814 932
8 693 780
10 769 326
12 894 467
Contractor overhead and profit (15%)
325 900
512 208
612 277
1 022 240
1 304 067
1 615 399
1 934 170
Scope‐of‐project contingency (30%)
651 800
1 024 417
1 224 553
2 044 480
2 608 134
3 230 798
3 868 340
Total construction cost
3 150 365
4 951 348
5 918 673
9 881 651
12 605 981
15 615 522
18 696 978
Engineering design (10%)
315 036
495 135
591 867
988 165
1 260 598
1 561 552
1 869 698
Total capital cost
3 465 401
5 446 483
6 510 540
10 869 816
13 866 579
17 177 074
20 566 676
Cost per gal ($)
6.93
5.45
3.26
2.17
1.39
1.15
1.03
O&M (5% construction cost)
157 518
247 567
295 934
494 083
630 299
780 776
934 849
Q (MGD)
Unit capital cost ($/kgal)
Unit O&M costs ($/kgal)
0.5
6930.80
0.8631
1
5446.48
0.6783
2
3255.27
0.4054
5
2173.96
0.2707
10
1386.66
0.1727
15
1145.14
0.1426
20
1028.33
0.1281
Q/Q0
Unit capital cost/unit capital cost0
Unit O&M costs/unit O&M costs0
1
1.0000
1.0000
2
0.7858
0.7858
4
0.4697
0.4697
10
0.3137
0.3137
20
0.2001
0.2001
30
0.1652
0.1652
40
0.1484
0.1484

10.4.5 MBR
Table 10.19 Aqua Aerobics MBR (CA Title 22). a Equipment costs provided by Aqua Aerobics. Table 10.20 Unit capital cost and unit operation and maintenance cost of Aqua Aerobics MBR (CA Title 22) at different flow rates. Table 10.21 Unit cost ratio of Aqua Aerobics MBR (CA Title 22) at different flow ratios. Figure 10.12 Unit capital cost/unit capital cost0 versus Q/Q0 for Aqua Aerobics MBR (CA Title 22), unit capital cost0 = 8461.48 $/kgal, Q0 = 0.5 MGD. Figure 10.13 Unit O&M cost/unit O&M cost0 versus Q/Q0 for Aqua Aerobics MBR (CA Title 22), unit O&M cost0 = 1.0537$/kgal, Q0 = 0.5 MGD.
Expense ($)
Cost per amount of flow (MGD)
0.5
1.0
2.0
5.0
10
15
20
Concrete
610 400
1 062 400
2 012 000
4 722 400
9 684 800
13 448 800
19 054 400
Excavation and backfill (10%)
61 040
106 240
201 200
472 240
968 480
1 344 880
1 905 440
Miscellaneous metals (4%)
24 416
42 496
80 480
188 896
387 392
537 952
762 176
Yard piping (7%)
42 728
74 368
140 840
330 568
677 936
941 416
1 333 808
Total concrete
738 584
1 285 504
2 434 520
5 714 104
11 718 608
16 273 048
23 055 824
Equipmenta
1 000 000
2 000 000
2 900 000
8 000 000
14 500 000
20 500 000
26 000 000
Tax and delivery (11%)
110 000
220 000
319 000
880 000
1 595 000
2 255 000
2 860 000
Installation (20%)
200 000
400 000
580 000
1 600 000
2 900 000
4 100 000
5 200 000
Manufacturer services (4%)
40 000
80 000
116 000
320 000
580 000
820 000
1 040 000
Total mechanical
1 350 000
2 700 000
3 915 000
10 800 000
19 575 000
27 675 000
35 100 000
Protective coating (7%)
146 201
278 985
444 466
1 155 987
2 190 553
3 076 363
4 070 908
Electricity (10%)
208 858
398 550
634 952
1 651 410
3 129 361
4 394 805
5 815 582
Instrumentation (10%)
208 858
398 550
634 952
1 651 410
3 129 361
4 394 805
5 815 582
Housing
0
0
0
0
0
0
0
Subtotal
2 652 502
5 061 590
8 063 890
20 972 912
39 742 882
55 814 021
73 857 896
Contractor overhead and profit (15%)
397 875
759 239
1 209 584
3 145 937
5 961 432
8 372 103
11 078 684
Scope‐of‐project contingency (30%)
795 751
1 518 477
2 419 167
6 291 874
11 922 865
16 744 206
22 157 369
Total construction cost
3 846 127
7 339 306
11 692 641
30 410 723
57 627 179
80 930 330
107 093 950
Engineering design (10%)
384 613
733 931
1 169 264
3 041 072
5 762 718
8 093 033
10 709 395
Total capital cost
4 230 740
8 073 236
12 861 905
33 451 795
63 389 897
89 023 363
117 803 345
Cost per gal ($)
8.46
8.07
6.43
6.69
6.34
5.93
5.89
O&M (5% construction cost)
192 306
366 965
584 632
1 520 536
2 881 359
4 046 517
5 354 697
Q (MGD)
Unit capital cost ($/kgal)
Unit O&M costs ($/kgal)
0.5
8461.48
1.0537
1
8073.24
1.0054
2
6430.95
0.8009
5
6690.36
0.8332
10
6338.99
0.7894
15
5934.89
0.7391
20
5890.17
0.7335
Q/Q0
Unit capital cost/unit capital cost0
Unit O&M costs/unit O&M costs0
1
1.0000
1.0000
2
0.9541
0.9541
4
0.7600
0.7600
10
0.7907
0.7907
20
0.7492
0.7492
30
0.7014
0.7014
40
0.6961
0.6961


10.4.6 Microfiltration
Table 10.22 Annual cost of microfiltration. a Housing footprint based on general, unpublished rules of thumb. Assumed $250/ft2. Table 10.23 Unit capital cost and unit operation and maintenance cost of MF at different flow rates. Table 10.24 Unit cost ratio of MF at different flow ratios. Figure 10.14 Unit capital cost/unit capital cost0 versus Q/Q0 for MF, unit capital cost0 = 6461.59$/kgal, Q0 = 0.5 MGD. Figure 10.15 Unit O&M cost/unit O&M cost0 versus Q/Q0 for MF, unit O&M cost0 = 0.8047$/kgal, Q0 = 0.5 MGD.
Expense ($)
Cost per amount of flow (MGD)
0.5
1.0
2.0
5.0
10
15
20
Concrete
0
0
0
0
0
0
0
Excavation and backfill (10%)
0
0
0
0
0
0
0
Miscellaneous metals (4%)
0
0
0
0
0
0
0
Yard piping (7%)
0
0
0
0
0
0
0
Total concrete
0
0
0
0
0
0
0
Equipment
1 079 369
1 641 697
2 496 986
4 346 802
6 611 393
8 449 445
10 055 789
Tax and delivery (11%)
118 731
180 587
274 668
478 148
727 253
929 439
1 106 137
Installation (20%)
215 874
328 339
499 397
869 360
1 322 279
1 689 889
2 011 158
Manufacturer services (4%)
43 175
65 668
99 879
173 872
264 456
337 978
402 232
Total mechanical
1 457 148
2 216 291
3 370 931
5 868 183
8 925 381
11 406 751
13 575 315
Protective coating (7%)
102 000
155 140
235 965
410 773
624 777
798 473
950 272
Electricity (10%)
145 715
221 629
337 093
586 818
892 538
1 140 675
1 357 532
Instrumentation (10%)
145 715
221 629
337 093
586 818
892 538
1 140 675
1 357 532
Housinga
175 000
350 000
700 000
1 750 000
3 500 000
5 250 000
7 000 000
Subtotal
2 025 578
3 164 690
4 981 082
9 202 592
14 835 233
19 736 573
24 240 650
Contractor overhead and profit (15%)
303 837
474 703
747 162
1 380 389
2 225 285
2 960 486
3 636 098
Scope‐of‐project contingency (30%)
607 673
949 407
1 494 325
2 760 778
4 450 570
5 920 972
7 272 195
Total construction cost
2 937 088
4 588 800
7 222 570
13 343 758
21 511 088
28 618 032
35 148 943
Engineering design (10%)
293 709
458 880
722 257
1 334 376
2 151 109
2 861 803
3 514 894
Total capital cost
3 230 797
5 047 680
7 944 827
14 678 134
23 662 197
31 479 835
38 663 837
Cost per gal ($)
6.46
5.05
3.97
2.94
2.37
2.10
1.93
O&M (5% construction cost)
146 854
229 440
361 128
667 188
1 075 554
1 430 902
1 757 447
Q (MGD)
Unit capital cost ($/kgal)
Unit O&M costs ($/kgal)
0.5
6461.59
0.8047
1
5047.68
0.6286
2
3972.41
0.4947
5
2935.63
0.3656
10
2366.22
0.2947
15
2098.66
0.2614
20
1933.19
0.2407
Q/Q0
Unit capital cost/unit capital cost0
Unit O&M costs/unit O&M costs0
1
1.0000
1.0000
2
0.7812
0.7812
4
0.6148
0.6148
10
0.4543
0.4543
20
0.3662
0.3662
30
0.3248
0.3248
40
0.2992
0.2992


10.4.7 Reverse Osmosis
Table 10.25 Annual cost of reverse osmosis. a Housing footprint based on general, unpublished rules of thumb. Assumed $250/ft2. Table 10.26 Unit capital cost and unit operation and maintenance cost of RO at different flow rates. Table 10.27 Unit cost ratio of RO at different flow ratios. Figure 10.16 Unit capital cost/unit capital cost0 versus Q/Q0 for RO, unit capital cost0 = 4881.23$/kgal, Q0 = 0.5 MGD. Figure 10.17 Unit O&M cost/unit O&M cost0 versus Q/Q0 for RO, unit O&M cost0 = 0.6079$/kgal, Q0 = 0.5 MGD.
Expense ($)
Cost per amount of flow (MGD)
0.5
1.0
2.0
5.0
10
15
20
Concrete
0
0
0
0
0
0
0
Excavation and backfill (10%)
0
0
0
0
0
0
0
Miscellaneous metals (4%)
0
0
0
0
0
0
0
Yard piping (7%)
0
0
0
0
0
0
0
Total concrete
0
0
0
0
0
0
0
Equipment
770 000
1 110 000
1 610 000
2 610 000
3 780 000
4 680 000
5 450 000
Tax and delivery (11%)
84 700
122 100
177 100
287 100
415 800
514 800
599 500
Installation (20%)
154 000
222 000
322 000
522 000
756 000
936 000
1 090 000
Manufacturer services (4%)
30 800
44 400
64 400
104 400
151 200
187 200
218 000
Total mechanical
1 039 500
1 498 500
2 173 500
3 523 500
5 103 000
6 318 000
7 357 500
Protective coating (7%)
72 765
104 895
152 145
246 645
357 210
442 260
515 025
Electricity (10%)
103 950
149 850
217 350
352 350
510 300
631 800
735 750
Instrumentation (10%)
103 950
149 850
217 350
352 350
510 300
631 800
735 750
Housinga
210 000
420 000
840 000
2 100 000
4 200 000
6 300 000
8 400 000
Subtotal
1 530 165
2 323 095
3 600 345
6 574 845
10 680 810
14 323 860
17 744 025
Contractor overhead and profit (15%)
229 525
348 464
540 052
986 227
1 602 122
2 148 579
2 661 604
Scope‐of‐project contingency (30%)
459 050
696 929
1 080 104
1 972 454
3 204 243
4 297 158
5 323 208
Total construction cost
2 218 739
3 368 488
5 220 500
9 533 525
15 487 175
20 769 597
25 728 836
Engineering design (10%)
221 874
336 849
522 050
953 353
1 548 717
2 076 960
2 572 884
Total capital cost
2 440 613
3 705 337
5 742 550
10 486 878
17 035 892
22 846 557
28 301 720
Cost per gal ($)
4.88
3.71
2.87
2.10
1.70
1.52
1.42
O&M (5% construction cost)
110 937
168 424
261 025
476 676
774 359
1 038 480
1 286 442
Q (MGD)
Unit capital cost ($/kgal)
Unit O&M costs ($/kgal)
0.5
4881.23
0.6079
1
3705.34
0.4614
2
2871.28
0.3576
5
2097.38
0.2612
10
1703.59
0.2122
15
1523.10
0.1897
20
1415.09
0.1762
Q/Q0
Unit capital cost/unit capital cost0
Unit O&M costs/unit O&M costs0
1
1.0000
1.0000
2
0.7591
0.7591
4
0.5882
0.5882
10
0.4297
0.4297
20
0.3490
0.3490
30
0.3120
0.3120
40
0.2899
0.2899


10.4.8 Filtration
Table 10.28 Filtration. a Average cost used for filtration equipment [Ox and SBR for Title 22 (California) and Class A+ (Arizona) requirements]. b Cost of equipment includes the cost of fiberglass reinforced plastic (FRP) tanks and metering pump skid for alum and cationic polymer (Augusta Fiberglass budget). Table 10.29 Unit capital cost and unit operation and maintenance cost of filtration at different flow rates. Table 10.30 Unit cost ratio of filtration at different flow ratios. Figure 10.18 Unit capital cost/unit capital cost0 versus Q/Q0 for filtration, unit capital cost0 = 1426.90$/kgal, Q0 = 0.5 MGD. Figure 10.19 Unit O&M cost/unit O&M cost0 versus Q/Q0 for filtration, unit O&M cost0 = 0.1777$/kgal, Q0 = 0.5 MGD.
Expense ($)
Cost per amount of flow (MGD)
0.5
1.0
2.0
5.0
10
15
20
Concrete
88 800
120 376
171 406
282 643
466 206
558 743
743 428
Excavation and backfill (10%)
8 880
12 038
17 141
28 264
46 621
55 874
74 343
Miscellaneous metals (4%)
3 552
4 815
6 856
11 306
18 648
22 350
29 737
Yard piping (7%)
6 216
8 426
11 998
19 785
32 634
39 112
52 040
Total concrete
107 448
145 655
207 401
341 998
564 109
676 079
899 548
Equipmenta,b
181 303
193 498
214 085
263 876
394 212
431 061
565 437
Tax and delivery (11%)
19 943
21 285
23 549
29 026
43 363
47 417
62 198
Installation (20%)
36 261
38 700
42 817
52 775
78 842
86 212
113 087
Manufacturer services (4%)
7 252
7 740
8 563
10 555
15 768
17 242
22 617
Total mechanical
244 759
261 222
289 015
356 233
532 186
581 932
763 340
Protective coating (7%)
24 654
28 481
34 749
48 876
76 741
88 061
116 402
Electricity (10%)
35 221
40 688
49 642
69 823
109 630
125 801
166 289
Instrumentation (10%)
35 221
40 688
49 642
69 823
109 630
125 801
166 289
Housing
0
0
0
0
0
0
0
Subtotal
447 303
516 734
630 448
886 753
1 392 295
1 597 674
2 111 868
Contractor overhead and profit (15%)
67 095
77 510
94 567
133 013
208 844
239 651
316 780
Scope‐of‐project contingency (30%)
134 191
155 020
189 134
266 026
417 689
479 302
633 560
Total construction cost
648 589
749 264
914 150
1 285 792
2 018 828
2 316 628
3 062 208
Engineering design (10%)
64 859
74 926
91 415
128 579
201 883
231 663
306 221
Total capital cost
713 448
824 191
1 005 565
1 414 371
2 220 711
2 548 291
3 368 429
Cost per gal ($)
1.43
0.82
0.50
0.28
0.22
0.17
0.17
O&M (5% construction cost)
32 429
37 463
45 708
64 290
100 941
115 831
153 110
Q (MGD)
Unit capital cost ($/kgal)
Unit O&M costs ($/kgal)
0.5
1426.90
0.1777
1
824.19
0.1026
2
502.78
0.0626
5
282.87
0.0352
10
222.07
0.0277
15
169.89
0.0212
20
168.42
0.0210
Q/Q0
Unit capital cost/unit capital cost0
Unit O&M costs/unit O&M costs0
1
1.0000
1.0000
2
0.5776
0.5776
4
0.3524
0.3524
10
0.1982
0.1982
20
0.1556
0.1556
30
0.1191
0.1191
40
0.1180
0.1180

10.4.9 Disinfection
Table 10.31 Disinfection (CA). a Concrete cost is based on average contact time for Arizona and California SBR, Ox, and MBR. b Equipment cost includes the cost of the chemical system in which only FRP tanks and metering pump skid system are estimated for (Augusta Fiberglass). Table 10.32 Unit capital cost and unit operation and maintenance cost of disinfection at different flow rates. Table 10.33 Unit cost ratio of disinfection at different flow ratios. Figure 10.20 Unit capital cost/unit capital cost0 versus Q/Q0 for disinfection, unit capital cost0 = 669.54$/kgal, Q0 = 0.5 MGD. Figure 10.21 Unit O&M cost/unit O&M cost0 versus Q/Q0 for disinfection, unit O&M cost0 = 0.0834$/kgal, Q0 = 0.5 MGD.
Expense ($)
Cost per amount of flow (MGD)
0.5
1.0
2.0
5.0
10
15
20
Concretea
119 872
227 916
295 200
491 674
772 030
856 583
955 531
Excavation and backfill (10%)
11 987
22 792
29 520
49 167
77 203
85 658
95 553
Miscellaneous metals (4%)
4 795
9 117
11 808
19 667
30 881
34 263
38 221
Yard piping (7%)
8 391
15 954
20 664
34 417
54 042
59 961
66 887
Total concrete
145 045
275 778
357 192
594 926
934 156
1 036 465
1 156 192
Equipmentb
14 979
15 682
17 034
19 887
23 126
28 347
44 118
Tax and delivery (11%)
1 648
1 725
1 874
2 188
2 544
3 118
4 853
Installation (20%)
2 996
3 136
3 407
3 977
4 625
5 669
8 824
Manufacturer services (4%)
599
627
681
795
925
1 134
1 765
Total mechanical
20 222
21 171
22 996
26 847
31 220
38 268
59 559
Protective coating (7%)
11 569
20 786
26 613
43 524
67 576
75 231
85 103
Electricity (10%)
16 527
29 695
38 019
62 177
96 538
107 473
121 575
Instrumentation (10%)
16 527
29 695
38 019
62 177
96 538
107 473
121 575
Housing
0
0
0
0
0
0
0
Subtotal
209 888
377 125
482 839
789 652
1 226 027
1 364 912
1 544 005
Contractor overhead and profit (15%)
31 483
56 569
72 426
118 448
183 904
204 737
231 601
Scope‐of‐project contingency (30%)
62 966
113 138
144 852
236 896
367 808
409 473
463 201
Total construction cost
304 338
546 832
700 116
1 144 995
1 777 740
1 979 122
2 238 807
Engineering design (10%)
30 434
54 683
70 012
114 500
177 774
197 912
223 881
Total capital cost
334 772
601 515
770 128
1 259 495
1 955 514
2 177 034
2 462 687
Cost per gal ($)
0.67
0.60
0.39
0.25
0.20
0.15
0.12
O&M (5% construction cost)
15 217
27 342
35 006
57 250
88 887
98 956
111 940
Q (MGD)
Unit capital cost ($/kgal)
Unit O&M costs ($/kgal)
0.5
669.54
0.0834
1
601.52
0.0749
2
385.06
0.0480
5
251.90
0.0314
10
195.55
0.0244
15
145.14
0.0181
20
123.13
0.0153
Q/Q0
Unit capital cost/unit capital cost0
Unit O&M costs/unit O&M costs0
1
1.0000
1.0000
2
0.8984
0.8984
4
0.5751
0.5751
10
0.3762
0.3762
20
0.2921
0.2921
30
0.2168
0.2168
40
0.1839
0.1839


10.5 Exercise
10.5.1 Questions
- What is the most valuable material in WWTP to be recovered?
- Please rank economic values of nutrient, energy, and water recovery.
- Water could be recovered in a large quantity, what prevents the reuse of the treated effluent from WWTPs?
- If nutrients such as N and P in the form of struvite are so valuable, why is nutrient recovery not commonly practiced in WWTPs?
- What are the common treatment processes for organic, toxic metals, and virus or bacteria to achieve wastewater quality standards?
- Which unit process is the most expensive in reclaiming treated wastewater?
10.5.2 Calculations
- Table 10.34 shows the capital cost and operation and maintenance (O&M) cost of Zenon MBR (CA Title 22) at different flow rates:
- Calculate unit capital and O&M costs.
- Plot unit cost/unit cost0 versus Q/Q0.
- Determine correlation equations between unit cost/unit cost0 for capital and O&M versus Q/Q0, respectively.
- A water utility in Southern Florida conducted feasibility study of reclaiming water for reuse. The treatment train of the pilot WRRF is to nitrify the secondary effluent from WWTP effluent using UF, RO, and UV disinfection. The target is to achieve total nitrogen < 1.5 mg/l, total phosphorus < 0.02 mg/l, BOD5 < 5 mg/l, and TSS < 5 mg/l. A pilot scale was tested with flow rate of 20 GPD. The influent has concentration of total nitrogen of 19.7 mg/l and total phosphorus of 2.2 mg/l, while the effluent has concentration of total nitrogen of 1.20 mg/l and total phosphorus of 0.007 mg/l. If the capital and O&M costs that were valid from the California tests were also applicable to Southern Florida, please answer the following if the WRRF is to be built to have a flow rate of 10 MGD:
- What would be the unit capital and O&M costs according to the equations present in this chapter?
- What would be the total capital? If the design life expectancy is 50 years, what would be the total O&M cost?
- If all the 10 MGD reclaimed water were sold for irrigation purpose at a price of $5/1000 gal, how many years the capital costs could be recovered after the WRRF is built and in operation?
- In your option, what would be the major factors that would affect your cost and benefit analysis of this project?
Table 10.34 Zenon MBR (CA Title 22). a Equipment costs provided by Zenon Technologies.
Expense ($)
Cost per amount of flow (MGD)
0.5
1.0
2.0
5.0
10
15
20
Concrete
610 400
1 062 400
2 012 000
4 722 400
9 684 800
13 448 800
19 054 400
Excavation and backfill (10%)
61 040
106 240
201 200
472 240
968 480
1 344 880
1 905 440
Miscellaneous metals (4%)
24 416
42 496
80 480
188 896
387 392
537 952
762 176
Yard piping (7%)
42 728
74 368
140 840
330 568
677 936
941 416
1 333 808
Total concrete
738 584
1 285 504
2 434 520
5 714 104
11 718 608
16 273 048
23 055 824
Equipmenta
2 963 000
3 704 000
7 037 000
14 815 000
24 306 000
27 778 000
29 630 000
Tax and delivery (11%)
325 930
407 440
774 070
1 629 650
2 673 660
3 055 580
3 259 300
Installation (20%)
592 600
740 800
1 407 400
2 963 000
4 861 200
5 555 600
5 926 000
Manufacturer services (4%)
118 520
148 160
281 480
592 600
972 240
1 111 120
1 185 200
Total mechanical
4 000 050
5 000 400
9 499 950
20 000 250
32 813 100
37 500 300
40 000 500
Protective coating (7%)
331 704
440 013
835 413
1 800 005
3 117 220
3 764 134
4 413 943
Electricity (10%)
473 863
628 590
1 193 447
2 571 435
4 453 171
5 377 335
6 305 632
Instrumentation (10%)
473 863
628 590
1 193 447
2 571 435
4 453 171
5 377 335
6 305 632
Housing
0
0
0
0
0
0
0
Subtotal
6 018 065
7 983 098
15 156 777
32 657 230
56 555 269
68 292 152
80 081 531
Contractor overhead and profit (15%)
902 710
1 197 465
2 273 517
4 898 584
8 483 290
10 243 823
12 012 230
Scope‐of‐project contingency (30%)
1 805 420
2 394 929
4 547 033
9 797 169
16 966 581
20 487 646
24 024 459
Total construction cost
8 726 195
11 575 492
21 977 327
47 352 983
82 005 140
99 023 620
116 118 221
Engineering design (10%)
872 619
1 157 549
2 197 733
4 735 298
8 200 514
9 902 362
11 611 822
Total capital cost
9 598 814
12 733 041
24 175 059
52 088 281
90 205 654
108 925 982
127 730 043
Cost per gal ($)
19.20
12.73
12.09
10.42
9.02
7.26
6.39
O&M (5% construction cost)
436 310
578 775
1 098 866
2 367 649
4 100 257
4 951 181
5 805 911
10.5.3 Projects
10.5.3.1 Xiongan Project
If the Xiongan is planned for populations of 1, 2, and 5 million in 5, 10, and 20 years, respectively, what percentage of wastewater should be reclaimed? Please design a system that could be applied to reclaim wastewater using the similar treatment train as in the previous problem to achieve the target percentage. Please use the capital and O&M cost diagram to estimate the capital and O&M costs for 50 years.
10.5.3.2 Community Proposal Project
Please make an appointment with officials in your hometown and collect waste reuse data. According to the data, please do the following:
- Calculate the percentage of water reuse rates.
- Determine whether the city is sustainable in terms of water resources.
- Please design a water reuse system so that the city becomes sustainable in terms of water resources.
- Please estimate the capital and O&M costs of your proposed project for 20 and 50 years.
- What is the return‐on‐investment period for the water reuse system?
References
- Andrade, A and Schuling, O. (1999). Literature search, digest and assessment concerning struvite recovery for recycling from waste waters. Final Report for CEEP (CEFIC). Holland: Geochem Research BV/Utrecht University Holland.
- Appeldoorn, K.J., Kortstee, G.J.J.K., and Zehnder, A.B. (1992). Biological phosphate removal by activated sludge under defined conditions. Water Research 26 (4): 453–460.
- Bark, K., Sponner, A., Kämpfer, P. et al. (1992). Differences in polyphosphate adsorption by Acinetobacter isolates from wastewater producing polyphosphate: AMP phosphotransferase. Water Research 26 (10): 1379–1388.
- Britton, A., Koch, F.A., Mavinic, D.S. et al. (2005). Pilot‐scale struvite recovery from anaerobic digester supernatant at an enhanced biological phosphorus removal wastewater treatment plant. Journal of Environmental Science 4: 265–277.
- Celen, I. and Türker, M. (2001). Recovery of ammonia as struvite from anaerobic digester effluents. Environmental Technology 22: 1263–1272.
- Ishii, S.K.L. and Boyer, T.H. (2015). Life cycle comparison of centralized wastewater treatment and urine source separation with struvite precipitation: focus on urine nutrient management. Water Research 79: 88–103.
- Lahav, O., Telzhensky, M., Zewuhn, A. et al. (2013). Struvite recovery from municipal‐wastewater sludge centrifuge supernatant using seawater NF concentrate as a cheap Mg (II) source. Separation and Purification Technology 108: 103–110.
- Oehmen, A., Lemos, P.C., Carvalho, G. et al. (2007). Advances in enhanced biological phosphorus removal: from micro to macro scale. Water Research 41: 2271–2300.
- Pinnekamp, J., Montag, D., Gethke, K., and Herbst, H. (2007). Rückgewinnung eines schadstofffreien, mineralischen Kombinationsdüngers Magnesiumammoniumphosphat – MAP aus Abwasser und Klärschlamm. UBA‐Texte 25/07. Dessau‐Rosslau.
- Pinnekamp, J., Baumann, P., Cornel, P. et al. (2013). Stand und Perspektiven der Phosphorrückgewinnung aus Abwasser und Klärschlamm – Teil 1, KA Korrespondenz Abwasser, Abfall, 60/10, 837–844.
- Rasmussen, H., Bruus, J.H., Keiding, K., and Nielsen, P.H. (1994). Observations of dewaterability and physical, chemical and microbiological changes in anaerobically stored activated sludge from a nutrient removal plant. Water Research 28 (2): 417.
- Schön, G.S., Geywitz, S., and Mertens, F. (1993). Influence of dissolved oxygen and oxidation reduction potential on phosphate release and uptake by activated sludge from sewage plants with enhanced biological phosphorus removal. Water Research 27 (3): 349–354.
- Seviour, R.J., Mino, T., and Onuki, M. (2003). The microbiology of biological phosphorus removal in activated sludge system. FEMS Microbiology Reviews 27: 99–127.
- Siegrist, H. (1996). Nitrogen removal from digester supernatant‐comparison of chemical and biological methods. Water Science and Technology 34: 399–406.
- Turker, M. and Celen, I. (2007). Removal of ammonia as struvite from anaerobic digester effluents and recycling of magnesium and phosphate. Bioresource Technology 98 (8): 1529–1534.
- WateReuse Foundation (2009). Decision Support System for Selection of Satellite vs. Regional Treatment for Reuse Systems. Project: 04‐14.
- Webb K.M., Bhargava S.K., Priestley A.J. et al. (1995). Struvite (MgNH4PO4.6H2O) precipitation: potential for nutrient removal and re‐use from wastewaters. Chemistry in Australia 62: 42–44.