
Chapter 5. Moving from local to remote topologies
This chapter covers
- The Storm cluster
- Fault tolerance within a Storm cluster
- Storm cluster installation
- Deploying and running topologies on a Storm cluster
- The Storm UI and the role it plays
Imagine the following scenario. You’re tasked with implementing a Storm topology for performing real-time analysis on events logged within your company’s system. As a conscientious developer, you’ve decided to use this book as a guideline for developing the topology. You’ve built it using the core Storm components covered in chapter 2. You’ve applied the topology design patterns you learned about in chapter 3 while determining what logic should go into each bolt, and you’ve followed the steps in chapter 4 to provide at-least-once processing for all tuples coming into your topology. You’re ready to hook the topology up to a queue receiving logging events and have it hum along. What do you do next?
You can run your topology locally as in chapters 2, 3, and 4, but doing so won’t scale to the data volume and velocity that you’re expecting. You need to be able to deploy your topology to an environment that’s built for handling production-level data. This is where the “remote” (also known as “production”) Storm cluster comes into play—an environment built to handle the demands of production-level data.
Note
As you learned in chapter 1, volume refers to the amount of data entering your system and velocity refers to the pace at which that data flows through your system.
Running our topologies locally and simulating a Storm cluster within a single process has served our needs so far and is useful for development and testing purposes. But local mode doesn’t support the scaling discussed in chapter 3 nor the first-class guaranteed processing we learned about in chapter 4. An actual Storm cluster is needed for both of these.
This chapter will begin by explaining the parts of a Storm cluster and the roles they play, followed by a Q&A session on how Storm provides fault tolerance. We’ll then move on to installing a Storm cluster and deploying and running your topologies against the installed cluster. We’ll also cover an important tool you can use to make sure your topology is healthy: the Storm UI. Along the way, we’ll provide a preview into the tuning and troubleshooting topics that will be covered in chapters 6 and 7.
It all starts with the Storm cluster, so let’s expand on our worker nodes discussion from chapter 3.
5.1. The Storm cluster
Chapter 3 scratched the surface of a worker node and how it runs a JVM, which in turn runs executors and tasks. In this section, we’re going to go much deeper, starting with the Storm cluster as a whole. A Storm cluster consists of two types of nodes: the master node and the worker nodes. A master node runs a daemon called Nimbus, and the worker nodes each run a daemon called a Supervisor. Figure 5.1 shows a Storm cluster with one master node and four worker nodes. Storm supports only a single master node, whereas it’s likely your cluster will have a different number of worker nodes based on your needs (we’ll cover how to determine this number in chapters 6 and 7).
Figure 5.1. Nimbus and Supervisors and their responsibilities inside a Storm cluster

The master node can be thought of as the control center. In addition to the responsibilities listed in figure 5.1, this is where you’d run any of the commands—such as activate, deactivate, rebalance, or kill—available in a Storm cluster (more on these commands later in the chapter). The worker nodes are where the logic in the spouts and bolts is executed.
Another big part of a Storm cluster is Zookeeper. Storm relies on Apache Zookeeper[1] for coordinating communication between Nimbus and the Supervisors. Any state needed to coordinate between Nimbus and the Supervisors is kept in Zookeeper. As a result, if Nimbus or a Supervisor goes down, once it comes back up it can recover state from Zookeeper, keeping the Storm cluster running as if nothing happened.
Figure 5.2 shows a cluster of Zookeeper nodes integrated into the Storm cluster. We’ve removed the worker processes from this figure so you can focus on where Zookeeper fits as it coordinates communication between Nimbus and Supervisors.
Figure 5.2. The Zookeeper Cluster and its role within a Storm cluster
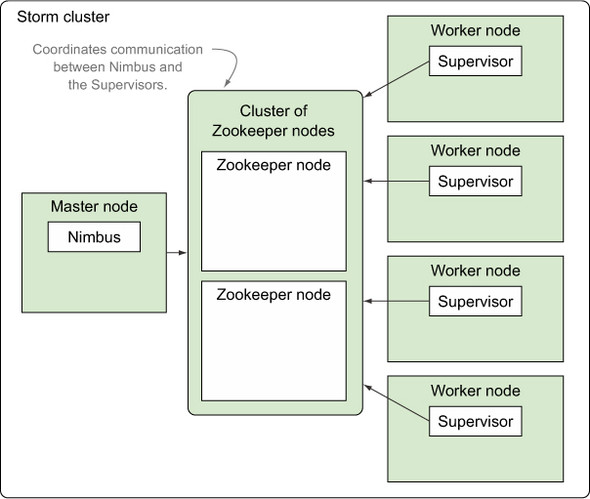
Throughout the remainder of the book, any time we mention “Storm cluster,” we’re referring to the master, worker, and Zookeeper nodes.
Although the master node and Zookeeper are important parts of a Storm cluster, we’re going to shift our focus to worker nodes for now. Worker nodes are where the spout and bolt processing occurs, making them the central place for much of our tuning and troubleshooting efforts in chapters 6 and 7.
Note
Chapters 6 and 7 will explain when you might want to increase the number of worker processes running on a worker node and when and how you might reach a point of diminishing returns. These chapters will also discuss tuning within a worker process, so it makes sense to explain the various parts of a worker process.
5.1.1. The anatomy of a worker node
As mentioned earlier, each worker node has a Supervisor daemon that’s tasked with administering the worker processes and keeping them in a running state. If a Supervisor notices that one of the worker processes is down, it will immediately restart it. What’s a worker process exactly? We mentioned that it was a JVM, but as you know from chapter 3, there’s more to it.
Each worker process executes a subset of a topology. This means that each worker process belongs to a specific topology and that each topology will be run across one or more worker processes. Normally, these worker processes are run across many machines within the Storm cluster.
In chapter 3, you learned about executors (threads) and tasks (instances of spouts/bolts). We discussed how a worker process (JVM) runs one or more executors (threads), with each thread executing one or more instances of spouts/bolts (tasks). Figure 5.3 illustrates this concept.
Figure 5.3. A worker process consists of one or more executors, with each executor consisting of one or more tasks.

Here are the key takeaways:
- A worker process is a JVM.
- An executor is a thread of execution within a JVM.
- A task is an instance of a spout or bolt being run within a thread of execution on the JVM.
Understanding these mappings is extremely important for the purposes of tuning and troubleshooting. For example, chapter 6 answers questions such as why you might want many tasks per executor, so understanding the relationship between an executor and its tasks is essential.
To bring the discussion of a worker node, worker processes, executors, and tasks full circle, let’s present them within the context of the credit card authorization topology from chapter 4.
5.1.2. Presenting a worker node within the context of the credit card au- uthorization topology
In this section we’ll present a hypothetical configuration for the credit card authorization topology in order to help you make the connection between the number of worker processes, executors, and tasks in the figures and the code for doing so. This hypothetical configuration can be seen in figure 5.4.
Figure 5.4. A hypothetical breakdown of a worker node with multiple worker processes, executors, and tasks for the credit card authorization topology

The setup in figure 5.4 would be achieved via the code in the following listing.
Listing 5.1. Configuration for our hypothetical Storm cluster

When we set the numWorkers in the Config, we’re configuring the worker processes desired for running this topology. We don’t actually force both worker processes to end up on the same worker node as depicted in figure 5.4. Storm will pick where they end up based on which worker nodes in the cluster have vacant slots for running worker processes.
Parallelism is when two threads are executing simultaneously. Concurrency is when at least two threads are making progress on some sort of computation. Concurrency doesn’t necessarily mean the two threads are executing simultaneously—something like time slicing may be used to simulate parallelism.
Having revisited the breakdown of a worker node, let’s see how Storm provides fault tolerance across the cluster’s various parts.
5.2. Fail-fast philosophy for fault tolerance within a Storm cluster
Remember the four pieces to the reliability puzzle discussed in chapter 4?
- A reliable data source with a corresponding reliable spout
- An anchored tuple stream
- A topology that acknowledges each tuple as it gets processed or notifies you of failure
- A fault-tolerant Storm cluster infrastructure
We’re finally at a point to discuss the last piece, a fault-tolerant Storm cluster infrastructure. The components of a Storm cluster have been designed with fault tolerance in mind. The easiest way to explain how Storm handles fault tolerance is to answer questions in the form of “What does Storm do when x happens?” The most important questions on fault tolerance are addressed in table 5.1.
Table 5.1. Fault tolerance questions and answers
|
Question |
Answer |
|---|---|
| What if a worker node dies? | Supervisor will restart it and new tasks will be assigned to it. All tuples that weren’t fully acked at time of death will be fully replayed by the spout. This is why the spout needs to support replaying (reliable spout) and the data source behind the spout also needs to be reliable (supporting replay). |
| What if a worker node continuously fails to start up? | Nimbus will reassign tasks to another worker. |
| What if an actual machine that runs worker nodes dies? | Nimbus will reassign the tasks on that machine to healthy machines. |
| What if Nimbus dies? | Because Nimbus is being run under supervision (using a tool like daemontools or monit), it should get restarted and continue processing like nothing happened. |
| What if a Supervisor dies? | Because Supervisors are being run under supervision (using a tool like daemontools or monit), they should get restarted like nothing happened. |
| Is Nimbus a single point of failure? | Not necessarily. Supervisors and worker nodes will continue to process, but you lose the ability to reassign workers to other machines or deploy new topologies. |
You can see that Storm maintains a fail-fast philosophy in the sense that every piece within this infrastructure can be restarted and will recalibrate itself and move on. If tuples were in mid-process during a failure, they’ll be failed automatically.
It doesn’t matter whether the unit of infrastructure that failed is an instance (task) or a thread (executor) or a JVM (worker process) or a VM (worker node). At each level, safeguards are in place to ensure that everything gets restarted automatically (because everything runs under supervision).
We’ve talked about the benefits a Storm cluster provides in terms of parallelism and fault tolerance. How do you go about getting such a cluster up and running?
5.3. Installing a Storm cluster
The Storm wiki does an excellent job describing how to set up a Storm cluster. The steps found on the wiki include these:
- Find information on setting up Zookeeper along with some helpful tips on maintaining the Zookeeper cluster.
- Install the required Storm dependencies on the master and worker machines.
- Download and extract a Storm release to the master and worker machines.
- Configure the master and worker nodes via the storm.yaml file.
- Launch the Nimbus and Supervisor daemons under supervision using the Storm script.
We’ll cover each of these steps in more detail next.
Note
What does it mean to run a process under supervision? It means that some supervisory process manages the actual process being run. Therefore, if the process being “supervised” fails, the supervisory process can automatically restart the failed process. This is a key element in providing fault tolerance in Storm.
5.3.1. Setting up a Zookeeper cluster
The steps for setting up a Zookeeper cluster are outside the scope of this book. You can find a thorough explanation of how to install Zookeeper on the Apache Zookeeper project page at http://zookeeper.apache.org. Follow those steps to get your cluster up and running.
Keep the following in mind when running Zookeeper:
- Zookeeper is designed to “fail fast,” meaning it will shut down if an error occurs that it can’t recover from. This isn’t desirable within a Storm cluster because Zookeeper coordinates communication between Nimbus and the Supervisors. Because of this, we must have a supervisory process manage the Zookeeper instances so that if a Zookeeper instance does go down, the cluster as a whole can continue handling requests. The supervisory process will handle restarting any failed individual Zookeeper server, allowing the Zookeeper cluster to be self-healing.
- Because Zookeeper is a long-running process, its transaction logs can get quite large. This will eventually result in Zookeeper running out of disk space. Therefore, it’s critical to set up some sort of process to compact (and even archive) the data produced in these logs.
5.3.2. Installing the required Storm dependencies to master and worker nodes
The next step is to install the required Storm dependencies to the machines you’ve dedicated to running Nimbus and the Supervisors. Table 5.2 lists these dependencies.
Table 5.2. External dependencies for Storm master and worker nodes
|
Dependency |
Why it’s needed |
Link to download |
|---|---|---|
| Java 6+ | Storm runs on the JVM and the latest version of Storm runs on Java 6. | www.oracle.com/us/technologies/java/overview/index.html |
| Python 2.6.6 | The standard command-line tool for Storm is Python wrapped around Java. | https://www.python.org/downloads/ |
Once the required external dependencies have been installed to each of the machines hosting Nimbus and the Supervisors, you can install Storm to those machines.
5.3.3. Installing Storm to master and worker nodes
The Storm installations can currently be found at http://storm.apache.org/downloads.html. For this book, we used apache-storm-0.9.3. You should download the Storm release zip file to each node and extract the contents of the zip file somewhere on each of the machines. The location is up to you; something like /opt/storm is one example. Figure 5.5 shows the extracted contents in an /opt/storm directory.
Figure 5.5. Extracted contents of a Storm release zip

There are two files in this figure that we’re particularly interested in for this chapter: /opt/storm/bin/storm and /opt/storm/conf/storm.yaml. Let’s discuss storm.yaml and its purpose next.
5.3.4. Configuring the master and worker nodes via storm.yaml
The Storm release contains a conf/storm.yaml file that configures the Storm daemons. This file overrides configuration settings found in defaults.yaml.[2] It’s likely that you’ll want to override at least some of the values; many of the defaults point to “localhost” for a machine name. Table 5.3 lists some of the initial configuration options you may want to override in order to get your Storm cluster up and running.
2 You can find defaults.yaml at https://github.com/apache/storm/blob/master/conf/defaults.yaml.
Table 5.3. storm.yaml properties you may want to override for your Storm installations
|
Properties |
Description |
Default value |
|---|---|---|
| storm.zookeeper. servers | The lists of hosts in the Zookeeper cluster for your Storm cluster. |
storm.zookeeper.servers: - "localhost" |
| storm.zookeeper. port | Needed if the port your Zookeeper cluster uses is different from the default. | storm.zookeeper.port: 2181 |
| storm.local.dir | The directory that the Nimbus and Supervisor daemons will use for storing small amounts of state. You must create these directories and give them proper permissions on each machine that’ll be running Nimbus and workers. | storm.local.dir: "storm-local" |
| java.library.path | The location of the Java installation. | java.library.path: "/usr/local/lib:/opt/local/lib:/usr/lib" |
| nimbus.host | The hostname of the Nimbus machine. | nimbus.host: "localhost" |
| supervisor.slots.ports | For each worker machine, the ports that are used for receiving messages. The number of available ports will determine the number of worker processes Storm runs on each worker machine. |
supervisor.slots.ports: – 6700 – 6701 – 6702 – 6703 |
You’ll need to update the configuration on each node in the cluster. Doing so can become tedious if you have a cluster containing several worker nodes. For this reason, we recommend using an external tool such as Puppet[3] for automating the deployment and configuration of each node.
5.3.5. Launching Nimbus and Supervisors under supervision
As mentioned earlier, running daemons under supervision is a critical step in setting up a Storm cluster. The supervisory processes allow our system to be fault-tolerant. What does this mean exactly? Why is it needed?
Storm is a fail-fast system, meaning that any Storm process encountering an unexpected error will stop. Storm is designed so that any process can safely stop at any point and recover when the process is restarted. Running these processes under supervision allows them to be restarted whenever a failure occurs. Thus, your topologies are unaffected by failures in the Storm daemons. To run the Storm daemons under supervision, execute the following commands:
- Starting Nimbus— Run bin/storm nimbus under supervision on the master machine.
- Starting Supervisors— Run bin/storm supervisor under supervision on each worker machine.
- Storm UI— Run bin/storm ui under supervision on the master machine.
Running the Storm daemons is the last step in setting up a Storm cluster. With everything up and running, your cluster is ready to start accepting topologies. Let’s see how you go about getting your topology to run on a Storm cluster.
5.4. Getting your topology to run on a Storm cluster
In previous chapters we’ve run our topologies locally. This approach is fine for learning the fundamentals of Storm. But if one wants to reap the benefits Storm provides (especially along the lines of guaranteed message processing and parallelism), a remote Storm cluster is required. In this section we’ll show you how to do this by taking some of the code from the credit card authorization topology in chapter 4 and doing the following:
- Revisit the code for wiring together the topology components
- Show the code for running that topology in local mode
- Show the code for running that topology on a remote Storm cluster
- Show how to package and deploy that code to the remote Storm cluster
5.4.1. Revisiting how to put together the topology components
Before we get into the code for running a topology in both local mode and on a remote cluster, let’s quickly rehash the code for wiring together the components for the topology from chapter 4, the credit card authorization topology, to provide some context. We’ve already presented some of this code in section 5.1.2, but the next listing shows it in a more structured format.
Listing 5.2. CreditCardTopologyBuilder.java for building the credit card authorization topology
public class CreditCardTopologyBuilder {
  public static StormTopology build() {
    TopologyBuilder builder = new TopologyBuilder();

    builder.setSpout("rabbitmq-spout", new RabbitMQSpout(), 1);

    builder.setBolt("check-status", new VerifyOrderStatus(), 1)
           .shuffleGrouping("rabbitmq-spout")
           .setNumTasks(2);

    builder.setBolt("authorize-card", new AuthorizeCreditCard(), 1)
           .shuffleGrouping("check-status")
           .setNumTasks(2);

    builder.setBolt("notification", new ProcessedOrderNotification(), 1)
           .shuffleGrouping("authorize-card")
           .setNumTasks(1);

    return builder.createTopology();

  }
}
We’ve encapsulated the code for building the topology in CreditCardTopologyBuilder.java because this code doesn’t change, regardless of whether we’re running in local mode or on a Storm cluster. This is something we started doing in chapter 3 and the advantage of this approach is it allows us to call the code for building the topology from multiple places without having to duplicate code.
Now that we have the code for building the topology, we’ll show you how to take this built topology and run it locally.
5.4.2. Running topologies in local mode
Local mode is useful when developing topologies. It allows you to simulate a Storm cluster in process on your local machine so you can quickly develop and test your topologies. This provides the benefit of a quick turnaround between making a change in code and functionally testing that change in a running topology. There are some drawbacks to local mode, though:
- You can’t achieve the parallelism you would with a remote Storm cluster. This makes testing parallelism changes difficult, if not impossible in local mode.
- Local mode won’t reveal potential serialization issues when Nimbus attempts to serialize instances of spouts and bolts to the individual worker nodes.
The following listing shows the class, LocalTopologyRunner, with a main() method that takes the topology we built in listing 5.2 and runs it locally.
Listing 5.3. LocalTopologyRunner.java, which runs the topology on a local cluster
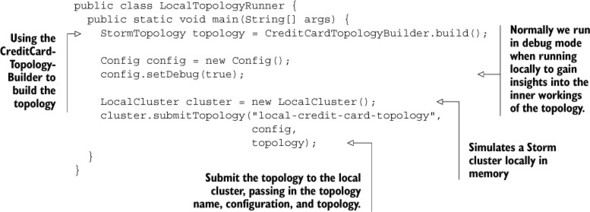
The code in this listing should be familiar to you. What we have yet to address is the code for submitting the topology to a remote Storm cluster. Fortunately, this code isn’t that much different. Let’s take a look.
5.4.3. Running topologies on a remote Storm cluster
The code for running your topology remotely is similar to running it locally. The only difference is the code for submitting the topology to a cluster. You may also want a slightly different configuration as well, because local mode doesn’t support some of the things (parallelism and guaranteed message processing) that a remote cluster supports. The next listing shows this code in a class we call RemoteTopologyRunner.
Listing 5.4. RemoteTopologyRunner, which submits the topology to a remote cluster

You’ll notice that the only differences are a slightly different configuration and using StormSubmitter.submitTopology instead of LocalCluster.submitTopology.
Note
We’ve wrapped the building, running locally, and running remotely of our topology within three different classes (CreditCardTopologyBuilder, LocalTopologyRunner, and RemoteTopologyRunner). Although you can set up your code however you please, we’ve found this split works well and we use it across all our topologies.
Now that we’ve written the code for running our topologies on a remote cluster, let’s shift our attention to physically getting that code onto the Storm cluster so it can be run.
5.4.4. Deploying a topology to a remote Storm cluster
What does it mean to “deploy” your topology to a Storm cluster? By “deploy,” we mean physically copying a JAR containing your topology’s compiled code to the cluster so it can be run. You will need to deploy your topology from a machine with a properly-configured Storm installation. Figure 5.6 provides a refresher on the extracted contents of a Storm release zip.
Figure 5.6. Extracted contents of a Storm release zip

You’ll want to make sure you update the /opt/storm/conf/storm.yaml file so the nimbus.host property is set to the proper location. We’re also interested in the /opt/storm/bin/storm file for this step: this is the executable you’ll run in order to deploy your topology JAR to the remote cluster. Figure 5.7 shows the command you’d run to deploy your topology. You’ll notice in the figure that we reference the full location for the storm executable via /opt/storm/bin/storm. If you don’t want to do this, put /opt/storm/bin on your PATH and you can directly reference the storm command from anywhere on your machine.
Figure 5.7. The command for deploying your topology to a Storm cluster

After you execute the command in figure 5.7, your topology will be up and running on the Storm cluster. Once your topology is running, how do you know it’s actually working and processing data as expected? This is where you’d look to the Storm UI, which is discussed next.
5.5. The Storm UI and its role in the Storm cluster
The Storm UI is the central place to find diagnostics on the Storm cluster and individual topologies. As mentioned in section 5.3.5, running the command /bin/storm ui on Nimbus will start the Storm UI. Two properties in defaults.yaml affect where to find the Storm UI:
- nimbus.host— The hostname of the Nimbus machine
- ui.port— The port number to serve up the Storm UI (defaults to 8080)
Once it’s running, enter http://{nimbus.host}:{ui.port} in a web browser to get to the Storm UI.
The Storm UI has several sections:
- The Cluster Summary screen
- The individual topology summary screen
- Screens for each of the spouts and bolts
Each screen shows information related to different parts of the Storm cluster at varying levels of granularity. The Cluster Summary screen is related to the Storm cluster as a whole, as seen in figure 5.8.
Figure 5.8. The Cluster Summary screen shows details for the entire Storm cluster.

Clicking on a particular topology link (such as github-commit-count in figure 5.8) takes you to a topology summary screen. This screen shows information related to the specific topology, as you can see in figure 5.9.
Figure 5.9. The Topology summary screen shows details for a specific topology.

Let’s delve into each screen in more detail next.
5.5.1. Storm UI: the Storm cluster summary
The Storm Cluster Summary consists of four parts, as shown in figure 5.10.
Figure 5.10. The Cluster Summary screen of the Storm UI
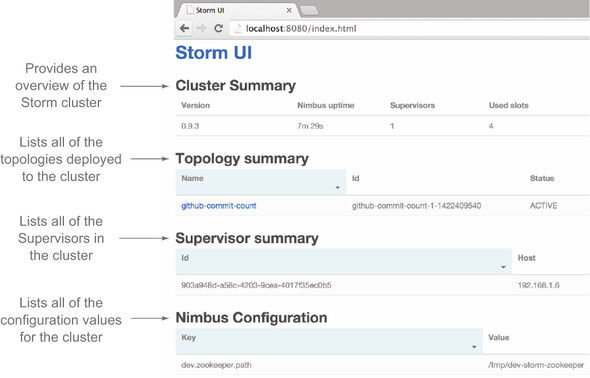
Each section of this screen is explained in more detail in the following sections.
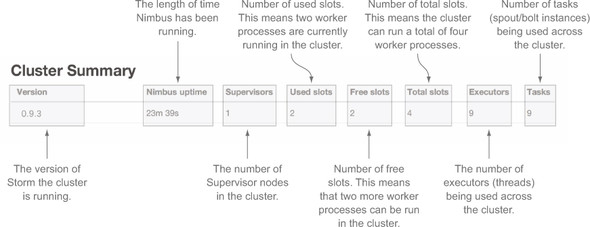
Cluster Summary
The Cluster Summary section provides a small but useful overview of your Storm cluster. You’ll notice the term slots in figure 5.11. A slot corresponds to a worker process, so a cluster with two used slots means there are two worker processes running on that cluster. Figure 5.11 provides more detail on each of the columns in this section.
Figure 5.11. The Cluster Summary section on the Cluster Summary screen of the Storm UI
Topology summary
The Topology summary lists all of the topologies deployed to the cluster. Figure 5.12 provides more detail on what information you see in this section.
Figure 5.12. The Topology summary section on the Cluster Summary screen of the Storm UI

Supervisor summary
The Supervisor summary lists all the Supervisors in the cluster. Again, you’ll notice the term slots in figure 5.13. This corresponds to a worker process on a particular Supervisor node. Figure 5.13 provides more detail on what information you see in this section.
Figure 5.13. The Supervisor summary section on the Cluster Summary screen of the Storm UI

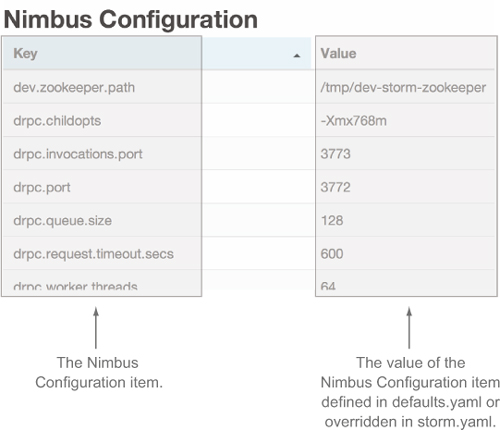
Nimbus Configuration
The Nimbus Configuration lists the configuration defined in defaults.yaml and any overridden values in storm.yaml. Figure 5.14 provides more detail on what information you see in this section.
Figure 5.14. The Nimbus Configuration section on the Cluster Summary screen of the Storm UI
Having covered the Cluster Summary screen, let’s dive into what the screen for an individual topology looks like. You can access this screen by clicking on a given topology name in the list of topologies.
5.5.2. Storm UI: individual Topology summary
The sections of the individual Topology summary screen can be seen in figure 5.15.
Figure 5.15. The Topology summary screen of the Storm UI

Each section of this screen is explained in more detail in the following sections.
Topology summary
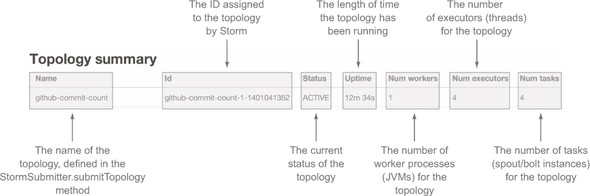
The Topology summary provides a small but useful overview of the topology being observed. Figure 5.16 provides more detail on each of the individual columns in this section.
Figure 5.16. The Topology summary section on the Topology summary screen of the Storm UI
Topology actions
The Topology actions section provides a UI for activating, deactivating, rebalancing, and killing your topology. Figure 5.17 describes these actions in more detail.
Figure 5.17. The Topology actions section on the Topology summary screen of the Storm UI

Topology stats
The Topology stats section provides some general statistics at the topology level. These statistics can be shown for all time, the past 10 minutes, the past 3 hours, or the past day. The time interval that’s selected is also applied to the spout and bolt stats sections, which are described next. Figure 5.18 provides more detail on the information you see in this section.
Figure 5.18. The Topology stats section on the Topology summary screen of the Storm UI

Spout stats
The Spouts section shows the statistics for all spouts in the topology. The statistics are for the window of time that’s selected in the Topology Stats section (all time, the past 10 minutes, the past 3 hours, or the past day). Figure 5.19 provides more detail on the information you see in this section.
Figure 5.19. The Spouts section on the Topology summary screen of the Storm UI

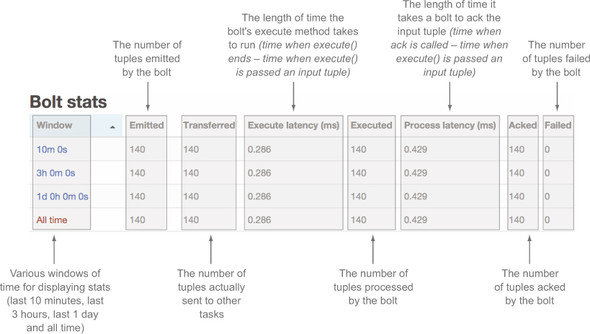
Bolt stats
The Bolts section shows the statistics for all bolts in the topology. The statistics are for the window of time that’s selected in the Topology Stats section (all time, the past 10 minutes, the past 3 hours, or the past day). Figure 5.20 provides more detail up to the Capacity column. Figure 5.21 offers more detail on the remaining columns.
Figure 5.20. The Bolts section on the Topology summary screen of the Storm UI, up to Capacity column

Figure 5.21. The Bolts section on the Topology summary screen of the Storm UI, remaining columns

Topology Configuration
The Topology Configuration lists the configuration defined for the particular topology being viewed. Figure 5.22 provides more detail on what information you see in this section.
Figure 5.22. The Topology Configuration section on the Topology summary screen of the Storm UI

From the Topology summary screen, you can dive into one of the individual spouts or bolts. You access an individual spout or bolt by clicking on a spout or bolt name while on the Topology summary screen.
5.5.3. Storm UI: individual spout/bolt summary
In the UI, an individual bolt contains six sections, as you can see in figure 5.23.
Figure 5.23. The bolt summary screen in the Storm UI

Component summary
The Component summary section shows some high-level information about the bolt or spout being observed. Figure 5.24 provides more details.
Figure 5.24. The Component Summary section for a bolt in the Storm UI

Bolt stats
The Bolt stats section provides much of the same information that you saw in the Bolts section for the Topology summary, but the information is limited to an individual bolt (see figure 5.25).
Figure 5.25. The Bolt stats section in the Storm UI
Input stats
The Input stats section shows statistics related to tuples being consumed by the bolt. The statistics are relative to a particular stream; in this case it’s the “default” stream. Figure 5.26 goes into more detail about this section.
Figure 5.26. The Input stats section for a bolt in the Storm UI

Output stats
The Output stats section shows statistics related to tuples being emitted by the bolt (see figure 5.27).
Figure 5.27. The Output stats section for a bolt in the Storm UI

Executors
The Executors section shows the statistics for all executors running instances of the particular bolt. We’ve split this section into two figures. Figure 5.28 shows the first part and figure 5.29 shows the second.
Figure 5.28. The Executors section for a bolt in the Storm UI, through Capacity column

Figure 5.29. The Executors section for a bolt in the Storm UI, remaining columns

Errors
The Errors section shows you a history of errors experienced by this bolt, as you can see in figure 5.30.
Figure 5.30. The Errors section for a bolt in the Storm UI

The Storm UI provides a wealth of information, giving you a clear picture of how your topology is operating in production. With the Storm UI, you can quickly tell if your topology is healthy or if something is amiss. You should easily be able to spot errors your topology is encountering while also being able to quickly identify other issues, such as bottlenecks.
As you can probably imagine, once you deploy your topology to a production Storm cluster, your job as a developer doesn’t end. Once it’s deployed, you enter a whole new world of making sure your topology is running as efficiently as possible. This is the world of tuning and troubleshooting. We’ve devoted the next two chapters to those tasks.
This chapter laid the foundation for tuning by explaining the parts of a Storm cluster and what each part of the Storm cluster does. We also provided a thorough explanation of the primary tool you’ll use while tuning and troubleshooting: the Storm UI.
5.6. Summary
In this chapter you learned the following:
- A Storm cluster consists of Nimbus, which acts as the control center, and Supervisors, which execute the logic in the instances of spouts and bolts.
- A Zookeeper cluster is necessary to run alongside a Storm cluster as it coordinates communication between Nimbus/Supervisors while also maintaining state.
- Supervisors run worker processes (JVMs), which in turn run executors (threads) and tasks (instances of spouts/bolts).
- How to install a Storm cluster, including the key configuration options that must be set in order to get the cluster running.
- How to deploy your topologies to a Storm cluster and how running them on the cluster is really no different than running them locally.
- What the Storm UI is and how the different parts of the Storm ecosystem map to the different screens of the Storm UI.
- What information each section of the Storm UI provides and how these pieces of information may be useful for tuning and troubleshooting your topologies.